Submitted 21 April 2015 Accepted 7 August 2015 Published25 August 2015
Corresponding author
Christopher Hassall, [email protected]
Academic editor
Sean Brady
Additional Information and Declarations can be found on page 13
DOI10.7717/peerj.1219
Copyright
2015 Hassall
Distributed under
Creative Commons CC-BY 4.0
OPEN ACCESS
Strong geographical variation in wing
aspect ratio of a damselfly,
Calopteryx
maculata
(Odonata: Zygoptera)
Christopher Hassall
School of Biology, University of Leeds, Leeds, United Kingdom
ABSTRACT
Geographical patterns in body size have been described across a wide range of species, leading to the development of a series of fundamental biological rules. However, shape variables are less well-described despite having substantial consequences for organism performance. Wing aspect ratio (AR) has been proposed as a key shape parameter that determines function in flying animals, with high AR corresponding to longer, thinner wings that promote high manoeuvrability, low speed flight, and low AR corresponding to shorter, broader wings that promote high efficiency long distance flight. From this principle it might be predicted that populations living in cooler areas would exhibit low AR wings to compensate for reduced muscle efficiency at lower temperatures. I test this hypothesis using the riverine damselfly,Calopteryx maculata, sampled from 34 sites across its range margin in North America. Nine hundred and seven male specimens were captured from across the 34 sites (mean=26.7±2.9 SE per site), dissected and measured to quantify the area and length of all four wings. Geometric morphometrics were employed to investigate geographical variation in wing shape. The majority of variation in wing shape involved changes in wing aspect ratio, confirmed indepen-dently by geometric morphometrics and wing measurements. There was a strong negative relationship between wing aspect ratio and the maximum temperature of the warmest month which varies from west-east in North America, creating a positive relationship with longitude. This pattern suggests that higher aspect ratio may be associated with areas in which greater flight efficiency is required: regions of lower temperatures during the flight season. I discuss my findings in light of research of the functional ecology of wing shape across vertebrate and invertebrate taxa.
Subjects Biogeography, Ecology, Entomology, Evolutionary Studies, Zoology
Keywords Wing morphology, Aspect ratio, Dispersal, Flight, Damselfly, Range, Odonata
INTRODUCTION
Powered flight has evolved independently in four different lineages: the pterosaurs, insects, birds, and bats, allowing animals to exploit novel niches and avoid predators. The adaptations that allowed each of these transitions to an aerial niche represent a suite of similar traits that can be broken down into a number of functional morphological components that influence inter- and intraspecific variation in flight performance. First, absolute body size is correlated with dispersal ability across a wide range of taxa
(Jenkins et al., 2007). Second, the ratio of body mass to wing area—known as “wing loading”—has a strong influence on the amount of thrust generated per wingbeat (Dudley, 2002). However, for the purposes of this study I am most interested in the third component of variation: that of wing shape. One of the principle measures of functional variation in wing shape is the length of the wing relative to the width, known as aspect ratio. In vertebrates, higher aspect ratio (longer, thinner wings) is predicted to give faster and more efficient flight (Norberg, 1989) and has been shown to be associated with migratory species in birds (M¨onkk¨onen, 1995). However, there has been speculation that the benefits of high aspect ratio may be reduced or even reversed at the low Reynolds numbers (a measure of aerodynamic turbulence, with lower numbers corresponding to the viscous forces experienced by small objects) experienced by insects (Ennos, 1989;Wootton, 1992). This speculation, along with the difference in the nature of flight—number, structure and locomotory independence of wings—between birds and insects complicates the formation of hypotheses concerning the implications of variation in flight morphology (Betts & Wootton, 1988;Johansson, S¨oderquist & Bokma, 2009). The literature on the functional relevance of insect wing morphology is heavily biased towards theory (Dudley, 2002), laboratory studies (Betts & Wootton, 1988;Marden, 1995) and observations of kinematics (R¨uppell, 1989;Wakeling & Ellington, 1997a;Wakeling & Ellington, 1997b;Wakeling & Ellington, 1997c) rather than quantitative data collected from the field.
Contrary to predictions for birds, where higher aspect ratios are associated with higher flight speeds (Alerstam et al., 2007), a number of findings point towards lower wing aspect ratio as being beneficial for dispersal in insects. Wing aspect ratio is lower in populations ofPararge aegeriathat have recently been founded (Hill, Thomas & Blakeley, 1999). Populations ofP. aegeria(Hughes, Dytham & Hill, 2007;Vandewoestijne & Van Dyck, 2011),
(McLachlan, 1986). While there are exceptions (increased fragmentation does not correlate with aspect ratio inPlebejus argus(Thomas, Hill & Lewis, 1998) orPararge aegeria(Merckx & Van Dyck, 2006)) these findings seem to suggest that lower wing aspect ratio in insects is associated with greater dispersal.
Odonata have been shown to be sensitive to temperature in a number of life history traits (Hassall & Thompson, 2008) and are responding to climate change by advancing phenology (Hassall et al., 2007) and expanding their ranges poleward (Hassall & Thompson, 2010;Hickling et al., 2006). As a result, odonates would be expected to follow the same geographical patterns as those described above: a decrease in wing aspect ratio to compensate for low wingbeat frequencies at low temperatures (as seen in Diptera), and a further decrease if the species is expanding its range (as seen in Lepidoptera). Wing morphology in Odonata may also be affected by a combination of sexual selection during intrasexual, agonistic interactions, intersexual courtship displays and dispersal (Johansson, S¨oderquist & Bokma, 2009). In the field, intrasexual territorial contests inCalopteryx maculataare determined by fat reserves (Marden & Rollins, 1994;Marden & Waage, 1990) and contests inPlathemis lydiaare determined by flight muscle ratio (Marden, 1989). In both cases, aspect ratio was shown not to influence the outcome of the contests. Sexual selection on courtship displays focuses on patterns of pigmentation inCalopteryx
species (Siva-Jothy, 1999;Waage, 1973). However, wing shape has been shown to vary with landscape structure inC. maculata(Taylor & Merriam, 1995) and between some closely-related species of Calopterygidae in Europe (Sadeghi, Adriaens & Dumont, 2009), although not all species exhibited distinct wing shapes. Based on these results, it seems that wing shape variation is under natural selection due to dispersal (within or between sites), rather than sexual selection.
Based on the reasoning presented above, I evaluate the hypothesis that a positive relationship would be found between temperature and aspect ratio to compensate for lower flight efficiency at lower temperatures. Uncertainties over the ecological role of morphology variation may stem from the partial sampling of geographical ranges (Hassall, 2013). Limited sampling of non-linear trends that occur over large spatial scales may produce misleading results and so I provide an analysis of wing shape variation across almost the entire range of the damselflyCalopteryx maculatain North America.
METHODS
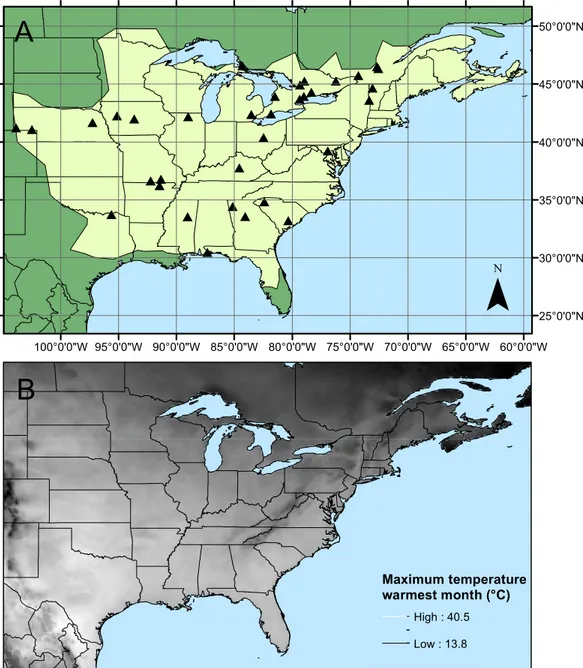
A total of 907 specimens of maleC. maculatawere collected from 34 sites across the range by 25 collectors (Fig. 1,Table 1). Collections took place between 13 May and 7 August 2010 and mean sample size from each site varied between 4 and 84 individuals (mean=26.7
±2.9 SE, details of sample sizes and mean measurements can be found inTable 1). Wings
were dissected from the body as close to the thorax as possible and mounted on adhesive tape (Scotch Matte Finish Magic Tape). Wings were scanned using the slide scanner on an Epson V500 PHOTO flatbed scanner with fixed exposure at 1200dpi. Wing length (the length from the costal end of the vein separating the arculus from the discoidal cell to the tip of the wing) and wing area were calculated for each of the four wings on each
Figure 1 Calopteryx maculatasampling sites.(A) The geographic distribution ofCalopteryx maculata
(light shaded area) in relation to the 34 locations at which specimens were collected. (B) Shows the geographical variation in the maximum temperature of the warmest month across the region.
individual. All measurements were carried out in ImageJ (Rasband, 1997–2007). During measurement, any damage to wings was noted and those measurements (length or area) which could not be accurately quantified were excluded. This resulted in the exclusion of 7 fore wing and 9 hind wing lengths, and 28 fore wing and 45 hind wing areas. Aspect ratio was then calculated separately for both fore and hind wings as wingspan2/wing area (see
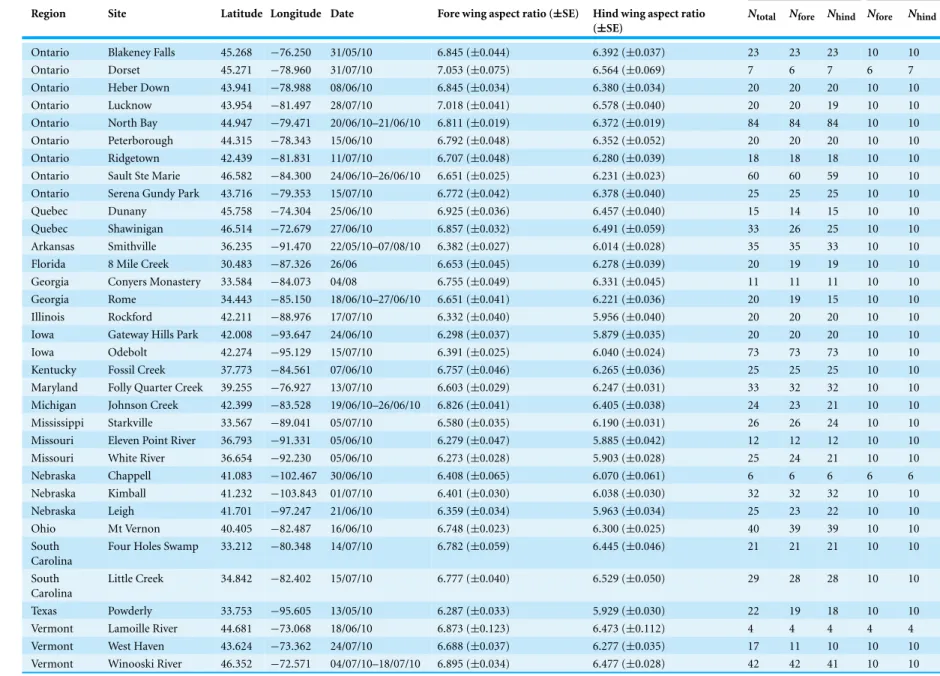
Table 1 Sampling data forCalopteryx maculata.Sampling site locations, sample sizes and aspect ratios of wings of male Calopteryx maculata. “Measurements” gives the sample size for the total number of measured specimens, “Geo Morph” gives the sample sizes used in the geometric morphometric analysis (Nfore=sample size for fore wings,Nhind=sample size for hind wings).
Measurements Geo Morph
Region Site Latitude Longitude Date Fore wing aspect ratio (±SE) Hind wing aspect ratio (±SE)
Ntotal Nfore Nhind Nfore Nhind
Ontario Blakeney Falls 45.268 −76.250 31/05/10 6.845 (±0.044) 6.392 (±0.037) 23 23 23 10 10 Ontario Dorset 45.271 −78.960 31/07/10 7.053 (±0.075) 6.564 (±0.069) 7 6 7 6 7 Ontario Heber Down 43.941 −78.988 08/06/10 6.845 (±0.034) 6.380 (±0.034) 20 20 20 10 10 Ontario Lucknow 43.954 −81.497 28/07/10 7.018 (±0.041) 6.578 (±0.040) 20 20 19 10 10 Ontario North Bay 44.947 −79.471 20/06/10–21/06/10 6.811 (±0.019) 6.372 (±0.019) 84 84 84 10 10 Ontario Peterborough 44.315 −78.343 15/06/10 6.792 (±0.048) 6.352 (±0.052) 20 20 20 10 10 Ontario Ridgetown 42.439 −81.831 11/07/10 6.707 (±0.048) 6.280 (±0.039) 18 18 18 10 10 Ontario Sault Ste Marie 46.582 −84.300 24/06/10–26/06/10 6.651 (±0.025) 6.231 (±0.023) 60 60 59 10 10 Ontario Serena Gundy Park 43.716 −79.353 15/07/10 6.772 (±0.042) 6.378 (±0.040) 25 25 25 10 10 Quebec Dunany 45.758 −74.304 25/06/10 6.925 (±0.036) 6.457 (±0.040) 15 14 15 10 10 Quebec Shawinigan 46.514 −72.679 27/06/10 6.857 (±0.032) 6.491 (±0.059) 33 26 25 10 10 Arkansas Smithville 36.235 −91.470 22/05/10–07/08/10 6.382 (±0.027) 6.014 (±0.028) 35 35 33 10 10 Florida 8 Mile Creek 30.483 −87.326 26/06 6.653 (±0.045) 6.278 (±0.039) 20 19 19 10 10 Georgia Conyers Monastery 33.584 −84.073 04/08 6.755 (±0.049) 6.331 (±0.045) 11 11 11 10 10 Georgia Rome 34.443 −85.150 18/06/10–27/06/10 6.651 (±0.041) 6.221 (±0.036) 20 19 15 10 10 Illinois Rockford 42.211 −88.976 17/07/10 6.332 (±0.040) 5.956 (±0.040) 20 20 20 10 10 Iowa Gateway Hills Park 42.008 −93.647 24/06/10 6.298 (±0.037) 5.879 (±0.035) 20 20 20 10 10 Iowa Odebolt 42.274 −95.129 15/07/10 6.391 (±0.025) 6.040 (±0.024) 73 73 73 10 10 Kentucky Fossil Creek 37.773 −84.561 07/06/10 6.757 (±0.046) 6.265 (±0.036) 25 25 25 10 10 Maryland Folly Quarter Creek 39.255 −76.927 13/07/10 6.603 (±0.029) 6.247 (±0.031) 33 32 32 10 10 Michigan Johnson Creek 42.399 −83.528 19/06/10–26/06/10 6.826 (±0.041) 6.405 (±0.038) 24 23 21 10 10 Mississippi Starkville 33.567 −89.041 05/07/10 6.580 (±0.035) 6.190 (±0.031) 26 26 24 10 10 Missouri Eleven Point River 36.793 −91.331 05/06/10 6.279 (±0.047) 5.885 (±0.042) 12 12 12 10 10 Missouri White River 36.654 −92.230 05/06/10 6.273 (±0.028) 5.903 (±0.028) 25 24 21 10 10 Nebraska Chappell 41.083 −102.467 30/06/10 6.408 (±0.065) 6.070 (±0.061) 6 6 6 6 6 Nebraska Kimball 41.232 −103.843 01/07/10 6.401 (±0.030) 6.038 (±0.030) 32 32 32 10 10 Nebraska Leigh 41.701 −97.247 21/06/10 6.359 (±0.034) 5.963 (±0.034) 25 23 22 10 10 Ohio Mt Vernon 40.405 −82.487 16/06/10 6.748 (±0.023) 6.300 (±0.025) 40 39 39 10 10 South
Carolina
Four Holes Swamp 33.212 −80.348 14/07/10 6.782 (±0.059) 6.445 (±0.046) 21 21 21 10 10
South Carolina
Little Creek 34.842 −82.402 15/07/10 6.777 (±0.040) 6.529 (±0.050) 29 28 28 10 10
Texas Powderly 33.753 −95.605 13/05/10 6.287 (±0.033) 5.929 (±0.030) 22 19 18 10 10 Vermont Lamoille River 44.681 −73.068 18/06/10 6.873 (±0.123) 6.473 (±0.112) 4 4 4 4 4 Vermont West Haven 43.624 −73.362 24/07/10 6.688 (±0.037) 6.277 (±0.035) 17 11 10 10 10 Vermont Winooski River 46.352 −72.571 04/07/10–18/07/10 6.895 (±0.034) 6.477 (±0.028) 42 42 41 10 10
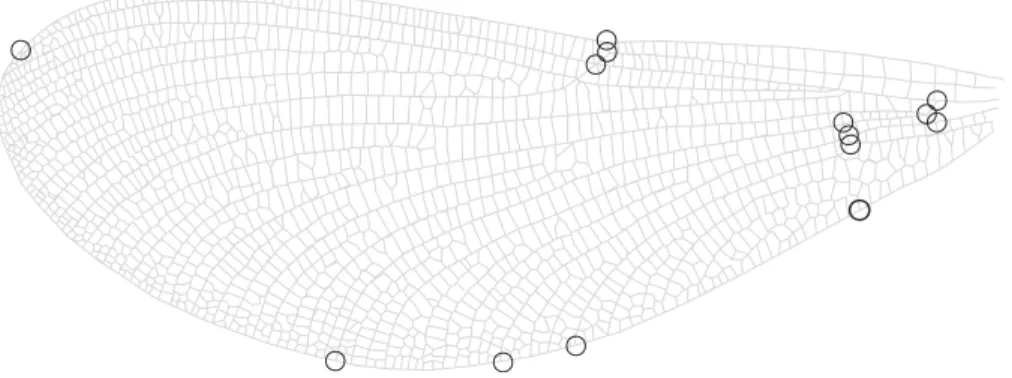
Figure 2 Wing landmarks forCalopteryx maculata.This figure shows the locations of 14 landmarks on the wing ofCalopteryx maculatathat were digitised and then analysed using geometric morphometrics to describe wing shape.
It has been suggested that wing aspect ratio does not provide sufficient detail to be morphologically informative in butterflies (Betts & Wootton, 1988) or dragonflies (Johansson, S¨oderquist & Bokma, 2009). Therefore, in addition to calculating aspect ratio, I also use geometric morphometrics to derive descriptors of the shape of the wing. A subset of up to 10 individuals from each site were selected at random and a set of 14 landmarks were digitised on 1 fore wing and 1 hind wing (Fig. 2) using tpsDig2 (v.2.12,
Rohlf, 2008). Mean locations for each of the 14 landmarks were found for each of the 34 sites. Principal components analysis (PCA) was carried out on these landmarks after Procrustes transformation (to correct for differences in size and rotation of the wing, leaving only shape variation) using the PAST software package (Hammer, Harper & Ryan, 2001). Relationships between the principal components and absolute measurements were investigated using Pearson correlations. Fore and hind wings were compared using paired Hotelling’st2tests in PAST to assess whether the two datasets could be combined. Raw data for fore and hind wing geometric morphometric landmarks can be found inTables S2and
S3, respectively.
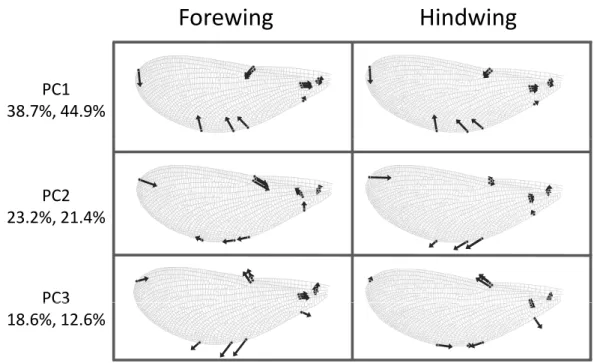
Figure 3 Shape variation inCalopteryx maculatawings. Deformation plots showing the effect of increasing the value of each principal component on the relative locations of wing landmarks. Arrows indicate the direction and extent of change. Percentages are the percentage of variation explained by each principal component for fore and hind wings, respectively.
RESULTS
Fore and hind wings vary significantly in shape (t2 =122,500,p≪0.001) and were completely separated along the PC1 axis which explained 80.2% of the variance in shape. As a result, fore and hind wing data are treated separately for the rest of the analysis.
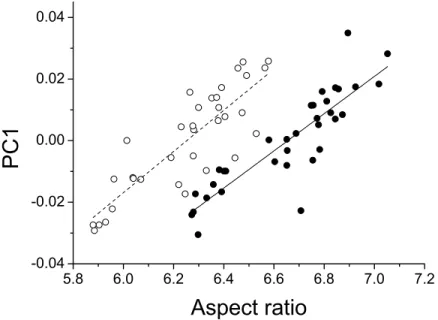
The first three principal components explaining fore and hind wing variation explained 38.7%, 23.2% and 18.6% (total 80.5%) of the variance in fore wing shape and 44.9%, 21.4%, and 12.6% (total 78.9%) of the variance in hind wing shape. PC1 in both cases involved a variation in the width of the wing relative to its length, such that an increase in PC1 leads to a decrease in the width of the wing relative to the length (Fig. 3). The PC2 and PC3 involved more subtle shape changes which were still consistent between wings. PC2 appears to involve a shortening of the pre-nodal region and a blunting of the tip, while PC3 corresponds to a movement of wing area towards the wing tip. PC1 was significantly positively correlated with aspect ratio (fore wings,r=0.875,p<0.001; hind wings, r=0.854,p<0.001,Fig. 4).
Aspect ratios for fore and hind wings were very highly correlated (R=0.978,p<0.001) and so only statistics for fore wings are presented here. Regression of aspect ratio on latitude showed a substantially improved fit when the quadratic term was included (linear AICc= −3.4; quadratic AICc= −10.5;ΔAICc=7.1). Regression of aspect ratio on longitude showed no improvement in fit when the quadratic term was included (linear AICc= −35.2; quadratic= −32.7;ΔAICc=2.5). The Bioclim temperature variables that best predicted fore wing aspect ratio were Bio5 (maximum temperature of the warmest
Figure 4 Aspect ratio vs. geometric morphometrics.Relationship between aspect ratio and the first principal component describing variation in wing shape for fore (closed symbols, solid line) and hind wings (open symbols, dotted line) inCalopteryx maculata. Points are mean values from each of 34 sampling sites for both variables.
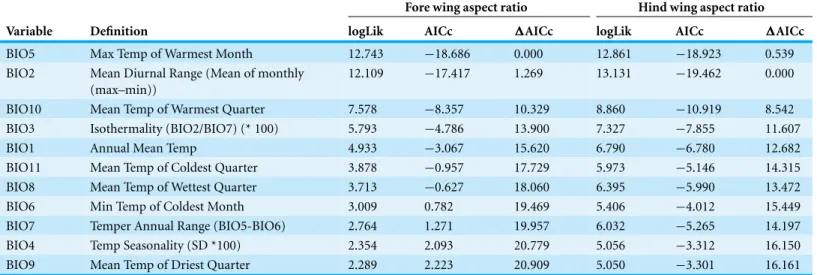
month, top model) and Bio2 (mean diurnal temperature range,ΔAIC=1.27). All other variables produced models withΔAIC>10 relative to the top model indicating negligible relative explanatory power (Table 2). Bio5 was selected as the temperature variable, as Bio5 models produced greater average support (ΔAIC=0,ΔAICc=0.54) than Bio2 (ΔAICc=0,ΔAICc=1.27), and represents a measure of absolute temperature (maximum temperature of the warmest month) rather than variability (mean diurnal range), which is closer to the initial hypothesis for the relationship between temperature and aspect ratio. The addition of a quadratic term did not improve the fit of a regression model describing the relationship between aspect ratio and Bio5 (linear AIC= −18.7; quadratic AIC= −16.2;ΔAIC=2.5).
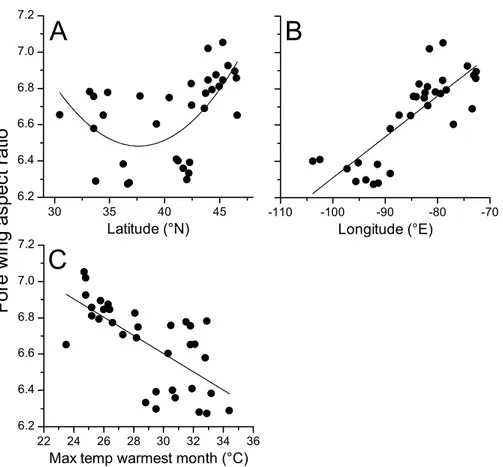
Geographical patterns of wing aspect ratio showed a complex spatial pattern (Fig. 5). There was a U-shaped relationship between aspect ratio and latitude (Table 3;Fig. 6A), explaining 32.5% of the variation in the data. However, this may be due to the distribution of sites (Fig. 5), with most of the mid-latitude sites being found inland in continental areas while northern and southern sites tended to be closer to the coast where temperatures are cooler (Fig. 1B). Indeed, the linear, positive relationship with longitude (Table 3;Fig. 6B), indicating a decline in aspect ratio further west, explained 66.0% of the variation in the data. Aspect ratio was also significantly negatively related to Bio5, which explained 44.6% of the variability in the data (Table 3,Fig. 6C). When the three models were compared, the longitude model explained by far the greatest proportion of the data (Akaike weight
Table 2 Model selection table.Model fits for linear regression of Bioclim variables (Haylock et al., 2008) on fore and hind wing aspect ratios in
Calopteryx maculata.
Fore wing aspect ratio Hind wing aspect ratio Variable Definition logLik AICc ΔAICc logLik AICc ΔAICc
BIO5 Max Temp of Warmest Month 12.743 −18.686 0.000 12.861 −18.923 0.539
BIO2 Mean Diurnal Range (Mean of monthly (max–min))
12.109 −17.417 1.269 13.131 −19.462 0.000
BIO10 Mean Temp of Warmest Quarter 7.578 −8.357 10.329 8.860 −10.919 8.542
BIO3 Isothermality (BIO2/BIO7) (* 100) 5.793 −4.786 13.900 7.327 −7.855 11.607
BIO1 Annual Mean Temp 4.933 −3.067 15.620 6.790 −6.780 12.682
BIO11 Mean Temp of Coldest Quarter 3.878 −0.957 17.729 5.973 −5.146 14.315
BIO8 Mean Temp of Wettest Quarter 3.713 −0.627 18.060 6.395 −5.990 13.472
BIO6 Min Temp of Coldest Month 3.009 0.782 19.469 5.406 −4.012 15.449
BIO7 Temper Annual Range (BIO5-BIO6) 2.764 1.271 19.957 6.032 −5.265 14.197
BIO4 Temp Seasonality (SD *100) 2.354 2.093 20.779 5.056 −3.312 16.150
BIO9 Mean Temp of Driest Quarter 2.289 2.223 20.909 5.050 −3.301 16.161
Figure 5 Aspect ratio variation inCalopteryx maculata.Distribution of fore wing aspect ratio values forCalopteryx maculatamales across the species range (light shaded area) in North America.
DISCUSSION
I provide the first comprehensive assessment of intraspecific variation in wing morphology across almost an entire range in a damselfly. The use of geometric morphometrics to analyse shape confirms that changes in aspect ratio (i.e., changes in the length of the wing relative to the width) constitute the major source of variation between specimens from different sites. I demonstrate a highly significant relationship between temperature (the maximum temperature of the warmest month) and fore wing shape, with higher
Figure 6 Aspect ratio inCalopteryx maculatain relation to latitude, longitude, and temperature.
Relationships between fore wing aspect ratio inCalopteryx maculataand (A) latitude, (B) longitude, and (C) the maximum temperature of the warmest month. Points are mean values from each of 34 sampling sites for both variables.
Table 3 Final models.Model performance and parameter estimates for regressions of aspect ratio on longitude, latitude, and the maximum temperature of the warmest month.
Estimate SE T P R2 AICc ΔAICc
Intercept 8.545 0.236 36.251 <0.001 0.660 −35.2 0.00
Longitude 0.022 0.003 8.057 <0.001
Intercept 8.111 0.279 29.106 <0.001 0.446 −18.7 16.53 Max T warmest month −0.005 0.001 −5.252 <0.001
Intercept 14.648 2.771 5.286 <0.001 0.325 −10.5 24.74
Latitude −0.434 0.142 −3.048 0.005
Latitude2 0.006 0.002 3.191 0.003
The literature on the functional relevance of aspect ratio has produced conflicting findings, but the present study offers some insights into this phenomenon that are consistent with previous studies in odonates. The presence of higher aspect ratio wings in regions that experience lower temperatures and at range margins is consistent with previous studies that found higher aspect ratios in cases where flight was more demanding. For example, higher aspect ratios have been associated with populations of calopterygid damselflies inhabiting fragmented habitat (Taylor & Merriam, 1995) and at the expanding edge of the geographical range (Hassall, Thompson & Harvey, 2009). Models predict that improved dispersal should evolve at range margins in response to lower habitat persistence or range expansion (Travis & Dytham, 1999), and these predictions are supported by observations in butterflies (Hill, Thomas & Blakeley, 1999). However, due to the observational nature of this study I cannot disentangle the effects of selection from those of phenotypic plasticity. Indeed, previous studies have demonstrated that while some flight morphological parameters are under genetic control, wing aspect ratio shows a plastic response to the environment inDrosophila(Azevedo et al., 1998). Note that while this study found evidence for a U-shaped relationship between latitude and aspect ratio, the western range margin appears to be associated with very low aspect ratio which is inconsistent with the range margin being associated with high aspect ratio wings. Indeed, the presence of the U-shaped relationship is more likely to be an artefact of the arrangement of sampling sites: the southern sites also tend to be in the eastern part of the range where the aspect ratio is highest (Fig. 5). If it is maximum summer temperature that is driving the variation in wing shape then it might be predicted that there would be little latitudinal pattern in aspects ratio, as maximum summer temperature does not vary consistently with latitude (Fig. 1B). Instead, the temperature variation in the summer tends to be associated with inland vs. coastal areas, with cooler climates in regions closer to the oceans. This coastal buffering of maximum summer temperature, even operating at a scale of 100 s of km (shown inFig. 1B), provides a potential explanation of the relationship between longitude and wing shape.
It is generally considered that higher aspect ratios provide a benefit for longer-distance flight (M¨onkk¨onen, 1995), efficient, gliding flight (Ennos, 1989), and flight at lower temperatures (Azevedo et al., 1998). A mechanism for this pattern might be provided by
Marden’s (1987) observation that wing aspect ratio is negatively related to lift production (controlling for body mass and flight muscle ratio) in conventional wingbeats, but that this is reversed in the case of clap-and-fling wingbeats of the sort used by Calopterygidae. Hence higher aspect ratios generate more lift inCalopteryxsp. which would enhance flight efficiency. However, this is equivocal in Lepidoptera (Betts & Wootton, 1988) where previous studies have found lower aspect ratio at lower temperatures (Vandewoestijne & Van Dyck, 2011). There remains a gap in the literature that needs to be filled with flight laboratory experiments of the functional implications of aspect ratio variation in odonates and other insects as have been carried out in some butterflies (Berwaerts, Matthysen & Van Dyck, 2008;Berwaerts, Van Dyck & Aerts, 2002;Davis et al., 2012). In particular, a test of the hypothesis that higher variation in aspect ratio can enhance flight efficiency at lower
temperatures in odonates is warranted given the increasing evidence for the correlation between aspect ratio and temperature.
The association between maximum temperature in the warmest month (which is associated with peaks in emergence in most odonates,Dijkstra & Lewington, 2006) makes sense given the vast quantities of energy expended by insects during this period.Calopteryx
males, in particular, compete for and hold territories as well as undertaking extensive aerial contests with competitor males that are energetic wars of attrition (Marden & Waage, 1990;Plaistow & Siva-Jothy, 1996). The small benefit in terms of increased lift from the change in wing shape may benefit males during these activities. However, analysis of these conflicts inCalopteryx virgoshowed that there was no difference in aspect ratio between winners and losers (Bots et al., 2012). Given the theoretical benefits and the observed interpopulation variation in aspect ratio, it is surprising that there has not been evolution to a biomechanical optimum across the species. One potential explanation is that aspect ratio is not heritable, but rather is determined by environmental factors as has been shown inDrosophila(Azevedo et al., 1998). It has been proposed that the fore and hind wings of
Calopteryxsp. have evolved under natural and sexual selection, respectively (Outomuro, Bokma & Johansson, 2012), but many studies of this kind have failed to sample from a wide geographical range and so the extent to which the findings of those studies can be generalised is unclear.
Previous studies have questioned the use of aspect ratio as a single numerical metric describing wing shape in insects, due to its inability to represent the complexity of wing morphology (Betts & Wootton, 1988;Johansson, S¨oderquist & Bokma, 2009). However, I find that a complex method of shape analysis using geometric morphometrics yields patterns that strongly resemble variation in the simpler concept of aspect ratio. However, it is clear from the explanatory power of those principal components that correlate with aspect ratio (38.7% and 44.9%) that there is a great deal of variability in addition to this dimension. It is worth noting that insects exhibit a great deal of variation in aspect ratio. Odonates have high aspect ratios compared to some other insects, for example
Drosophila viriliswith an aspect ratio of 2 (Vogel, 1957), andBombus terrestriswith an aspect ratio of 6.4. However, butterflies show higher aspect ratios of 9.8-10.5 inPararge aegeria(Berwaerts, Matthysen & Van Dyck, 2008;Berwaerts, Van Dyck & Aerts, 2002). The data presented here show aspect ratios of hind wings between 5.61 and 7.79 and of forewings between 5.70 and 7.56.Aeshna cyanea, a large odonate, exhibits aspect ratio of 8.4 and 11.6 for hind and fore wings, respectively (Ellington, 1984). What makes the odonate wing very different is the extent of the venation in odonate wings compared to other taxa. This venation may be associated with the pleating of the wing, which enhances aerodynamic performance relative to a smooth with of the same shape (Vargas, Mittal & Dong, 2008).
axis of the range highlighting the need to consider range-wide surveys to understand macroecological and macroevolutionary patterns (Hassall, 2013;Hassall, 2014). From the survey of studies that have included aspect ratio, it is clear that laboratory studies are needed to clarify the relationship between form and function in odonate wing shape.
ACKNOWLEDGEMENTS
I am extremely grateful to Arne Iserbyt, Mary Burnham, Chris Lewis, Shari Sokay, Darrin OBrien, Fred Sibley, GiffBeaton, George Harp, George Sims, Harris Luckham, John Abbott, Joseph Carson, Jeni Eggers and Eliott Porter, Jeffrey Willers, Michael Blust, Marion Dobbs, Mark Musselman, Pat Heithaus, Rick Abad, Ryan Spafford, Steve Hummel, Sarah Richer, Timothy Sesterhenn, William Lamp and Wade Worthen for giving so graciously of their time to assist with collections. Carley Centen provided valuable assistance in the field and Tom Langen provided assistance with logistics.
ADDITIONAL INFORMATION AND DECLARATIONS
Funding
The study was funded by a British Ecological Society Small Ecological Project Grant and I was supported by a Government of Canada Postdoctoral Fellowship and an Ontario MRI Fellowship. The funders had no role in study design, data collection and analysis, decision to publish, or preparation of the manuscript.
Grant Disclosures
The following grant information was disclosed by the author: British Ecological Society Small Ecological Project Grant. Government of Canada Postdoctoral Fellowship.
Ontario MRI Fellowship.
Competing Interests
The author declares there are no competing interests.
Author Contributions
• Christopher Hassall conceived and designed the experiments, performed the experi-ments, analyzed the data, contributed reagents/materials/analysis tools, wrote the paper, prepared figures and/or tables, reviewed drafts of the paper.
Data Availability
The following information was supplied regarding the deposition of related data: Figshare:10.6084/m9.figshare.1468360.
Supplemental Information
Supplemental information for this article can be found online athttp://dx.doi.org/ 10.7717/peerj.1219#supplemental-information.
REFERENCES
Alerstam T, Ros´en M, B¨ackman J, Ericson PGP, Hellgren O. 2007.Flight speeds among bird
species: allometric and phylogenetic effects.PLoS Biology5:e197
DOI 10.1371/journal.pbio.0050197.
Azevedo RBR, James AC, McCabe J, Partridge L. 1998.Latitudinal variation of wing:thorax size
ratio and wing-aspect ratio inDrosophila melanogaster.Evolution52:1353–1362
DOI 10.2307/2411305.
Berwaerts K, Matthysen E, Van Dyck H. 2008.Take-offflight performance in the butterfly
Pararge aegeriarelative to sex and morphology: a quantitative genetic assessment.Evolution 62:2525–2533DOI 10.1111/j.1558-5646.2008.00456.x.
Berwaerts K, Van Dyck H, Aerts P. 2002.Does flight morphology relate to flight performance?
An experimental test with the butterflyPararge aegeria.Functional Ecology16:484–491
DOI 10.1046/j.1365-2435.2002.00650.x.
Betts CR, Wootton RJ. 1988.Wing shape and flight behaviour in butterflies (Lepidoptera:
Papilionoidea and Hesperioidea): a preliminary analysis.Journal of Experimental Biology 138:271–288.
Bots J, Breuker CJ, Kaunisto KM, Koskim¨aki J, Gossum HV, Suhonen J. 2012.Wing shape and
its influence on the outcome of territorial contests in the damselflyCalopteryx virgo.Journal of Insect Science12:96DOI 10.1673/031.012.9601.
Davis AK, Chi J, Bradley C, Altizer S. 2012.The redder the better: wing color predicts flight
performance in monarch butterflies.PLoS ONE7:e41323DOI 10.1371/journal.pone.0041323.
Dijkstra K-DB, Lewington R. 2006. Field guide to the dragonflies of Britain and Europe.
Gillingham: British Wildlife Publishing.
Dudley R. 1990.Biomechanics of insect flight in neotropical butterflies: morphometrics and
kinematics.Journal of Experimental Biology150:37–53.
Dudley R. 2002.The biomechanics of insect flight. Princeton: Princeton University Press.
Ellington CP. 1984.The aerodynamics of hovering insect flight: II. Morphological parameter.
Philosophical Transactions of the Royal Society: Series B (Biological Sciences) 305:17–40 DOI 10.1098/rstb.1984.0050.
Ennos AR. 1989.The effect of size on the optimal shapes of gliding insects and seeds.Journal of
Zoology219:61–69DOI 10.1111/j.1469-7998.1989.tb02565.x.
Hammer Ø, Harper DAT, Ryan PD. 2001.PAST: paleontological statistics software package for
education and data analysis.Paleontologica Electronica4:9.
Hassall C. 2013.Time stress and temperature explain continental variation in damselfly body size.
Ecography36:894–903DOI 10.1111/j.1600-0587.2013.00018.x.
Hassall C. 2014.Continental variation in wing pigmentation in Calopteryx damselflies is related
to the presence of heterospecifics.PeerJ2:e438DOI 10.7717/peerj.438.
Hassall C, Thompson DJ. 2008.The impacts of environmental warming on Odonata: a review.
International Journal of Odonatology11:131–153DOI 10.1080/13887890.2008.9748319.
Hassall C, Thompson DJ. 2010.Accounting for recorder effort in the detection of range shifts
from historical data.Methods in Ecology and Evolution1:343–350
DOI 10.1111/j.2041-210X.2010.00039.x.
Hassall C, Thompson DJ, French GC, Harvey IF. 2007.Historical changes in the phenology of
British Odonata are related to climate.Global Change Biology13:933–941
Hassall C, Thompson DJ, Harvey IF. 2008.Wings ofCoenagrion puellavary in shape at the northern range margin (Odonata: Coenagrionidae).International Journal of Odonatology 11:35–41DOI 10.1080/13887890.2008.9748310.
Hassall C, Thompson DJ, Harvey IF. 2009.Variation in morphology between core and marginal
populations of three British damselflies.Aquatic Insects31:187–197
DOI 10.1080/01650420902776708.
Haylock MR, Hofstra N, Klein Tank AMG, Klok EJ, Jones PD, New M. 2008.A European daily
high-resolution gridded dataset of surface temperature and precipitation.Journal of Geophysical Research Series D, Atmospheres113:D20119DOI 10.1029/2008JD010201.
Hickling R, Roy DB, Hill JK, Fox R, Thomas CD. 2006.The distributions of a wide range of
taxonomic groups are expanding polewards.Global Change Biology12:1–6
DOI 10.1111/j.1365-2486.2006.01116.x.
Hill JK, Thomas CD, Blakeley DS. 1999.Evolution of flight morphology in a butterfly that has
recently expanded its geographic range.Oecologia121:165–170DOI 10.1007/s004420050918.
Hughes CL, Dytham C, Hill JK. 2007.Modelling and analysing evolution of dispersal in
populations at expanding range boundaries.Ecological Entomology32:437–445
DOI 10.1111/j.1365-2311.2007.00890.x.
Jenkins DG, Brescacin CR, Duxbury CV, Elliott JA, Evans JA, Grablow KR, Hillegass M, Lyon BN, Metzger GA, Olandese ML, Pepe D, Silvers GA, Suresch HN, Thompson TN,
Trexler CM, Williams GE, Williams NC, Williams SE. 2007.Does size matter for dispersal
distance?Global Ecology and Biogeography16:415–425DOI 10.1111/j.1466-8238.2007.00312.x.
Johansson F. 2003.Latitudinal shifts in body size ofEnallagma cyathigerum(Odonata).Journal of
Biogeography30:29–34DOI 10.1046/j.1365-2699.2003.00796.x.
Johansson F, S¨oderquist M, Bokma F. 2009.Insect wing shape evolution: independent effects of
migratory and mate guarding flight on dragonfly wings.Biological Journal of the Linnean Society 97:362–372DOI 10.1111/j.1095-8312.2009.01211.x.
Lehmann FO. 1999.Ambient temperature affects free-flight performance in the fruit flyDrosophila
melanogaster.Journal of Comparative Physiology B169:165–171DOI 10.1007/s003600050207.
Marden JH. 1987.Maximum lift production during take-offin flying animals.Journal of
Experimental Biology130:235–258.
Marden JH. 1989.Bodybuilding dragonflies: costs and benefits of maximizing flight muscle.
Physiological Zoology62:505–521.
Marden JH. 1995.Large-scale changes in thermal sensitivity of flight performance during adult
maturation in a dragonfly.Journal of Experimental Biology198:2095–2102.
Marden JH, Rollins RA. 1994.Assessment of energy reserves by damselflies engaged in aerial
contests for mating territories.Animal Behaviour48:1023–1030DOI 10.1006/anbe.1994.1335.
Marden JH, Waage JK. 1990.Escalated damselfly contests are energetic wars of attrition.Animal
Behaviour39:954–959DOI 10.1016/S0003-3472(05)80960-1.
McLachlan AJ. 1986.Sexual dimorphism in midges: strategies for flight in the rain-pool
dwellerChironomus imicola(Diptera: Chironomidae).Journal of Animal Ecology55:261–267
DOI 10.2307/4706.
Merckx T, Van Dyck H. 2006.Landscape structure and phenotypic plasticity in flight morphology
in the butterflyPararge aegeria.Oikos113:226–232DOI 10.1111/j.2006.0030-1299.14501.x.
M¨onkk¨onen M. 1995.Do migrant birds have more pointed wings? A comparative study.
Evolutionary Ecology9:520–528DOI 10.1007/BF01237833.
Norberg UM. 1989.Vertebrate flight, mechanics, physiology, morphology, ecology and evolution. Berlin: Springer-Verlag.
Outomuro D, Bokma F, Johansson F. 2012.Hind wing shape evolves faster than front wing shape
inCalopteryxdamselflies.Evolutionary Biology39:116–125DOI 10.1007/s11692-011-9145-4.
Plaistow S, Siva-Jothy MT. 1996.Energetic constraints and male mate-securing tactics in the
damselflyCalopteryx splendens xanthostoma(Charpentier).Proceedings of the Royal Society: Series B (Biological Sciences)263:1233–1238DOI 10.1098/rspb.1996.0181.
Rasband WS. 1997–2007.ImageJ.Available athttp://rsb.info.nih.gov/ij/.
Rohlf FJ. 2008.tpsDig, digitize landmarks and outlines. version 2.12. New York: State University of
New York at Stony Brook, Department of Ecology and Evolution.
R¨uppell G. 1989.Kinematic analysis of symmetrical flight manoeuvres of Odonata.Journal of
Experimental Biology144:13–42.
Sadeghi S, Adriaens D, Dumont HJ. 2009.Geometric morphometric analysis of wing shape
variation in ten European populations ofCalopteryx splendens(Harris, 1782) (Zygoptera: Odonata).Odonatologica38:343–360.
Siva-Jothy MT. 1999.Male wing pigmentation may affect reproductive success via female choice
in a calopterygid damselfly (Zygoptera).Behaviour136:1365–1377
DOI 10.1163/156853999500776.
Stalker HD. 1980.Chromosome studies in wild populations ofDrosophila melanogaster. II.
Relationship of inversion frequenceis to latitude, season, wing-loading and flight activity. Genetics95:211–223.
Taylor PD, Merriam G. 1995.Wing morphology of a forest damselfly is related to landscape
structure.Oikos73:43–48DOI 10.2307/3545723.
Thomas CD, Hill JK, Lewis OT. 1998.Evolutionary consequences of habitat fragmentation in a
lo-calized butterfly.Journal of Animal Ecology67:485–497DOI 10.1046/j.1365-2656.1998.00213.x.
Travis JMJ, Dytham C. 1999.Habitat persistence, habitat availability and the evolution of
dispersal.Proceedings of the Royal Society: Series B (Biological Sciences)266:723–728
DOI 10.1098/rspb.1999.0696.
Vandewoestijne S, Van Dyck H. 2011.Flight morphology along a latitudinal gradient in a
butterfly: do geographic clines differ between agricultural and woodland landscapes?Ecography 34:876–886DOI 10.1111/j.1600-0587.2010.06458.x.
Vargas A, Mittal R, Dong H. 2008.A computational study of the aerodynamic performance of a
dragonfly wing section in gliding flight.Bioinspiration & Biomimetics3:1–13
DOI 10.1088/1748-3182/3/2/026004.
Vogel S. 1957.Flight inDrosophila: III. Aerodynamic characteristics of fly wing and wing models.
Journal of Experimental Biology46:431–443.
Waage JK. 1973.Reproductive behavior and its relation to territoriality inCalopteryx maculata
(Beauvois) (Odonata: Calopterygidae).Behaviour47:240–256DOI 10.1163/156853973X00094.
Wakeling JM, Ellington CP. 1997a.Dragonfly flight. II. Velocities, accelerations and kinematics of
flapping flight.Journal of Experimental Biology200:557–582.
Wakeling JM, Ellington CP. 1997b.Dragonfly flight. III. Lift and power requirements.Journal of
Experimental Biology200:583–600.
Wakeling JM, Ellington CP. 1997c.Dragonfly flight: I Gliding flight and steady-state aerodynamic
Wickman PO. 1992.Sexual selection and butterfly design—a comparative study.Evolution 46:1525–1536DOI 10.2307/2409955.
Wootton RJ. 1992.Functional morphology of insect wings.Annual Review of Entomology
37:113–140DOI 10.1146/annurev.en.37.010192.000553.