Março de 2015
Working
Paper
377
Intergovernmental
transfers
and
public
spending
in
Brazilian
municipalities
TEXTO PARA DISCUSSÃO 377•MARÇO DE 2015• 1
Os artigos dos Textos para Discussão da Escola de Economia de São Paulo da Fundação Getulio
Vargas são de inteira responsabilidade dos autores e não refletem necessariamente a opinião da
FGV-EESP. É permitida a reprodução total ou parcial dos artigos, desde que creditada a fonte. Escola de Economia de São Paulo da Fundação Getulio Vargas FGV-EESP
Intergovernmental transfers and public spending in Brazilian municipalities
Paulo Arvate* Enlinson Mattos** Fabiana Rocha***
Abstract
We estimate the effects of unconditional (full fiscal decentralization) versus conditional (partial fiscal decentralization) block grants on local public spending in Brazilian municipalities. Our results suggest that the effect of unconditional and conditional transfers do not differ statistically. Their combination promotes a full crowding-in effect on aggregate public spending — i.e., for $1 of unconditional and conditional grant receipts; we find $1 of additional local public expenditures, greater than the corresponding effect of local income, providing further evidence for the flypaper effect. Moreover, the effect of unconditional transfers on education (health) spending is smaller than the effect of conditional education (health) transfers but greater than the corresponding effect of local income. We consider four strategies to identify causal effects of federal grants and the local income on fiscal responses regarding Brazilian local governments: (i) a fuzzy regression discontinuity design, (ii) Redistributive rules of education funds, (iii) Oil and Gas production, and (iv) Rainfall deviations from the historical mean.
Keywords: Unconditional and Conditional Grants, Local Government, Crowding-out Effect, Crowding-in Effect (Flypaper Effect)
We are grateful to Luis Araujo, Marcelo Arbex, Klenio Barbosa, Felipe Garcia, Cristine Pinto, Michihito Ando, Emilson Silva, Fernando Postali, Vladimir Ponczeck, and Breno Sampaio for helpful comments and discussions. We also thank seminar participants at the 34th Meeting of the Brazilian Econometric Society, 2013, 15th Public Economic Theory Conference (PET14, Seattle, USA), 70th Annual Congress of the International Institute of Public Finance. All remaining errors are our own. We would like to thank Bruno Barsanetti, Fernando Parmagnani, Isabela Furtado, Priscila Bacalhau, Marco Brancher, and João Leite by work from research assistant.
*São Paulo School of Business Administration and Center for Microeconomics Applied – C-Micro - FGV Email: paulo.arvate@fgv.br; **Sao Paulo
1. Introduction
The recent literature on the role of intergovernmental grants in local public finance emphasizes the
importance of robust empirical strategies to determine the causal relationship between one specific
type of transfer and local public expenditures and taxes (Dahlberg et al., 2008, Litschig and
Morrison, 2013, Lundqvist, 2013, Lundqvist et al, 2013). Unfortunately, the results concerning the
crowding-out effect and the crowding-in effect (i.e., the flypaper effect) are mixed, depending on
the nature and the context of those transfers. The results suggest that larger grants can be used as
intended to stimulate the public sector or as unintended to finance private consumption through tax
cuts.
Our main contribution is to estimate causal effects of both conditional and unconditional
exogenous grants on total local public spending, local taxes and on specific types of expenditures
and explores whether those targeted grants stick to the specific sector as initially expected in
Brazilian municipalities.1 The simultaneous presence of unconditional and conditional nonmatching
grants in Brazilian municipalities allows us to answer three important questions regarding public
finance.
First, we test whether unconditional grants lead to more public spending than a reduction in
tax rates (full crowding-in hypothesis) or an increase in local income. Second, we investigate
whether unconditional grants (full fiscal decentralization) stimulate more fiscal responses than
conditional grants (partial fiscal decentralization). As we evaluate specific public spending on
health and education, we also examine whether the conditionalities imposed on transfers play a role
in the observed effect on public spending (fungibility hypothesis). Third, because some
municipalities also receive oil windfalls that are unconditional grants, we additionally explore
whether and to what extent the effects of natural resource transfers and traditional unconditional
transfers differ. Therefore, as our main contribution, we estimate the causal effects of different
types of transfers from the federal government to local government.
Three aspects call attention to the relationship between different levels of government in
Brazil and render it distinct from other federations. The first aspect concerns the composition of
municipalities’ revenues. Municipalities’ own tax revenue represents only 21% of their total revenue, whereas more than 60% of transfers come from the federal government.2 The second
1 Dahlberg et al. (2008) argues that research on specific grants programs (i.e., studies by Knight, 2002 and Gordon, 2004) can be sensitive to the institution design.
aspect concerns the composition of municipalities’ grants. General-purpose (unconditional) and specific-purpose (conditional) grants are equally important for Brazilian local governments, as the
former represents nearly 60% of the transfers received by the municipalities while the latter, the
other 40%. Third, according to the current Brazilian Constitution, municipal governments have
great autonomy to define and allocate their budgets. As both the executive and the legislative
branches are elected every four years by a compulsory vote, Brazil provides an appropriated
environment to test the effects of fiscal decentralization.3
Grants of a different nature might have different effects on recipients’ fiscal behavior. According to Boadway and Shah (2007), general-purpose grants may have a small expansionary
effect on local spending because they do not affect the relative prices of local public goods (i.e., no
substitution effect occurs). Rather, corresponding to general budget support, such grants increase
local budgets only. Local expenditures would increase to a lesser extent than the grant funds
because they are partly used to provide tax relief to residents. Substantial evidence suggests that the
allocation of funds to local spending from general-purpose grants is larger than that from an equal
increase in private income, implying that money may not be fungible. This phenomenon is known
as the flypaper effect.
A vast literature focuses on the effects of intergovernmental grants on local spending
behavior. According to Gamkhar and Shah (2007), evidence of the effect of general-purpose grants
is mixed. There is evidence of full displacement, as indicated by a non-significant coefficient for
the grant variable in the expenditure equation. However, there is also evidence of the crowding-in
effect (i.e., flypaper effect), and several explanations for its existence are provided (Oates, 1979;
Courant, Gramlich, and Rubinfeld, 1979; Filimon, Romer, and Rosenthal, 1982; Craig and Inman,
1982, 1986; Hamilton, 1986; Cai and Treisman, 2004; Kornai; 1979; Dahlby, 2011).4 Recently, the
focus has turned to identification strategies for open-ended intergovernmental transfers (Dahlberg et
al, 2008; Lundqvist, 2013; Lutz, 2010; Litschig and Morrison, 2013), and both full and partial
crowding-in effects have been reported, corroborating the context-dependent nature of the results.
3 Local governments from India and UK also receive transfers, but governments in these countries have almost no autonomy to establish their budgets (expenditures and revenue). In Australia, transfers to municipalities are mostly for a specific purpose, primarily for social housing and transportation. South Africa used to have a mix of unconditional and conditional transfers, but in 1998, a policy shift led to a formula-based system of primarily unconditional grants (Bahl, 2001).
4 For Brazilian data, see Mattos, Rocha, and Arvate (2011). Another strand of the literature casts doubt on the existence
of the flypaper effect and suggests that empirical studies may be overestimating this effect. Most explanations focus on
Close-ended nonmatching grants can provide resources to local governments as long as they
are spent on a particular purpose, and they do not require the municipality to finance a certain
percentage of expenditures by using its own resources. 5 The addition of this conditionality may not
affect local spending behavior, however. The condition imposed on the grant does not matter if the
municipality is already spending more than the grant amount and if the predicted expansionary
effect of such a grant is smaller than the resources received. In fact, conditional grants differ from
unconditional grants only if the municipality receiving the money is spending less than the grant
amount without the imposition of the condition. Otherwise, the grant is, in fact, unconditional, and
it would have the same effect as if the municipality had received the money to spend freely.
Many papers have estimated the response of local public expenditures to close-ended grants
(Megdal, 1987; Mofitt, 1994; Wickoff, 1991) or have focused on the fungibility aspects of
close-ended intergovernmental transfers (McGuire, 1975; 1978, and Zampelli, 1986; and Van de Walle
and Mu, 2007). Recently, in line with the recent literature that uses convincing identification
strategies, Knight (2002) finds evidence of a full crowding-out effect, whereas Gordon (2004) finds
a strong crowding-in effect for the first year of transfers.6 Ando (2015) exploits two different
exogenous variations in the formula of grants, and use a regression kink design and an instrumental
variable approach, to evaluate the effects of fiscal equalization grants on local expenditures. His
main concern, however, is to show that those effects depend on the institutional or formula settings
of intergovernmental grants. He concludes that in fact there are heterogeneous grant impacts on rich
and poor municipalities in Japan.
To the best of our knowledge, this paper represents the first attempt to estimate the
differential effects of unconditional transfers, conditional transfers, and natural resource transfers
on local public expenditures while addressing the endogeneity of those grants. Moreover, we
compare the effects of conditional and unconditional grants with the effects of local income
changes while still confronting identification problems.
We use four identification strategies. First, to identify the effects of unconditional transfers
on local public expenditures and tax relief, we exploit the fact that the rule of distribution of federal
resources to local governments is discontinuous with respect to population thresholds and use a
fuzzy regression discontinuity design (RDD) procedure, as in Brollo, Nannicini, Perotti, and
5 Conditional transfers may or may not require a matching provision. Conditional matching grants require that grant recipients use their own resources to finance part of expenditures. Because such grants reduce the relative price of public goods, the municipality consumes more of public goods from a given budget (substitution effect). An income effect also arises, given that the municipality ends up with a surplus of resources that can be devoted to increased consumption of public goods. Both effects stimulate higher spending on public goods. Matching grants, however, are not important in Brazil.
Tabellini (2013).7 Second, we follow the approach in Paxson (1992) to build historical deviations
from the historical mean of rainfall data as instruments for variations in local GDP (also restrict to
agricultural-based municipalities). Third, we create an instrument for conditional transfers to
education (Fundo de Desenvolvimento do Ensino Basico – FUNDEB). For this purpose, we follow Kosec (2014) and use as an instrument the predicted transfers for education, which are calculated
by using the 1997 rule of redistribution, according to which local governments could not influence
the criteria for redistribution. Fourth, following Caselli and Michaels (2009), we build an
instrument for the royalties of oil production, for which we estimate virtual royalties based on each
field’s oil production and the specific rules of distribution.
Our results suggest that the effect on local public expenditures does not statistically differ
between unconditional and conditional grants. More important, our estimations suggest that
unconditional and conditional transfers have a full crowding-in effect on aggregate public spending
(each $1 of unconditional and conditional grant receipts increases expenditures on local
governments by $1). Additionally, we find evidence that the effect of unconditional transfers on
local public spending is greater than the corresponding effect of local income variation, providing
further evidence for the flypaper effect. The effects of unconditional transfers on education
spending are smaller than the effects of FUNDEB (conditional education transfer) but still greater
than the corresponding effect of local income changes. Similar results are found for the relationship
between conditional health transfers (PAB-SUS) and local public health expenditures.
The paper is organized into six sections beyond this introduction. The second section
presents the fiscal transfer system in Brazil, showing the main grants from federal to local
governments. The third section briefly describes the data, and the fourth section presents our
empirical strategy, including the development of instrumental variables (IVs) for each transfer. The
fifth section discusses our main results, as well as additional evidence when GDP is treated as
endogenous and when an alternative identification strategy—a RDD, where treated and untreated municipalities are distinguished by a break in the rule of distribution of unconditional grants—is used. The sixth section evaluates the effects of transfers on specific spending, education, and health.
The seventh section summarizes the main conclusions.
2. Fiscal Transfers in Brazil
Brazilian federalism relies heavily on transfers, which represent an important source of revenues for
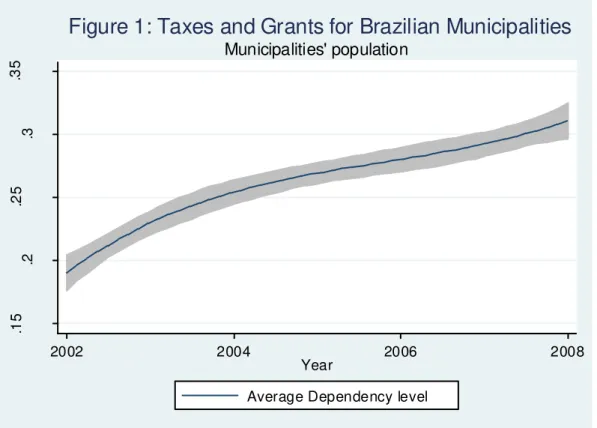
municipalities. Figure 1 below shows the ratio between local taxes and the total grants received for
2002-2008. Note that taxes represented 20% of the grants received in 2002, and although the share
increased, taxes represented only 30% of transfers in 2008.
Insert Figure 1 here
Municipalities’ dependency on transfers is heterogeneous and is related to population size. Smaller municipalities have a larger dependency, i.e., a tax–grant ratio close to 0.2, which is larger
to the ratio for larger municipalities.8 We also note that education spending corresponds to 25% of
all public expenditures, whereas health spending represents only 16%.
The most important transfer to Brazilian Municipalities is called Municipalities’
Participation Fund (Fundo de Participação dos Municípios - FPM). It can be classified as a
mandatory, unconditional, nonmatching, revenue-sharing grant, and it corresponds to 23.5% of the
income taxes and industrialized products taxes that are collected by the federal government. It is a
redistributive transfer because it aims to reduce regional inequalities.
Municipalities that are state capitals receive 10% of FPM transfers (FPM-Capitais), and the
other municipalities receive 86.4% of the resources (FPM-Interior). The remaining 3.6% of the
resources (FPM-Reserva) are distributed to municipalities with at least 142,633 inhabitants.
The 10% of funds transferred to capitals is distributed according to coefficients based on the
ratio between the population of the capital, the sum of the population of all capitals, and the inverse
of the per capita income of the state where the municipality is located.
The 86.4% of funds transferred to the other municipalities is distributed according to
coefficients based on the size of the population of each municipality (Table 1). The complementary
3.6% is distributed by using the criteria of the FPM-Capitals.
Insert Table 1 here
Because the amount that must be allocated to each municipality is clearly established, FPM
transfers are transparent and free of political pressure. Furthermore, local governments have
autonomy on how to spend those transfers.9 On one hand, such autonomy is desirable because the
municipality, by better understanding the preferences of the population, can allocate the transferred
resources according to local needs and preferences. On the other hand, this autonomy allows for a
loss of returns to scale in spending and for less effort in tax effort. The official number of
inhabitants in any particular municipality is measured every ten years by the Brazilian Census, and
an independent federal agency called the Instituto Brasileiro de Geografia e Estatistica (IBGE)
8
Transfers from states to the municipalities are called transfers of ICMS (Imposto sobre Circulação de Mercadorias e Serviços), which is the value added tax of state competence. From all the ICMS revenue collected by each state, 25% must be transferred to the municipalities, of which three-fourths is allocated to the municipality where the revenue originated and one-fourth is allocated among all municipalities in accordance with the legislation of each state. As part of the transferred resources consist of shared revenues, largely reflecting the capacity of municipalities to generate their own resources, disparities among municipalities are amplified instead of corrected. ICMS transfers are also mandatory, unconditional and nonmatching; however, they are not be evaluated because they are not as equalizing as FPM.
provides annual estimates of local populations between census years. The central government then
uses these estimates to distribute FPM funds to municipalities. We explore the yearly fluctuation in
local populations across thresholds to quantify the causal effects of government spending on
economic activity.
Although natural resources belong to the Union, some revenue is transferred to the states
and municipalities as financial compensation for the exploitation of those resources in their
territories (or neighboring territories). In fact, municipalities are the primary beneficiaries of royalty
payments, having received 34% of oil windfall revenues in 2008. Further, the number of producing
municipalities increased from 103 in 1997 to 123 in 2008. Similar to FPM transfers, these royalty
transfers are unconditional and nonmatching.
In 1997, a new law implemented important changes to the system of royalty payments.
Specifically, the payments increased from 5% to 10% of the production value, the oil value was
indexed to the international prices, and extra payments were assigned to highly productive oil fields
(these extra paymentsare called “participações especiais”).
Oil production has increased dramatically since the enactment of Law no. 9478/1997,
reaching 600 million barrels in 2008, more than double that produced in 1997. This increase was
largely driven by offshore production, which increased from less than 200 million barrels annually
in 1994 to 663 million barrels annually in 2008. By contrast, onshore production remained
practically stagnant during this period at 65 million barrels annually (Monteiro and Ferraz, 2010).
Table 2 summarizes the main beneficiaries of royalty revenues, according to the location of
the oil reserve (land or sea) and the royalty rate.
Insert Table 2 here
The greatest amount of resources is transferred to producing or neighboring municipalities
when production is offshore. Given the distribution shown in Table 2, the royalty revenue of each
state or municipality is proportional to the oil production in the wells on their territory. When
production occurs on the continental shore, IBGE calculates the number of wells under the
neighbor municipality jurisdiction by using the projection of the municipality’s geographic coordinates on the sea. 10 According to Monteiro and Ferraz (2009), 90% of the oil produced in
Brazil comes from offshore wells.
Caselli and Michaels (2009) argue that oil production can be treated as exogenous to local
characteristics. Because municipalities are very small, they are not politically able to lobby and/or
bribe PETROBRAS (or the multinational extracting companies) to drill near them or to increase the
amount of oil extracted. To support this argument, the authors run a regression predicting oil output
where the variable distance from the federal capital appeared to be statistically non-significant.
Thus, oil output does not seem to be affected by political influence. 11 We start our analysis by
taking royalties as exogenous. However, because geographic location is not the only (but is the
main) determinant of oil windfall distribution and because the size of the population and the
location of production plants, pipelines, and transportation facilities also affect the amount paid to
each locality, we present the results by using an instrument for royalties similar to the one used by
Caselli and Michaels (2009), and we consider a subsample of fifty-five (55) municipalities.
Conditional transfers are primarily used to subsidize education and health. Spending in these
areas is considered a priority by the central government, which aims to ensure that the resources are
not diverted to other activities.
In 1998, a conditional transfer to education was established. The federal government
introduced a new mechanism for financing public education called FUNDEF, which ran from
1999 to 2006 and aimed to equalize the available resources in education across municipalities.
This mechanism comprised 15% of the States’ Participation Fund (FPE), the FPM, sales tax on goods and services (ICMS, including appeals related to the exemption of exports mentioned in
Supplementary Law 87/1996), and excise tax on industrialized products related to exports
(IPIexp). Its purpose was to finance only primary education. In 2007, FUNDEB replaced
FUNDEF with the aim to finance all levels of education, from pre-school to high school. Table 3
summarizes the rules of resource distribution to education.
Insert Table 3 here
From the total amount collected, each municipality receives resources according to the
number of students enrolled in its public schools. From 1998 to 1999, the total number of children
enrolled in municipal primary schools in each municipality in the state, the total number of
children enrolled in state primary schools in the state, and the annually set federal minimum
expenditure per primary school student determined the exact amount that each municipality
received from the fund.
11Petrobrás is an enterprise controlled by the federal government. Caselli and Michaels (2009) also note that “unlike
many Brazilian institutions, Petrobrás actually has a strong record and reputation for integrity – at least in recent years. This record has been explicitly recognized by international NGOs operating in the natural resources area, e.g.,
Transparency International (2008)”. They also provide evidence that oil production affects the economy only through
From 2000 to 2004, the algorithm defined the federal top-off amount based on the students’ enrollment level so that children in grades 1-4 of primary school were weighted differently from
children in grades 5-8. From 2005 to 2006, the algorithm began to define the federal top-off based
on not only primary school level but also urbanization status. Thus, information on the number of
children were enrolled in grades 1-4 in urban primary schools, grades 1-4 in rural primary schools,
grades 5-8 in urban primary schools, and grades 5-8 in rural primary schools was required. After
2007, FUNDEB required that the number of students enrolled in urban vs. rural preschools,
secondary schools, and adult education be taken into account.
FUNDEB obviously limits municipalities’ autonomy because the resources are necessarily linked to education, as they are conditional transfers. Moreover, the Brazilian Constitution (article
212) establishes that each municipality should spend at least 25% of their total revenue (including
taxes and transfers). Some municipalities impose a larger limit, however. For instance, the
councilor of the city of São Paulo (the capital of the richest state in the country) defines a 30%
limit.
Our benchmark health transfer—Piso de Atenção Básica (PAB)—is a financing mechanism
for the Brazilian Health System (Sistema Único de Saúde – SUS) that focuses on comprehensive
health care. It was created in 1996, implemented in the first half of 1998, and expanded in 2001.12
The aim of this mechanism is to equalize local resources to guarantee a national minimum standard
in health services. The amount is transferred monthly to each municipality according to a formula that linearly links the amount of resources (fixed PAB) to the number of inhabitants of the municipality in that year according to IBGE. Resources must be devoted only to current and capital expenses that are related to basic health and that are in accordance with the guidelines of the Municipal Health Plan. Regarding health, the Brazilian Constitution also establishes that a minimum of 15% of the total revenue is spent on health (articles 156, 158, and 159). Table 4 presents data on ordinances and the per capita amount transferred to each municipality during the period under analysis.13
Insert Table 4 here
12 PAB consists of a fixed part, which intends to fund primary care, understood as a set of actions that must be provided at the first level of attendance of the health system and that aim at prevention, treatment, and cure. Primary case therefore involves medical consultation in, e.g., basic specialties, vaccinations, emergency care, and minor surgeries. The PAB also consists of a variable part that is intended to develop specific actions for primary care.
3. Data
Municipal public accounting started to produce centralized information regarding fiscal variables in 1989.14 However, there were different levels of data disaggregation, and only after 2001 were the variables that we use in our investigation published consistently. This is primarily because 1073 municipalities were created from 1993 to 2001.15 Our sample ends in 2008 because this period allows us to capture two terms of municipal government and to consider the largest number of control variables. Our observation units are the 5564 Brazilian municipalities, and we use different
databases to build our variables of interest for the period between 2002 and 2008.
Fiscal data are from the National Treasury’s site (Finanças do Brasil - FINBRA – Dados Contabeis dos Municipios). They include variables related to local public expenditures (general
expenditures, education expenditures, and health expenditures), revenue from municipal taxes
(property and service taxes), transfers received by the municipalities from the central government
(FPM, PAB, FUNDEF/FUNDEB, and royalties), all other transfers received from state and federal
(only residual) governments (other transfers received), visibility (property tax as a share of service
tax), and fiscal complexity (property tax as a share of revenue taxes). All the variables are deflated
by the general index price (IGP-DI, base = 2000) and considered in per capita terms.
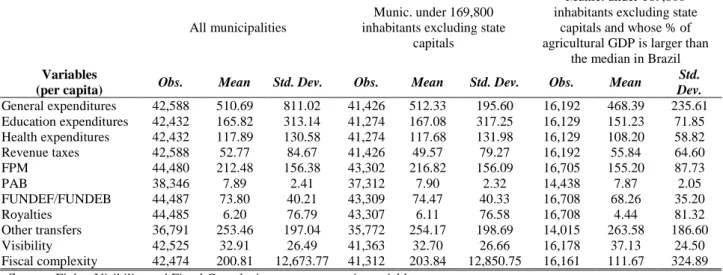
Table 5 shows the descriptive statistics for the fiscal variables of all our variables for the
entire sample, for municipalities with a population under 169,800 inhabitants, and for
municipalities whose percentage of agricultural GDP is larger than the Brazilian median.
Insert Table 5
The population data come from IBGE. We consider the population divided by 100,000
(population in 100,000 inhabitants), births minus mortality/population, the percentage of the
population under 1 year old and between 70 and 79 years old, the percentage of women in the
population, the percentage of individuals who completed elementary school, and the percentage of
individuals who completed higher education.
Table 6 summarizes the demographic, political, and education variables. The public service
data are from Ipeadata’s site (Ministry of Planning).16 They correspond to the percentage of families included in the Family Health Program, the percentage of housing with potable water, the
14See https://www.tesouro.fazenda.gov.br/pt/politica-fiscal/planejamento-fiscal/resultado-tesouro-nacional/809. 15
percentage of housing with water service, the percentage of housing with garbage service, the
percentage of housing with sewage service, and the percentage of housing with lighting service.
The political data are extracted from Ipeadata’s site (Ministry of Planning). We consider the percentage of councilors elected in the same party as the mayor, the percentage of individuals with
an elementary school education, and the percentage of individuals with higher education. Although
the general results are presented on an annual basis, the dummies and percentage of councilors are
the same for four years (from 2002 to 2004 and from 2005 to 2008) for municipalities.
Insert Table 6 here
Finally, Table 7 presents the descriptive statistics for our two measures of local income and
their instrument—rainfall. First, as a measure of local income, we consider the sum of all formal wages within each municipality to determine the total for formal wages. The data come from
Relação Anual de Informações Sociais (RAIS). As an additional measure of local income, we also
consider the municipalities’ GDP obtained from Ipea (Ipeadata - Ministry of Planning), which calculates an estimate of the local GDP between census years (2000 and 2010).
Insert Table 7 here
Our instrument for local income corresponds to the variation in rainfall with respect to the
historical mean (1900-2000). We follow Paxson (1992) and construct the difference between the
actual rainfall for each season (summer, autumn, winter, and spring) every year and its historical
mean (last century, 1900-2000) and standard deviation. We also compute the corresponding figure
for each term of municipal government (2001-2004 and 2005-2008).
We obtain historical data on precipitation from the Terrestrial Air Temperature and
Precipitation: 1900-2008 Gridded Monthly Time Series, Version 1.02 (Matsuura and Willmot,
2009). This dataset provides worldwide monthly mean precipitation data at 0:5x0:5 degree
resolution. The number of nearby weather stations that influences a grid-node estimate is 20 on
average.
To build the regional rainfall variable, we follow two steps. First, each municipality is
located within a square defined by the four closest nodes to its centroid's latitude and longitude. We
denote this square a grid. Second, the monthly mean precipitation for each municipality is
calculated as the weighted average of the respective weather information recorded at each of the
four nodes of the respective grid.17
4. Empirical Strategy
To estimate the effect of unconditional and conditional grants on total, education, and health public
expenditures for municipalities, we use the following equation:
t i t t i t
i t
i c t i u t i i t
i Y UT CT Royalties Controls
G, 0 , , , 3 , 4 , , (1)
where Gi,t denotes the per capita total public expenditures, the per capita health public expenditures,
or the per capita education public expenditures for municipality i in period t; Y represents local
income; UT denotes the vector for unconditional transfers for municipality i at time t (FPM and
royalties); and CT denotes the vector for conditional transfers for municipality i at time t (FUNDEB
for education and PAB-SUS for health). Controls represent a vector aiming to capture all other
variables that may affect public expenditures. Finally, variable αi represents the fixed effect for
each municipality, t denotes time dummy variables that capture common effects for all municipalities over time, and ξi,t is the error term.18 Under the assumption of strict exogeneity below, one can identify all β effects:
(2)
(2)
However, one might expect that the amount of expected transfers to be received in the future
could be determined by previous decisions related to local public expenditures, in which case the
strict exogeneity assumption would be violated (Becker, 1996). In other words, although grants do
often vary considerably, most of the variation is endogenous in the sense that the variation is due to
structures that are themselves directly related to expenditures: Municipalities with characteristics
associated with high expenditures (e.g., those with a large share of children) typically receive more
grants precisely because they need to spend more, reflecting needs only. An easy solution for this
endogeneity problem involves controlling for all characteristics that determine expenditures in a
regression analysis. In addition, one can closely investigate how grants are determined and can
search for experimental-type features where the amount of grants varies but the underlying needs
do not. We use such a strategy in this paper. A similar argument can be applied to the endogeneity
of local income. In this case, we rely on Paxson’s approach (1992) and use unexpected rainfall as an instrument for exogenous variations in income.
More specifically, we want to test the magnitude of the coefficient u. To rigorously identify
the role of unconditional transfers, one must compare u with the coefficient for conditional
transfers ( c), income ( 0), and royalties ( 3) by using convincing identification strategies. If
general-purpose nonmatching grants have the smallest stimulatory effect on local spending, one
might expect u < c. The literature on the flypaper effect also compares the coefficient for income
(
0) with the corresponding coefficient for the block grant. The context of our study differs,however, because Brazilian municipalities receive both unconditional (block) transfers (FPM and
royalties) and conditional (block) transfers. Therefore, in our case, to verify the existence of the
flypaper effect, one has to compare the magnitudes of u and c with the magnitude of
0. Wepresent the effect of each type of transfer separately to compare their effects on public spending.
When the dependent variable is per capita spending on health or education, an additional
aspect is the potential effect of the fungibility of grants; i.e., local governments might decide to
spend the transfers in a category different from the federal government’s initial intentions. In other words, conditional transfers might increase by less than the amount of the grant because local
governments can apply the funds to different types of local public expenditures. For instance, the
remainder of the grant in fact might increase the consumption of other goods and services. A
specific test for this hypothesis is whether c = 1.
We describe below our strategies to identify the effects of unconditional transfers,
conditional transfers, and local income to isolate these effects from those due to possible (omitted)
nonobserved variables (Hamilton, 1983 and Wyckoff, 1991), reverse causality, or simultaneity
(Knight, 2002).
4.1 Endogenous Income
One of the main assumptions in the traditional empirical estimates of the flypaper effect is that
GDP is exogenous (see, for example, Inman (1971); Weicher (1972); Gramlich and Galper (1973);
Feldstein (1975); Hamilton (1986); Wyckoff (1991) and Case, Hines and Rosen (1993)). However,
local income might be related to or even caused by local public expenditures. For instance, if a
municipality increases the number of local public employees, “local GDP” should increase.19 However, we allow for endogenous local GDP, and similar to Paxson (1992), we use
weather variability as an instrument for transitory income to estimate the response of public
expenditures to this income variation. Because of the difficulties associated with measuring
permanent income, we focus on the explicit measurement of unexpected income produced by
rainfall shocks.
Unexpected income is measured by using the following equation:
it t it
U t i i
U t
i X Z
Y, 1 , 2 , ,
(3)
where i is the fixed effect for municipality i; Xit is a set of municipality-specific variables that
affect unexpected income; Zit is a set of control (observable) variables at the municipality level; XU
19
consists of deviations of municipality i’s rainfall in each of the four seasons from the average over one hundred years (1900-2000) and deviations from the squared averages; Zit is a set of
municipality-specific variables that could affect the level of unexpected income (we consider the
same controls for all exercises, including health status and other socio-demographic variables; see
Table 8); t is a year effect common to all municipalities; and εit is a random error term.20
We understand that unexpected rainfall results in an exogenous variation of local income
and, consequently, is a good instrument for GDP. In addition, the instrument does not vary across
households within the same municipality, but it can vary across years in the same municipality and
across municipalities. 21
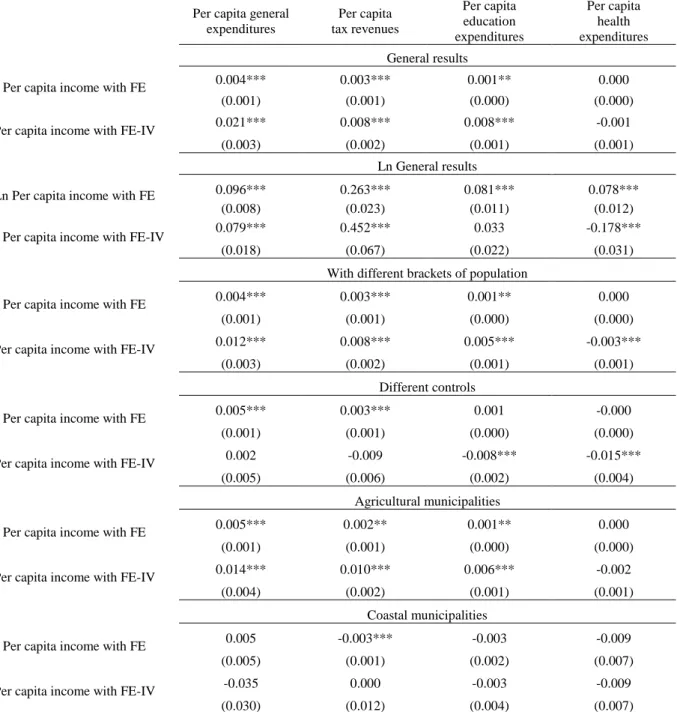
Table 8 below summarizes our results. Column (1) presents the first stage in which all (17)
thresholds are considered together; column (2) considers log variables; column (3) considers the
separate threshold discontinuities into three brackets (1-3, 4-7, and 8-17); and column (4) includes
all possible control variables in the first stage. The last two columns restrict the sample to
agricultural (5) and coastal (6) municipalities.
Insert Table 8 here
The instrument seems robust, with a large F-test for all but one model. Our strategy allows
for an increase of more than five times the FE estimated income effect for the linear model (see
table A.1 column 1)). The results show that even when we control for all possible variables, the
instrument remains significant, with an F-statistic of 13.05. We also restrict the sample to
municipalities with agriculture production as their main economic activity (column 5), and we find
that our instrument continues to perform adequately. Only when we restrict the sample to coastal
municipalities (i.e., municipalities that receive royalties) do we observe that the instrument is no
longer significant; hence, we cannot trust its second-stage estimation.22
4.2. Endogenous Unconditional Transfers: FPM
As discussed previously, differences in FPM transfers for a given municipality over two
consecutive years are primarily due to either a change in the population (to a higher or lower
population threshold) or an increase or decline in the central government’s fiscal revenues used to compute FPM transfers. Moreover, even municipalities with a similar population and per capita
20
We also run all models using quantile (panel) regression. For most of our models we do not find qualitative differences from the conditional mean models.
21 The graphics for the average historical rainfall (1990-2000), the average of each term (2001-2004 and 2005-2008), and the first stage of each estimation when we proxy income by the municipal per capita GDP are presented in the supplementary material.
income might have different coefficients because they belong to different states. However, these
transfers are larger in per capita terms for less populated municipalities, potentially motivating
them to form new municipalities (Ponczek and Mattos, 2013).
We find that the rule of distribution of FPM transfers provides a treatment assignment
mechanism that is typical of a (fuzzy) RDD for obtaining robust estimates. Treatment assignment
(receiving high versus low federal transfers) depends on the running variable, population size.
However, the probability of being treated conditionally on the running variable is known to have
relevant discontinuities at multiple thresholds. The fuzzy design arises from the possibility of
misassignment around the cutoffs, with municipalities near each threshold appearing in both the
treatment group and the control group. Thus, not all municipalities receive the amount of transfers
that they should receive based on their IBGE population estimate and residing state.
Therefore, we investigate the robustness of the flypaper effect by exploring the
discontinuity in the rule of distribution of unconditional grants as an exogenous variation in the
level of transfers received by similar municipalities. This strategy provides us with the opportunity
to propose an additional test of how unconditional (lump-sum) grants are allocated between local
public and private goods (Bradford and Oates 1971). Given that federal grants are passed down to
the local population as either a decrease in taxes and fees (crowding-out effect) or an increase in
public expenditures (crowding-in effect), we can compare our results with the literature aiming to
identify the causal effects of grants on broad economic outcomes, such as total spending (local
public goods) and taxes (private goods) (Dahlberg et al. 2008; Lutz 2008; Lundqvist 2013).23
Although theoretical transfers are a step function of the population (Brollo et al, 2013),
actual transfers do not necessarily follow through. We consider theoretical transfers as the
treatment assignment and actual transfers as the observed treatment. The treatment assignment is
exogenous around the policy thresholds, although the observed treatment may also be influenced by additional factors, such as politicians’ ability to sidestep the exogenous assignment rule or other random elements. As long as actual transfers depend on theoretical transfers, we can use the latter
as an instrument in a (fuzzy) regression discontinuity setup. We can run the following reduced
form, similar to that in Imbens and Lemieux (2008), Garibaldi et al. (2009), and Brollo et al.
(2013):
i s t t i i
i f pop FPM v
FPM ( )1
i s t i i
i f pop FPM v
G ( )1 (4)
where f(popi) is a high-order polynomial in the population of municipality i; FPM corresponds to
actual FPM transfers, instrumented by its counterpart defined in the Brazilian Constitution (FPMt
are theoretical transfers); t are time fixed effects; φsare state fixed effects, and vi is an error term
clustered at the municipality level.
We therefore re-build the amount of transfers for each municipality by considering only the
rule of transfers before any political interference or endogenous decision on the part of
municipalities. To do so, we use the following steps. First, we collect data on federal government
revenues, income tax (IR), and a tax on industrialized products (IPI), which is a consumer tax that
is exogenous to municipalities’ decisions.
Next, we multiply this amount by 23.5% to determine the total amount of resources that
should be available for redistribution to municipalities for each year in our sample. As shown
before, according to Law No. 5.172/1966, of the total amount of FPM transfers, 10% belongs to
the capitals, 86.4% belongs to the municipalities of the interior, and the remaining 3.6% is the
Reserve Fund, which is distributed among countryside municipalities with more than 142,633
inhabitants (Decree Law no. 1.881/1981 and Complementary Law no. 91/1997, art. 3) Finally, to
calculate the local sharing coefficient, we use information on the population provided by the IBGE
(interior municipalities) and on the per capita income of the state (capitals), as published by the
government each year. This coefficient may be different from the final coefficient if there was a
reduction in the coefficient for the year 1997 (Complementary Law no. 91/1997 (art. 2) and
Supplementary Law no. 106/2001 (art. 1)). The municipalities that had a reduction in their
coefficients in 1997 are called municipalities supported by Supplementary Law no. 91/1997 and
those that did not have such a reduction are called nonsupported municipalities. This same law
also applies to other types of municipalities, namely, countryside municipalities and those entitled
to the Reserve Fund. We consider municipalities with up to 169,800 inhabitants and exclude state
capitals. For each municipality and year, we simulate the corresponding FPM transfers to be
received by using our first observation for the population in 2002. In so doing, we can compute
our instrument for the actual amount of FPM transfers. We aim to identify the increase or decrease
in municipalities’ population that shifts the municipality to a different threshold.
The causal effect that we are identifying is local for two reasons. First, because of the RDD,
the effect refers only to observations around the thresholds. Second, because of the IV setup, the
effect refers only to compliers, that is, municipalities that received larger transfers because of the
(exogenous) FPM revenue-sharing mechanism. However, the identification of compliers neglects a subpopulation that might also be of interest: the always-takers, municipalities that receive larger
The parameter of interest is 1. The function f(.) is a flexible function of the population. In fact, we use polynomials and allow them to differ between the positive and the negative parts of
the support of population bracket.
Insert Figure 2A and 2B
Examining the confidence intervals produced, we can note a clear discontinuity in the first
three cut-offs and a less pronounced discontinuity at cut-offs 4-7. These are the same thresholds
used in Brollo et al. (2013) and Litschig and Morrison (2013). Nevertheless, we attempt to
consider possible discontinuities at all population thresholds up to the 17th cut-off.
Table 9 presents our results. Column (1) presents the first stage in which all thresholds are
considered together, column (2) considers the variables in logarithms, column (3) separates
threshold discontinuities into three brackets (1-3, 4-7, and 8-17), and column (4) includes all
possible control variables in the first stage. The last two columns restrict the sample to agricultural
(5) and coastal (6) municipalities.
Insert Table 9 here
We also conduct a first-stage regression to evaluate the validity of our instruments, and we
find that our instruments are valid (based on an F test) in all but one model. Only for coastal
municipalities does our instrument not hold. Our strategy allows for not only an increase of more
than twice the effect of traditionally estimated unconditional transfers on total expenditures but
also a lower coefficient for health expenditures (see table A.2. on appendix). We also note that
even when we control for all possible variable, this instrument is significant, with an F-statistic of
12.10. We also restrict the sample size to municipalities that are agriculture dependent (with a
share of agriculture production above the median of the country; column 5) and observe that our
instrument also performs well with this sample. Therefore, we proceed to the analysis of FPM
effects in the second stage.24
4.3. Endogenous Educational Transfers: FUNDEB
Because education transfers (FUNDEB) depend on variables that are endogenous to municipalities
(number of students enrolled), local governments may increase enrollment to receive larger
transfers. In other words, local revenues per capita can be a response to education policy.
Additionally, municipalities with larger taxes demand better educational policies.
Another potential source of bias may be related to political aspects. As suggested by de
Janvry et al. (2009), mayors with high discount rates (or corrupt behavior) may not only generate
24
We do not find evidence on population manipulation on the part of municipalities. Using density estimation of population for municipalities close to all of the brackets considered in our paper, we do not find a statistical difference
higher revenue to maximize private gains but also decrease investments in education because of
their long-term pay-offs. The authors find that second-term mayors in Brazilian municipalities,
who are not eligible for reelection, have less transparent policies and are less likely to reduce
school drop-out rates by using federal funds designated for this purpose. By contrast, Ferraz and
Finan (2009) show that first-term mayors misappropriate 27% fewer resources than second-term
mayors, a finding that they also link to electoral incentives.
The best strategy to address these identification problems is to develop a valid instrument for
conditional transfers to education. This instrument should affect FUNDEB transfers but should not
affect other factors influencing the demand for FUNDEB transfers. We follow Kosec (2013) and
simulate a municipality’s tax revenue by using the algorithms of the laws in each year; however, we use pre-reform (1997) data on tax revenue and enrollment. We also allow some municipalities
to have the right to access a larger share of the funds through the take-over of state public schools,
exploiting the nation-wide rate at which municipal governments assumed the state's role in the
provision of primary education from 1998 to 2008. Federal rates of takeover are exogenous to
pre-primary education policy in any given municipality. Therefore, to better predict how enrollment
expands over the sample period without introducing endogenous information, we simulate that
each municipality took over a state primary school that is similar to the national average.
Consequently, FUNDEB transfers can increase more rapidly in municipalities after the reform
state than before, when federal involvement in primary education was more important.
Table 10 presents the first-stage results of our IV strategy. Column (1) presents the first stage
in which all thresholds are considered together, column (2) considers the variables in logarithms,
column (3) separates threshold discontinuities in three brackets (1-3, 4-7, and 8-17), and column
(4) includes all possible control variables in the first stage. The last two columns restrict the
sample to agricultural (5) and coastal (6) municipalities. Our instrument is robust (the F-statistic is
above 6 for all models), and the coefficient for all estimated FUNDEB’s IV lies between 1.3 and 2.3.
Insert Table 10 here
4.4 Endogenous Oil Transfers: Royalties
Our last step for identifying the effect of unconditional transfers on general and specific-purpose
public spending involves building an IV for royalties. We follow Caselli and Michaels (2013) and
recover oil and gas production for each field for our period of analysis. We then apply the rule of
royalty distribution to municipalities according to (exclusively) the oil and gas extraction of these
owing to refineries and installations built in some municipalities that possibly make royalty
transfers endogenous to those municipalities.
We use two strategies. As our first strategy, we consider royalties to be exogenous. Because
only 127 municipalities received royalties in 2002 and because we focus on all Brazilian
municipalities, any attempt to instrument these transfers would deeply reduce our sample. As our
second strategy, in line with Caselli and Michaels (2009), we build virtual royalty transfers as
instruments for royalties. By considering public data on oil and gas extraction for each oil field in
Brazil and each municipality’s coefficient participation in those royalties, we can calculate virtual
royalties’ transfers to recipients’ municipalities. Those virtual transfers are exogenous to
municipalities’ influence because the extraction of oils is not politically determined. Further, the variation across municipalities in our measure of oil output must be overwhelmingly driven by the
size of the oilfield, the technical difficulty of extracting the oil in that particular location, and the
share of the oilfield that is “captured” by the continental extension of the municipal boundaries (Caseli and Michaels, 2009). As shown in Table 11, our instrument seems to be valid (the
F-statistic larger than 2), except in the case of agricultural municipalities. The IV coefficient is
estimated to be between 0.6 and 1.1.
Insert Table 11 here
Transfers to municipalities conditional on health expenditures depend on the population in a
linear fashion, and this rule applies to all municipalities. One potential source of endogenous
variation is a change on the aggregated fiscal revenues that compose PAB annually. This change in
fiscal revenue could be caused by aggregated demand or supply shocks to the Brazilian economy.
We therefore decide to consider that municipalities cannot manipulate the amount of health
transfers received, and we use those transfers directly in the regression.
5. Results
5.1. Expenditures and Tax Revenues
5.1.1. Main results
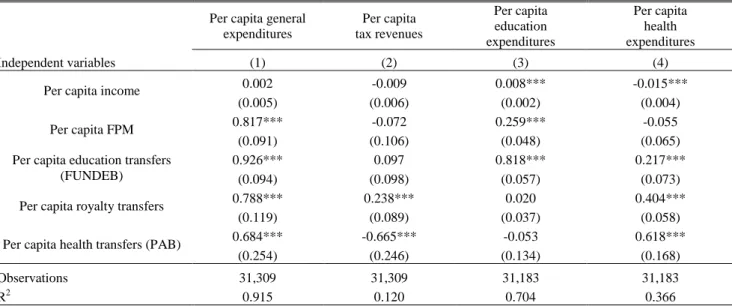
Table 12 presents the results for the linear specification model and refers only to the municipalities
that contain up to 169,800 inhabitants, excluding those with state capitals. Column (1) shows the
result for general expenditures, column (2) for tax revenues, column (3) for education expenditures,
and column (4) for health expenditures. We focus the analysis on the effects of income,
unconditional transfers (FPM and royalties), and conditional transfers (FUNDEB and PAB-SUS).
Our results consistently show that income has a smaller effect on public expenditures than
0.021 in general expenditures and of 0.008 on both tax revenues and education expenditures.25 We
also find a statistically significant positive effect of FPM transfers on expenditures (0.882). This
figure is close to that obtained by Inman (1971), Case, Hines, and Rosen (1993), Feldstein (1975),
and Olmsted, Denzau and Roberts (1993), which are equal to 0.65, 0.58, 0.6, and 0.68, respectively.
Finally, we find a nonsignificant effect of FPM transfers on tax collection (-0.025).
The effects of FPM transfers on education expenditures (0.245) and health expenditures
(0.155) are both positive and significant and are close to the levels established by law for total
revenue (i.e., municipalities must spend 25% on education and 15% on health.) The effect of
education transfers (FUNDEB) on general expenditures is also positive and significant (0.562) but
lower than the corresponding effect of FPM transfers. FUNDEB transfers also act by reducing both
tax revenues (-0.12) and health expenditures (-0.04).
We estimate that an R$1 increase in royalties implies only an R$0.50 increase in total
expenditures and an R$0.20 increase in health expenditures. The larger effect on total expenditures
(approximately 1.3) is due to health transfers. An increase in health transfers also has a strong effect
on health expenditures (0.848).
Our instruments for FPM and FUNDEB transfers aim to capture the ex-ante conditions for
each recipient municipality, excluding local governments’ policies or political movements to
receive larger benefits, which were possibly not captured by our controls. Therefore, a plausible
explanation for our results in columns (3) and (4) is that the amount of FPM transfers (royalties and
FUNDEB) received by the municipalities may be positively related to these local policies/political
movements to obtain more transfers, which, in turn, induce an upward bias (downward) on the FPM
(royalties and FUNDEB) coefficients. This finding essentially implies that municipalities with
larger FPM transfers per capita (less populated municipalities), on average, are those with larger
public expenditures. By contrast, municipalities that receive lower FUNDEB grants are those that
are willing to make a greater effort to increase their share, which would bias our estimates
downward. Finally, the main beneficiaries of royalties are municipalities that are less interested in
additional transfers and, therefore, are municipalities that have a downward bias for that coefficient.
Health transfers (PAB-SUS) present a consistent coefficient that close to that for the IV
estimations.
Insert Table 12 here
We could not find any statistical difference between the effects of unconditional and
conditional transfers on local public spending. This result is consistent with the theoretical
prediction that municipalities already devote a larger amount of resources than the amount of
transfers to those specific purposes (education or health). More important, our estimations suggest
that unconditional and conditional transfers have a full crowding-in effect on local spending; i.e.,
for each $1 of those transfers, we estimate an increase of $1 on local expenditures. However, the
coefficient for FPM is statistically similar to the coefficient for PAB-SUS but larger than that for
FUNDEB, which, in turn, is similar to the coefficient for royalties.
Regarding the comparison of the effects between local income and unconditional transfers,
the estimated effect of income is lower than the corresponding effect of FPM transfers. We estimate
that a $1 increase in local residents’ income has a much smaller effect on local public spending than a $1 increase in general-purpose transfers (FPM or royalties). The response of general expenditures
to FPM transfers is, in fact, quite large: 0.882. While the response of general expenditures to per
capita royalties is much lower, 0.497, it is nonetheless larger than the effect of income. Grant
money, therefore, seems to stick in the public sector, providing additional support to the
phenomenon known as the flypaper effect.
McGuire (1978) finds evidence that approximately 64% to 69% of education grants and
76% of noneducation grants (federal grants to local grants) in the United States are fungible. He
also finds an increase in the fungibility of grants from 1964 to 1971, which he explains by the
increase in the capacity of bureaucrats to manipulate budgets and thus to avoid complying with the
restrictions on grant use. By contrast, Zampelli (1986) finds no fungibility effect when he evaluates
the effect of aid at different levels of government. Shah (1989) reaches the same conclusion in
analyzing the effects of provincial transportation assistance on municipalities in Alberta, Canada26.
To analyze more carefully the effect of conditional and unconditional transfers on local
public spending, we focus on the most important expenditures of Brazilian municipalities. Almost
60% of local government spending goes to education and health; thus, we analyze the effects of
income, unconditional transfers, and conditional transfers on these specific areas.
First, we analyze the effects of unconditional transfers (FPM and royalties) on education
spending. We find evidence that both types of general-purpose transfers have greater stimulatory
effects than income. The results indicate that $1 received in FPM transfers tends to increase
expenditures on education by $0.25, whereas a $1 increase in income only increases expenditures
on education by $0.008. Royalties, on the other hand, does not seem to have a statistically
significant impact on education expenditures, but they do increase health expenditures by $0.21.
26
This result implies that the magnitudes of the effects of FPM transfers and royalties on education
spending statistically differ. This amount is very close to the estimates of Dahlberg et al. (2008) and
Lundqvist (2013), which vary between 0.6 and 0.90, and much larger than the estimates of
Ehrenberg (1973).
However, the effect of transfers on the average tax rate is nonsignificant. This result is
similar to that found by Dalhberg et al. (2008), who also do not find a significant effect of grants on
private goods. This result is, however, contrary to the evidence found by Lundqvist (2013), who
identifies a significant and negative effect that is larger than our estimate for FUNDEB (-0.14
versus -0.03, respectively).
Next, we compare the effects of unconditional transfers and conditional transfers on
education spending. We find that a $1 increase in FUNDEB transfers has a greater effect on
education spending than a $1 increase in unconditional transfers ($0.935 and $0.245, respectively).
The effect of unconditional transfers on education spending is much smaller, as expected.
Additionally, the value of 0.951 is not statistically different from one, providing evidence on favor
of the fungibility effect.27
Our estimates of the effect of FUNDEB transfers on education spending can be compared
with those of Knight (2002) for two reasons. First, both estimates relate to the effects of
specific-purpose expenditures. Second, both empirical strategies aim to eliminate the possible upward bias
in the conditional transfer estimates. However, our strategy, which consists of building a virtual
FUNDEB that is not exposed to municipalities’ decisions, is different from the political channel used by Knight (2002), although we also control for the same political variables. However, while
Knight finds evidence of a full crowding-out effect, our observed effect of conditional transfers is
smaller, although we nonetheless find a statistical difference between the effects of conditional
transfers and income.
Our results are comparable to those of Gordon (2004), who considers the effects of the Title
I program on local revenue and expenditures. She finds a large effect for the first year (coefficient
1.4), but the effect becomes nonsignificant after three years. However, the mean effect over these
three years (0.8) is very close to our estimated coefficient (0.7).
Regarding health expenditures, the results are generally similar to those obtained for
education expenditures. The effect of unconditional transfers is much larger than the effect of
income. Further, we find that conditional health transfers have a greater effect on health spending
than unconditional transfers, as expected. However, the conditionality imposed by the central
government does not ensure that the funds are being spent on health, as the coefficient for health
transfers is only 0.848. Local governments, therefore, seem to shift their health transfers to other
areas. Additionally, education transfers seems to negatively influence (-0.04) health expenditures.
The coefficient for FPM is 0.15, and the coefficient for GDP is close to zero. By contrast, the
coefficient for royalties is 0.2. 28
5.1.3 Functional forms
One of the main criticisms of the flypaper effect concerns the lack of robustness of the empirical
findings. Becker (1996), for example, argues that the estimates of the flypaper effect are sensitive to
the functional form used. To address this question, we also provide regressions wherein all
variables are presented in logarithms (Table 13).
Insert Table 13 here
The results remain qualitatively the same. Regarding the effect of transfers on total public
spending, our results show that local public spending is more elastic to unconditional transfers
(0.336 for FPM, 0.11 for royalties) than conditional transfers (0.05 for FUNDEB, 0.034 for PAB)
and that the elasticity of conditional transfers is closer to the elasticity of income (0.079). Note that
only unconditional transfers seem to have a consistently large effect (elasticity-wise) on total public
spending.
FPM and FUNDEB transfers act by reducing tax revenues, as opposed to income,
corroborating evidence of the flypaper effect, as shown by Dalberg et al. (2008). The elasticity
effect of royalties on tax collection is positive but much lower than the income elasticity effect.
Additionally, our results confirm that FUNDEB transfers (elasticity equal to 0.32) and PAB
(elasticity equal to 0.17) consistently have a greater effect on the respective type of public spending
(education and health) than unconditional transfers and income. The income elasticity effect is
estimated to have the smallest effect on education and health expenditures, with even a negative
effect on health expenditures. Royalties seem to positively affect health expenditures (elasticity