ACPD
8, 1191–1237, 2008European greenhouse gases fluxes over the last
ten years
C. Messager et al.
Title Page
Abstract Introduction
Conclusions References
Tables Figures
◭ ◮
◭ ◮
Back Close
Full Screen / Esc
Printer-friendly Version
Interactive Discussion Atmos. Chem. Phys. Discuss., 8, 1191–1237, 2008
www.atmos-chem-phys-discuss.net/8/1191/2008/ © Author(s) 2008. This work is licensed
under a Creative Commons License.
Atmospheric Chemistry and Physics Discussions
Ten years of CO
2
, CH
4
, CO and N
2
O fluxes
over Western Europe inferred from
atmospheric measurements at Mace
Head, Ireland
C. Messager1, M. Schmidt1, M. Ramonet1, P. Bousquet1, P. Simmonds2, A. Manning3, V. Kazan1, G. Spain4, S. G. Jennings4, and P. Ciais1
1
Laboratoire des Sciences du Climat et de l’Environnement, LSCE/IPSL, UMR 1572, CEA/CNRS/UVSQ, 91191 Gif-sur-Yvette, France
2
International Science Consultants, Ringwood, Hants, England, UK 3
Met Office, FitzRoy Road, Exeter, EX1 3PB, UK 4
Department of Experimental Physics, National University of Ireland, Galway, Ireland
Received: 29 November 2007 – Accepted: 12 December 2007 – Published: 24 January 2008
Correspondence to: C. Messager (Cyril.Messager@lsce.ipsl.fr)
ACPD
8, 1191–1237, 2008European greenhouse gases fluxes over the last
ten years
C. Messager et al.
Title Page
Abstract Introduction
Conclusions References
Tables Figures
◭ ◮
◭ ◮
Back Close
Full Screen / Esc
Printer-friendly Version
Interactive Discussion
Abstract
We estimated CO2, CH4, CO and N2O emission fluxes over the British Isles and West-ern Europe using atmospheric radon observations and concentrations recorded at the Mace Head Atmospheric Research Station between 1996 and 2005. We clas-sified hourly concentration data into either long-range European or regional sources
5
from Ireland and UK, by using local wind speed data in conjunction with 222Rn and 212
Pb threshold criteria. This leads to the selection of about 7% of the total data for both sectors. We then used continuous 222Rn measurements and assumptions on the surface emissions of 222Rn to deduce the unknown fluxes of CO2, CH4, CO and N2O. Our results have been compared to the UNFCCC, EMEP and EDGAR
sta-10
tistical inventories and to inversion results for CH4. For Western Europe, we found yearly mean fluxes of 4.1±1.5 106kg CO2km−2yr−1 , 11.9±2.0 103kg CH4km−2yr−1, 12.8±4.2 103kg CO km−2yr−1 and 520.2±129.2 kg N2O km−2yr−1, respectively, for CO2, CH4, CO and N2O over the period 1996–2005. The method based upon222Rn to infer emissions has many sources of systematic errors, in particular its poorly known
15
and variable footprint, uncertainties in222Rn soil fluxes and in atmospheric mixing of air masses with background air. However, these biases are likely to remain constant in the long-term, which makes the method quite efficient to detect trends in fluxes. Over the last ten years period, the decrease of the anthropogenic CH4, CO and N2O emissions in Europe estimated by inventories (respectively−30%,−35% and−23%) is
20
confirmed by the Mace Head data within 2%. Therefore, the222Rn method provides an independent way of verification of changes in national emissions derived from inven-tories. Using European-wide estimates of the CO/CO2 emission ratio, we also found that it is possible to separate the fossil fuel CO2emissions contribution from the one of total CO2fluxes. The fossil fuel CO2emissions and their trends derived in that manner
25
ACPD
8, 1191–1237, 2008European greenhouse gases fluxes over the last
ten years
C. Messager et al.
Title Page
Abstract Introduction
Conclusions References
Tables Figures
◭ ◮
◭ ◮
Back Close
Full Screen / Esc
Printer-friendly Version
Interactive Discussion
1 Introduction
Global networks to monitor the atmospheric mixing ratio of greenhouse gases (GHG) have been established by the National Oceanic and Atmospheric Administration Cli-mate Monitoring and Diagnostics Laboratory NOAA CMDL (Conway et al., 1988;Dlu-gokencky et al., 1994;Butler et al., 1998), the Atmospheric Lifetime Experiment–Global
5
Atmospheric Gases Experiment (ALE-GAGE) (Prinn et al., 1990; 2000), and others. Traditionally these networks, with stations situated remotely from sources, focused on tracking long-term trends and large-scale gradients on the global scale. On the ba-sis of these measurements, coarse-scale (large ocean basins, continents) budgets of greenhouse gases have been calculated using inverse models. Nowadays, the global
10
budgets of most GHGs are relatively well quantified and their major sources and sinks identified. However, on the regional scale, large uncertainties still remain. At this scale, the information available for GHG emissions is generally limited to statistical invento-ries (UNFCCC, 2007; EMEP, 2007; EDGAR, 2007). There are several limitations in the inventory based regional GHG budgets: natural sources are generally not taken into
15
account; uncertainties are only based upon errors in input statistics, and information about temporal and spatial variability is not provided. Independent verifications of the national emissions derived from inventories are thus crucial.
On local scales, trace gas fluxes of GHG can be measured directly. However, the spatially heterogeneous and temporally variable distribution of these fluxes requires
20
significant upscaling, using models and datasets with extensive coverage. Regional studies that fill the gap between the global and local scales are therefore needed to improve our estimates of emission inventories. During the last years, the networks of atmospheric measurements have become denser in Europe and also in North Amer-ica (CARBOEUROPE-IP,http://www.carboeurope.org/, North American Carbon Plan,
25
http://www.isse.ucar.edu/nacp/). Several studies attempted to regionalize greenhouse gas budgets using atmospheric observations at continental sites, where information about the sources was extracted from concentration changes on timescales of hours
ACPD
8, 1191–1237, 2008European greenhouse gases fluxes over the last
ten years
C. Messager et al.
Title Page
Abstract Introduction
Conclusions References
Tables Figures
◭ ◮
◭ ◮
Back Close
Full Screen / Esc
Printer-friendly Version
Interactive Discussion and days (Bakwin et al., 1997; Derwent et al., 1998; Levin et al., 1999; Schmidt et al.,
2003; Biraud et al., 2000; Manning et al., 2003). All this studies used quasi-continuous GHG concentration measurements, and in most cases combining together the records of different species. Recent inverse modelling work also attempted to make use of these continuous GHGs observations (Bergamaschi et al., 2005; Peylin et al., 2005).
5
Western European and Irish greenhouse gas emission fluxes for the years 1996 and 1997 (Biraud et al., 2000, 2002) were estimated in two previous studies using the continuous GHG data from the Mace Head station in Ireland. The approach was to scale synoptic variations of GHGs by those of222Rn, a tracer emitted rather uniformly by soils (Levin et al., 1999; Biraud et al., 2002; Schmidt et al., 2001a). In this study,
10
we re-analyze ten years of atmospheric CO2, CH4, CO and N2O data and use 222Rn to better quantify their fluxes. In this approach, we developed and applied a new data selection procedure to better discriminate between air masses of western European and Irish origin. The fluxes scaled over Europe and Ireland have been analysed for seasonal cycles and trends, and compared to emission inventory estimates.
15
2 The Mace Head GHG atmospheric records and measurement techniques
Mace Head atmospheric research station (Carna, County Galway) is located on the west coast of Ireland (53◦20′N, 9◦54′W). This station is one of the most important sites for atmospheric research in the northern hemisphere. Its location facilitates the investigation of trace constituents changes in marine and continental air masses. The
20
station is dominated by maritime air masses most of the time, but there are some modified continental air masses coming from Europe, which represents about 10% of the total data.
Mace Head is a part of a number of international research networks and is oper-ated by the Department of Physics of the National University of Ireland, Galway
(NUI-25
ACPD
8, 1191–1237, 2008European greenhouse gases fluxes over the last
ten years
C. Messager et al.
Title Page
Abstract Introduction
Conclusions References
Tables Figures
◭ ◮
◭ ◮
Back Close
Full Screen / Esc
Printer-friendly Version
Interactive Discussion was extended in 1995 to add a222Rn monitor at the station (Biraud et al., 2000).
At-mospheric CO2 concentration has been continuously measured using non-dispersive infrared analysers (NDIR). A Siemens Ultramat 5F was used from July 1992 to Au-gust 2002, and since AuAu-gust 2002 a Li-Cor 6252 has been deployed. The instruments data flow rate is 1 Hz and an hourly mean is automatically computed. The instruments
5
are calibrated against the Scripps Institution of Oceanography (SIO) X93 mol fraction scale and the precision of the CO2 concentration is better than 0.1 ppm (Bousquet et al., 1997).222Rn and212Pb, two natural radioactive compounds, are also measured at Mace Head by an active deposit method, with a time step of 2 h. The absolute error is estimated to be in the order of 20% (Polian et al., 1986; Biraud et al., 2000).
10
The University of Bristol has been measuring GHG and Montreal species as part of the ALE/GAGE/AGAGE network using a gas chromatograph with multi-detectors (Sim-monds et al., 1996; Cunnold et al., 1997; Prinn et al., 2000). CH4and N2O have been measured since January 1987, and CO since 1990 with a time step of 40 min. All the ALE/GAGE/AGAGE data are now recalibrated to the SIO-2005 scale (see Prinn et al.,
15
2000). The data used in the present study can be obtained on the CarboEurope Atmo-sphere Database (http://www.ce-atmosphere.cnrs-gif.fr/database/index database.html for CO2, 222Rn and meteorological parameters) and on the AGAGE web site (http: //agage.eas.gatech.edu/data archive/ for CO, CH4and N2O).
Figure 1 presents the CO2,222Rn, CO, CH4and N2O in-situ measurements at Mace
20
Head between 1992 and 2005. In these long-term series, we can see a trend in base-lines, as well as in seasonal cycles. For example in the CO2time series, we observe a long-term concentration increase (at a mean rate of 2 ppm per yr) and a seasonal cycle with minimum summertime value in August and a broad wintertime maximum from December. Superimposed on this signal are synoptic peaks generally associated
25
with pollution events from Europe, and even from North America.
ACPD
8, 1191–1237, 2008European greenhouse gases fluxes over the last
ten years
C. Messager et al.
Title Page
Abstract Introduction
Conclusions References
Tables Figures
◭ ◮
◭ ◮
Back Close
Full Screen / Esc
Printer-friendly Version
Interactive Discussion
3 Data selection of the Mace Head record
3.1 Data partitioning into marine, long-range european and regional origins
Different methods have already been tested to classify the Mace Head hourly data (Bousquet et al., 1997; Ryall et al., 1998; Biraud et al., 2000). A baseline selection has been first defined to detect marine air masses from the north Atlantic (clean air sector)
5
using winds and hourly CO2 concentration stability (Bousquet et al., 1997). Then, data selection protocols based upon winds and variability have also been developed to identify polluted air from Europe (Biraud et al., 2000), and air masses influenced by local sources in Ireland (Biraud et al., 2002). We aim here to classify the data into marine, European and regional (Ireland+UK) categories, based upon local wind speed
10
and direction, CO2 concentration stability, and 222Rn and 212Pb values criteria. The data selection criteria are summarized in Table 1.
1. To select oceanic air masses, we retain according to Bousquet et al. (1997), wind velocity values>4 m s−1within the (marine) sector 210–290◦, and winds>8 m s−1 within the tangential to the coast sectors 200–210◦ and 290–300◦. In addition,
15
hourly CO2standard deviation must be<0.4 ppm, and a marine “event” must last at least 4 h.
2. To select air masses with European long-range transport, we retain periods with 222
Rn>1000 mBq m−3and212Pb<40 mBq m−3. 212Pb is a regional tracer of con-tinental exposure with a radioactive decay time of 10.6 h. Therefore, placing an
20
upper limit on the212Pb concentration ensures little contamination of the selected European events by proximate Irish emissions. In addition, the mean wind speed during such European long range transport events must be greater than 5 ms−1 for at least 4 h.
3. To select regional air masses from Ireland and UK, we retain period with
25
ACPD
8, 1191–1237, 2008European greenhouse gases fluxes over the last
ten years
C. Messager et al.
Title Page
Abstract Introduction
Conclusions References
Tables Figures
◭ ◮
◭ ◮
Back Close
Full Screen / Esc
Printer-friendly Version
Interactive Discussion must remain lower than 5 m s−1for at least 4 h.
The criteria that we have defined are exclusive so that a given synoptic event can only be attributed to a single classification.
3.2 Choice of triple selection criteria using222Rn,212Pb and wind speed
222Rn and 212Pb are continuously emitted by soils and can be used as continental
5
tracers (the222Rn oceanic sources are 100 to 1000 times less than continental sources (Wilkening and Clements, 1975). 222Rn is used as a medium range continental tracer on synoptic transport time scales (radioactive decay time of 3.8 d) while212Pb provides a fingerprint of air freshly formed over land (radioactive decay time of 10.6 h). Using these two tracers, it is possible to separate local from long-range transported events.
10
High222Rn coincident with high212Pb levels relate to local air masses, while high222Rn and low212Pb levels are representative of European air masses (Lambert et al., 1982; Polian et al., 1986; Biraud et al., 2000; 2002). One has to determine appropriate dual criteria values for these two tracers. The oceanic data set over 1996–2005 indicates a mean background of 200 mBq m−3for222Rn and of 5 mBq m−3for212Pb. Further, 90%
15
of the hourly222Rn and212Pb values in the marine selection are below 10 mBq m−3for 212Pb and 400 mBq m−3 for222Rn (Fig. 2). We hence set up our minimum threshold values equal to these upper marine limits to define the Ireland+UK regional selection. A wind velocity maximum of 5 m s−1 further ensures that long-range transported air masses from the European continent are filtered out (under such low wind speeds,
20
the air has resided at least 24 h over Ireland or over the UK). To select long-range European air masses, we used the same robust criteria as in Biraud et al. (2000).
In order to increase the data selection performance, ECMWF (European Center for Medium Range Weather Forecasts) wind data have been used in the selection algo-rithm whenever no in situ wind speed was available. The ECMWF data have been
25
extracted from the ECMWF 45-year re-analysis (Uppala et al., 2005) for the period before 1 September 2002 and from the operational archive since then. Comparison
ACPD
8, 1191–1237, 2008European greenhouse gases fluxes over the last
ten years
C. Messager et al.
Title Page
Abstract Introduction
Conclusions References
Tables Figures
◭ ◮
◭ ◮
Back Close
Full Screen / Esc
Printer-friendly Version
Interactive Discussion between ECMWF and in situ wind speed values over 2000–2005 gives a high
correla-tion (R2=0.86) and a linear regression slope of 0.97. The absolute difference between in situ and ECMWF hourly wind speed is 2 m s−1(it represents 10% of the maximum observed wind speed and less than 1% of the selected data).
Using the above defined criteria we find on average that 30% of the air masses
mea-5
sured at Mace Head are entirely from the Atlantic marine sector, 6% from Ireland+UK and 7% from long-range European origin (Table 2). The average duration of the se-lected events is 25 h for the Ireland+UK, and 28 h (range 4 to 120 h) for the European long-range selections.
3.3 Occurrence of continental air masses
10
Figure 3 shows the averaged seasonal and diurnal histograms of selected events for the two continental sectors. European events are predominantly selected during win-tertime, while Ireland+UK events occur during summer time. This is due to different meteorological regimes. We distinguish two main types of transport regimes bring-ing air from the continent to Mace Head. The first regime (regional) corresponds to
15
an anticyclonic circulation over Ireland due to a high pressure system over the United Kingdom or over northern France. The second regime (long range) is characterized by an easterly flow chanelled by a depression situated either over Ireland or over the United Kingdom (Biraud, 2000). It is also clear in Fig. 3 that the air masses classified as being from Ireland+UK are sampled mostly during night-time. A rise in222Rn, CO2,
20
ACPD
8, 1191–1237, 2008European greenhouse gases fluxes over the last
ten years
C. Messager et al.
Title Page
Abstract Introduction
Conclusions References
Tables Figures
◭ ◮
◭ ◮
Back Close
Full Screen / Esc
Printer-friendly Version
Interactive Discussion 3.4 Independent verification of tracer-based data selection
It is difficult to find an alternative method to independently validate our data selec-tion protocol based upon tracers and meteorology. Back trajectories estimated by the HYSPLIT-4 model, were used for that purpose. HYSPLIT-4 (HYbrid Single-Particle La-grangian Integrated Trajectory) model (Version 4) is a complete system for computing
5
simple trajectories, using the NCEP meteorological data (Draxler and Rolph, 2003; Rolph, 2003). Figure 4 shows the center of mass of air masses backtrajectories se-lected for a European, and for a Ireland+UK origin. One can see that our long-range European selection corresponds to air masses coming from northern France, Ger-many, UK and Benelux countries, whereas our Ireland+UK selection corresponds to
10
air masses that spend at least 12 to 24 h over Ireland. Yet, according to the backtrajec-tory analysis results (Fig. 4), our selection method is ineffective to accurately separate United Kingdom.
We also verified our data selection using the Numerical Atmospheric dispersion Mod-elling Environment (NAME) transport model results. The NAME dispersion model has
15
been used to determine the fraction of air arriving at Mace Head, from different Euro-pean regions (Manning et al., 2003). With this methodology, they selected 11% of the total air masses reaching the Mace Head station as long-range European and 16% as regional to local (Table 3). We have compared their selection with our in situ criteria and found a good agreement between the two approaches. At least 60% of agreement
20
was found for Europe and 50% for Ireland+UK (that is more than 50% of the222Rn and 212
Pb based selected events agree with the NAME model classification). The NAME model selection is more effective than ours because it determines an origin for each hour continuously, while we depend on data availability.
In the following, we will use both the in-situ222Rn and the NAME selection methods
25
to determine the European and Ireland+UK trace gas emissions. We also make a combination of these two techniques in order to derive an error range on the inferred fluxes.
ACPD
8, 1191–1237, 2008European greenhouse gases fluxes over the last
ten years
C. Messager et al.
Title Page
Abstract Introduction
Conclusions References
Tables Figures
◭ ◮
◭ ◮
Back Close
Full Screen / Esc
Printer-friendly Version
Interactive Discussion
4 Case study of typical irish and european events
4.1 Events influenced by long-range european emissions and transport
Figure 5 shows a three and a half day typical European wintertime synoptic event oc-curring during the period 21–24 December 2000. During the whole event, the wind velocity is continuously greater than 7 m s−1 and the wind direction rotates from 125
5
to 90◦ (from the south east). This particular meteorological situation corresponds to a low-pressure system over the Atlantic Ocean, combined with high pressure over Scan-dinavia. It leads to a European easterly flow with winds coming from western Europe (in this case from France and Spain). From 20 to 21 December, the222Rn concentration increases rapidly up to values higher than 4000 mBq m−3, about 15 times the oceanic
10
background. The Radon concentration then stays between 2000 and 4000 mBq m−3 until 24 December at 10:00 UTC, the end of the event. Such high and persistent222Rn concentrations denote a clear signature of recent continental air. At the same time, 212
Pb is maintained at a relatively low level (<15 mBq m−3), which indicates no recent near-field continental exposure. Within this period, one can observe an increase of
15
CO2, CH4and CO. CO2is increasing slowly from 380 ppm up to 390 ppm with a small diurnal cycle (higher concentrations during the night). When the event terminates, 222
Rn and212Pb both drop down to their marine baseline level. This event tail is how-ever not classified as an oceanic one because the wind direction is not from the marine sector.
20
4.2 Event influenced by ireland and UK emissions
Figure 6 shows an example of CO2,222Rn,212Pb, CH4and CO variations together with wind velocity and wind direction at Mace Head from 21–26 May 2001. On 19 May, the station was influenced by strong westerly winds, resulting in low values of all trace gases and CO2hourly standard deviations lower than 0.07 ppm. From 21 May, strong
25
ACPD
8, 1191–1237, 2008European greenhouse gases fluxes over the last
ten years
C. Messager et al.
Title Page
Abstract Introduction
Conclusions References
Tables Figures
◭ ◮
◭ ◮
Back Close
Full Screen / Esc
Printer-friendly Version
Interactive Discussion an Irish event is selected (filled in grey), which fullfills our triple regional selection
cri-teria of low wind speed and high radionuclide concentrations. The situation is similar for the two following nights. Each day, between 00:00 and 12:00 UTC, an increase in 222
Rn,212Pb, CO2, CH4occurs, reflecting accumulation in the shallow stable nocturnal PBL and land breeze. Without a land breeze, one would rather expect a linear
progres-5
sive increase of all tracers during the night, stopping in the morning when convection gets established (Gibert et al., 2007). Here, the sharper observed increase and its duration until mid-day, coincident to the sharp wind direction shift (Fig. 6) rather sug-gests that land breeze plays a dominant role. During each regional “event”, the212Pb concentration changes repeatedly from a low level (≈0 mBq m−3i.e. the oceanic
back-10
ground) to an extremely high level (up to 100 mBq m−3 on 22 May which is typical of a recent continental exposure). The212Pb maxima are also related to the low wind speed (<5 m s−1) and local land breeze circulation. This situation is typical of a blocking over Ireland due to a high-pressure system located over the British Isles.
5 Fluxes estimation method
15
We infer the surface fluxes of CO2, CH4, CO, N2O using222Rn as a reference species. This method has been used before by (Biraud et al., 2000, 2002; Schmidt et al., 2001b; Schmidt et al., 2003) and is briefly summarized here after. The surface flux Jx of speciesxover the source region influencing the measurement station during a synoptic event, assumed to be vertically diluted in a well-mixed PBL, can be expressed by:
20
Jx =JRn
∆Cx ∆CRn
e−λRnτ (1)
whereJRn is the mean222Rn emission rate in the region of influence (assumed to be constant and uniform), and ∆Cx
∆CRn is the slope of the linear regression between hourly observations of x and 222Rn. For each event including more than 3 data points we
ACPD
8, 1191–1237, 2008European greenhouse gases fluxes over the last
ten years
C. Messager et al.
Title Page
Abstract Introduction
Conclusions References
Tables Figures
◭ ◮
◭ ◮
Back Close
Full Screen / Esc
Printer-friendly Version
Interactive Discussion calculate a linear regression slope between222Rn and the variation of each other trace
gas by minimizing the chi-square error. Then events with a Pearson correlation coeffi -cient less than 0.5 were rejected. The terme−λRnτ is a correction factor for the 222Rn
radioactive decay, which has to be considered if the air is not in contact with the land surface. We used the222Rn radioactive constant valueλRnof 0.182 d−1. For each event
5
classified as long-range European, the transit timeτis computed using the HYSPLIT-4 back-trajectory output and a gridded European country map at 0.5◦
×0.5◦ resolution.
The transit time is defined as the number of hours when the air mass has not been in recent contact with the land surface (i.e. over the ocean). Given the maximum event duration of 120 hours, a corresponding 120 hours back-trajectory is used to calculate
10
the value ofτ for each event, defined as cumulated number of hours spent over the ocean before reaching Mace Head. During the period 1996-2005, the average tran-sit time is 28 h. This value is used by default in case of missing back trajectory data, which reduces the estimated flux by 20%. For events classified as originating from Ireland+UK, the radioactive decay correction factor is neglected and air masses are
15
considered to be in permanent contact with the land surface. Schmidt et al. (2003) showed that during a typical night time inversion, the changes in222Rn activity as a re-sult of radioactive decay, was offset by emissions from soil, and lowered222Rn values by only 3–4%.
The 222Rn flux is not constant in time because higher soil humidity decreases the
20
exhalation rate (Eckhardt, 1990). However, due to the few measurements available, it is difficult to estimate the temporal variability of the fluxes (Szegvary et al., 2007; Szeg-vary, 2007). We have estimated a seasonal cycle for the European222Rn flux using a yearly mean exhalation rate of 57 Bq m−2h−1 (Eckhardt, 1990) and a seasonal varia-tion of 20% higher in summer and 20% lower in winter (Schmidt et al., 2003; Biraud et
25
ACPD
8, 1191–1237, 2008European greenhouse gases fluxes over the last
ten years
C. Messager et al.
Title Page
Abstract Introduction
Conclusions References
Tables Figures
◭ ◮
◭ ◮
Back Close
Full Screen / Esc
Printer-friendly Version
Interactive Discussion winter, based on the field campaigns of Biraud et al. (20081). We did not take into
ac-count any spatial or synoptic variability. There are two main sources of uncertainty: the 222
Rn emission flux used and the regression slope error. The uncertainty of the222Rn exhalation rate is estimated to be on the order of 20% (Eckhardt, 1990). We computed a mean uncertainty on the slopes of 10%. Propagating these errors implies an overall
5
uncertainty of the inferred fluxJxon the order of 30% (Biraud et al., 2000).
6 Results and discussion
The emissions of CO2, CH4, CO and N2O deduced from the 222Rn method for the events selected as European or Ireland+UK are shown in Fig. 7 and reported in Table 4-11. Three data selection methods were used based upon (1) 222Rn and
10
212Pb, (2) the NAME transport model results (Manning et al., 2003), and (3) a com-bination of both where the events common to (1) and (2) are used. We compared the results obtained from these three selection methods with national emission in-ventories. The UNFCCC inventory data for CO2, CH4 and N2O (http://unfccc.int/ ghg emissions data/items/3800.php) anthropogenic emissions and the EMEP expert
15
emission data (UNECE, 2003) for CO anthropogenic emissions (sector SNAP national, http://webdab.emep.int) were used. Fluxes deduced from European long-range events were compared to the sum of emissions from France, Germany, Netherlands, Belgium, Luxembourg and United Kingdom. Regional fluxes deduced from UK+Ireland were compared to the sum of emissions from these two countries.
20
The major shortcoming of the radon flux estimation method is the lack of information on the emission footprint associated with each event. In order to separate the contri-bution of each European countries emissions to the events recorded at Mace Head,
1
Biraud, S., Ielsch, G., Ramonet, M., Jutzi, S., Cuntz, M., Ciais, P., Levin, I., and Jennings, S. G.: Direct measurements of the 222-radon exhalation rate from soils in ireland., in preparation, 2008.
ACPD
8, 1191–1237, 2008European greenhouse gases fluxes over the last
ten years
C. Messager et al.
Title Page
Abstract Introduction
Conclusions References
Tables Figures
◭ ◮
◭ ◮
Back Close
Full Screen / Esc
Printer-friendly Version
Interactive Discussion we used back trajectories. For each hourly data classified with a European long-range
origin, we calculated the residence time over each 1◦
×1◦ degree pixel in western
Eu-rope. We found that the four countries which contribute dominantly to the Mace Head synoptic events are: France, Germany, Netherlands and United Kingdom. However, each country contribution varies from year to year. For example, the contribution of
5
Germany and Netherlands was found to be four times higher between 1999 and 2002 than during the other years. In addition, the percentage of European long range events is at least two times higher between 1999 and 2002 than for other years (Table 2). We can also see stronger peaks in the CH4and CO time series (Fig. 1).
6.1 CH4emissions
10
We determined a mean CH4 flux of 11.9±2.0 103kg CH4km−2yr−1 and 16.5±2.3 103kg CH4km−2yr−1, respectively, for Western Europe and Ireland+UK over the period 1996–2004. The flux variability within one year, calculated from individual synoptic events, is 5 and 9 103kg CH4km−2yr−1, respectively, for Europe and Ireland+UK. This variability relates to the different footprint of each event, and
15
also to the period of the year and the day at which the air mass is enriched by surface emissions. For the same period, the mean CH4flux of the UNFCCC inventory is 8.3±1.0 103kg CH4km−2yr−1 and 12.5±2.0 103kg CH4km−2yr−1, respectively, for Western Europe and Ireland+UK. The EDGAR inventory provides an emission estimate for 2000 which is in good agreement with the UNFCCC data, with a
20
reported uncertainty of 50% (Olivier et al., 1999). Over the same countries used in our radon and back-trajectory approach (Sect. 5), the NAME model inversion (Manning et al., 2003) gives a mean CH4 emission of 10.4±0.7 103kg CH4km−2yr−1 and 11.5±0.6 103kg CH4km−2yr−1, respectively, for Europe and Ireland+UK over 1995–2000 (Figs. 8 and 9).
25
ACPD
8, 1191–1237, 2008European greenhouse gases fluxes over the last
ten years
C. Messager et al.
Title Page
Abstract Introduction
Conclusions References
Tables Figures
◭ ◮
◭ ◮
Back Close
Full Screen / Esc
Printer-friendly Version
Interactive Discussion (Figs. 8 and 9). Unlike the atmospheric estimates, the inventories are not reporting
the total emissions, but only account for anthropogenic sources. This explains why they give lower emissions than the atmospheric approach. At the European level or at national scale, there is little information about the relative contribution of natural sources. The CORINAIR inventory indicates 28% of natural sources in 1990 for EU-15
5
(Gr ¨osslinger et al., 1996) which is comparable to the discrepancy observed between our estimates and the inventories.
Another difference between our results and the UNFCCC inventories is the interan-nual variability. The radon-derived aninteran-nual fluxes differ from UNFCCC by 25% to 80% depending on the year considered. Between 1996 and 2004, the UNFCCC data
indi-10
cate a total decrease of CH4emissions of 30%. This decrease is attributed to reduced CH4emissions from fugitive emissions (−41%) mainly due to the decline of coal mining, followed by waste (−49%) mainly due to reducing the amount of untreated
biodegrad-able waste in landfills and installing landfill gas recovery (EEA, 2005). Over 2002–2004, the CH4flux computed using the Mace Head data decrease of 30%, which is
compara-15
ble to the trend in UNFCCC data. No significant trend was obtained by our method for Ireland+UK emissions, whereas the UNFCCC indicates a 35% decrease of the sum of anthropogenic sources. The main reason for this discrepancy is probably due to the role of the natural sources (wetlands mainly) whose intensities co-vary with the climate (Bousquet et al., 2006). We compared our results to the CH4European estimated from
20
the global network of stations in the synthesis inversion of Bousquet et al. (2006). This study solved for monthly fluxes over large regions (Europe being one of them) with a fixed a priori geographic emission pattern within each region. The Mace Head station data were assimilated in the inversion of Bousquet et al. (2006), but monthly concen-trations were used. So their flux estimates are rather constrained by spatial-temporal
25
monthly gradients among different stations within and around Europe, than by synoptic scale variations as in this study. We averaged the Bousquet et al. (2006) flux estimate over Europe only for the grid-points belonging to the 4 countries dominantly influencing the Mace Head synoptic variability (Sect. 5). The results are shown in Figs. 8 and 9.
ACPD
8, 1191–1237, 2008European greenhouse gases fluxes over the last
ten years
C. Messager et al.
Title Page
Abstract Introduction
Conclusions References
Tables Figures
◭ ◮
◭ ◮
Back Close
Full Screen / Esc
Printer-friendly Version
Interactive Discussion Both for Europe and Ireland+UK, the interannual variability of the CH4 emissions are
comparable between the radon method (±2.0 103kg CH4km− 2
yr−1) and the Bousquet et al. (2006) global inversion data (±1.4 103kg CH4km−2yr−1). The mean value of the inversion is lower than the radon based estimates. However, according to Bousquet et al. (2006) the year-to-year CH4regional flux changes can be more robustly inverted
5
than their mean values. The inversion mean flux is very close to the EDGAR value, which is used as the a priori flux. Our abnormally high CH4 European emission in 2001 is very close to the results of Bergamashi et al. (2005) who used a regional in-version and assimilated the synoptic CH4 variability, but it is significantly higher than the Bousquet et al. (2006) who used a global inversion and assimilated only monthly
10
smoothed gradients.
6.2 N2O emissions
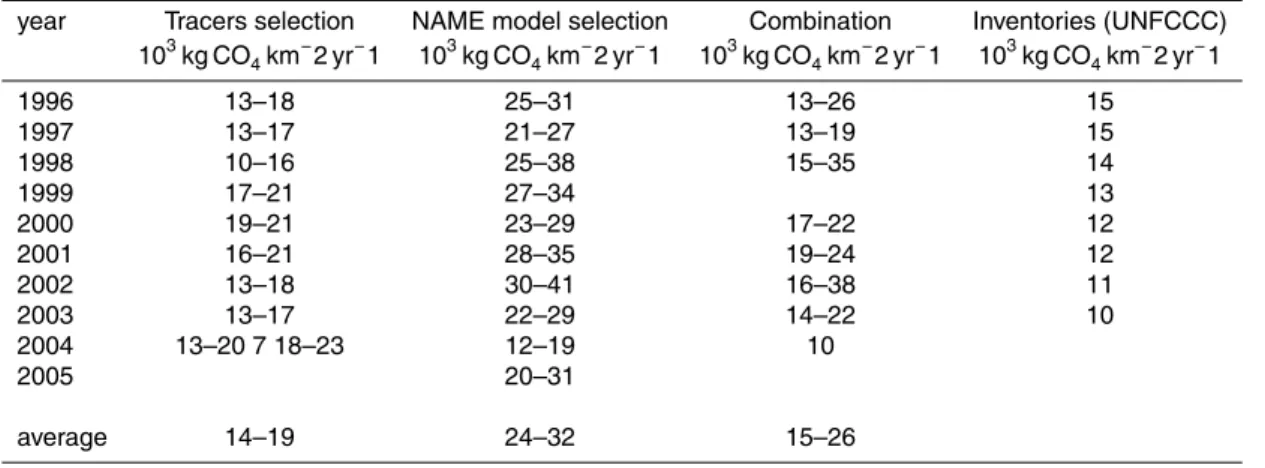
Fertilizer use in agriculture is the main contributor to the european-scale N2O flux (39% (Gr ¨osslinger et al., 1996). Other natural sources (forest soils, estuaries and wetlands) are estimated to be roughly equivalent to the agricultural source (Gr ¨osslinger et al.,
15
1996). The other anthropogenic sources (from industrial processes) represent 30% of the total emission (Gr ¨osslinger et al., 1996). The level of uncertainty of inventories for fertilizer induced emissions (based upon emission factors) are very high for N2O, on the order of 100% (Olivier et al., 1999;Bouwman et al., 2000). According to inventory data, there has been a large decrease of N2O emissions of 23% during the past decade in
20
the 4 western European countries investigated by the 222Rn method. This decrease is primarily due to reduced anthropogenic emissions via the implementation of cleaner industrial processes (58%) in adipic acid production plants in UK, Germany and France (EEA, 2005). In addition, N2O emissions from agricultural soils are reported to have decreased by 8% between 1990 and 2002, due to a decline in fertilizer and manure
25
use (EEA, 2005).
ACPD
8, 1191–1237, 2008European greenhouse gases fluxes over the last
ten years
C. Messager et al.
Title Page
Abstract Introduction
Conclusions References
Tables Figures
◭ ◮
◭ ◮
Back Close
Full Screen / Esc
Printer-friendly Version
Interactive Discussion 644.7±171.9 kg N2O km−2yr−1, respectively, for Europe and Ireland+UK over the
pe-riod 1996–2004. As shown in Fig. 8 the European emissions are very comparable to the average estimate of Manning et al. (2003) with the NAME model for 1996–2000 (603.6±104.4 kg N2O km−2yr−1). Our flux estimate for Ireland+UK is however greater than their calculation (488.5±79.8 kg N2O km−2yr−1). The N2O source estimation of
5
Schmidt et al. (2001a), based upon the Schauinsland atmospheric record (Germany), is 578±55 kg N2O km−2yr−1 for year 1998, which lies within our error bar for Europe (Fig. 8). Note that the region of influence of the Schmidt et al. (2001a) study corre-sponds more to south-western Europe.
Our mean European N2O emission estimate is very close to the UNFCCC inventory
10
data (difference of+7.4%). It is greater than the UNFCCC for Ireland+UK (difference of
+30%). Considering that the inventory accounts only for anthropogenic sources, such a relatively small difference would suggest that either anthropogenic sources are over-estimated, or that the natural sources are very small in Europe. The EDGAR database gives a total anthropogenic N2O emission for year 2000 which is 50% higher than the
15
UNFCCC. The EDGAR value is very close to the emission rate we are estimating for year 2000 both for Western Europe and Ireland+UK (Figs. 8 and 9). Regarding the trend over the period 1996–2004, our estimates suggest a decrease of N2O emissions by 21 and 29% respectively for Western Europe and Ireland+UK. These values are compatible with the trends given by UNFCCC (23% and 28% for the same regions).
20
This good agreement of the trends indicates that the natural sources which are included in the atmospheric method do not have any significant trend for this period.
6.3 CO2fluxes
We determined a CO2 flux for the period 1996–2004 equal to
4.1±1.5 106kg CO2km−2yr−1 and 6.6±2.9 106kg CO2km−2yr−1, respectively, for
25
Western Europe and Ireland+UK. This value is 1.4 times the one of Europe and 2.5 times the one of Ireland+UK compared to UNFCCC data. It is likely that this difference
ACPD
8, 1191–1237, 2008European greenhouse gases fluxes over the last
ten years
C. Messager et al.
Title Page
Abstract Introduction
Conclusions References
Tables Figures
◭ ◮
◭ ◮
Back Close
Full Screen / Esc
Printer-friendly Version
Interactive Discussion can be explained by natural fluxes, which are not counted by inventories. Moreover,
anthropogenic emissions are spatially heterogeneous, ranging for instance from 0.7 (France) to 4.3 (Netherlands) 106kg CO2km−2yr−1. Depending on the influencing source region, the CO2 vs. 222Rn slopes differ greatly at Mace Head, resulting in variable inferred fluxes between events. An improvement of our method in the future
5
should be to use footprint calculations (Hirsch, 2006) to provide explicit information about the source region, and allow quantitative comparison with geo-referenced emission inventory data.
The terrestrial CO2 fluxes are also strongly variable in both space and time. The CO2 sources from soil and plant respiration estimated by the ORCHIDEE model
10
(Krinner et al., 2005) over western Europe during 1996–2004 range from 2.9 to 3.4 106kg CO2km−2yr−1, with an average value of 3.2 106kg CO
2km− 2
yr−1 (Vetter et al., 2007). CO2uptake by photosynthesis is of the same order of magnitude, but occurs only in daytime, and during the growing season. Our data selection is strongly biased towards respiratory fluxes. Indeed, the selection of European long-range events picks
15
up more events in autumn and winter. The selection of Ireland+UK events picks up almost always night-time data (Fig. 3). Another process (called rectifier effect) is mak-ing the detection of biospheric CO2 uptake more difficult than the one of respiration. The diurnal and seasonal rectifier effect (Denning et al., 1995) correspond to a covari-ance between the PBL height and CO2 biospheric fluxes. Due to a greater dilution
20
of sinks, the surface CO2 concentration changes caused by photosynthesis is much smaller than the ones caused by respiration. Consequently the correlation between 222
Rn and CO2 variability is not very high in summer and in daytime (Hirsch, 2006). We have also to consider that the combined influence of regional sources and sinks in a given air mass, may degrade the correlation between CO2 and 222Rn variations.
25
One can expect to find a better correlation for an air mass which is only influenced by a positive flux to the atmosphere.
ACPD
8, 1191–1237, 2008European greenhouse gases fluxes over the last
ten years
C. Messager et al.
Title Page
Abstract Introduction
Conclusions References
Tables Figures
◭ ◮
◭ ◮
Back Close
Full Screen / Esc
Printer-friendly Version
Interactive Discussion ORCHIDEE model (Vetter et al., 2007). On average, the bottom-up estimate is only 9%
higher than the222Rn based value (4.5 versus 4.1 106kg CO2km−2yr−1). Our estimate displays a stronger interannual variability than the bottom-up one. This difference could results from a change in the footprint of synoptic events recorded at Mace Head.
6.4 CO emissions
5
We inferred a mean CO flux of 12.8±4.2 103kg CO km−2yr−1 and 11.9±1.9 103kg CO km−2yr−1 respectively for Europe and Ireland+UK during
1996-2004. There is practically no natural CO source over Europe (Olivier et al., 2003; Pfister et al., 2004) and secondary emissions by VOC oxidation are in the order of 5% (Granier et al., 2000) which may not influence our estimates. Consequently we expect
10
a closer agreement between inventories and the radon based flux estimates. Our CO source estimate is lower than the EMEP inventory by 14% and 21% respectively for Europe and Ireland+UK. Both EMEP and EDGAR inventory data agree well with each other for CO. The EDGAR uncertainty is estimated to 50%. The EMEP data show a significant quasi-linear decrease of CO emissions, by 35% in Europe and
15
51% in Ireland+UK over the last ten years. Our radon based fluxes display a strong interannual variability, with a negative trend of about 35% (0.85 significance level) for Europe and 32% for Ireland+UK (0.98 significance level).
6.5 Separating fossil and natural CO2sources using CO
The combustion sources of CO are proportional to those of fossil fuel CO2, which
20
makes CO a good candidate as a proxy tracer of fossil fuel CO2(Levin and Karstens, 2007; Gamnitzer et al., 2006). Assuming that the total CO2flux is the sum of a fossil fuel and a land biospheric component, and that the fossil CO2 flux is equal to the CO flux inferred using222Rn, and divided by the CO/CO2emission ratio (RCO/CO
2), it is
ACPD
8, 1191–1237, 2008European greenhouse gases fluxes over the last
ten years
C. Messager et al.
Title Page
Abstract Introduction
Conclusions References
Tables Figures
◭ ◮
◭ ◮
Back Close
Full Screen / Esc
Printer-friendly Version
Interactive Discussion possible to estimate the natural CO2flux (FBIO) as a residual from the total flux (FTOTAL):
FBIO(CO2)=FTOTAL(CO2)−FTOTAL(CO)
RCO/CO2
(2)
The value of FBIO is strongly dependent of the assumed ratio CO/CO2 ratio of emis-sions. A main difficulty being that the CO/CO2 emission ratio of different fossil fuel combustion sources, such as domestic heating or emissions from traffic, is highly
vari-5
able. The ratio is also variable from one European country to the other, depending on primary energy sources, on car fleets. Computing and using the mean CO/CO2 emission ratio (EMEP/UNFCCC) of the four European countries which were found to contribute dominantly to the Mace Head events (Sect. 5), we obtain a relatively good agreement (the averaged absolute difference is 39%) between the ORCHIDEE total
10
respiration CO2emission and the value derived from the above equation (Fig. 10).
7 Conclusions
A ten years continuous record of long-lived atmospheric trace gases at the Mace Head observatory have been analysed. We selected synoptic events influenced either by long-range European or by regional Ireland+UK sources, by using local wind speed
15
data in conjunction with222Rn and 212Pb threshold criteria. Back-trajectories and La-grangian transport model simulations further show that the air masses classified as long-range European originate mostly from France, Germany, Belgium, Netherlands, Luxembourg and the United Kingdom.
Continuous222Rn measurements were used to deduce the unknown fluxes of CO2,
20
CH4, CO and N2O using a tracer approach. In this approach, transport is not explicitly calculated, except for an average residence time for continental air masses to reach Mace Head. The value of the222Rn approach lies in the fact that it is model free, but its shortcomings are (1) the unknown footprint source region influencing the concen-trations, (2) the covariance between 222Rn emissions and each of the other species,
ACPD
8, 1191–1237, 2008European greenhouse gases fluxes over the last
ten years
C. Messager et al.
Title Page
Abstract Introduction
Conclusions References
Tables Figures
◭ ◮
◭ ◮
Back Close
Full Screen / Esc
Printer-friendly Version
Interactive Discussion (3) spatial and temporal uncertainties in the222Rn emissions from soils. These
short-comings cause mostly systematic errors of the inferred mean fluxes. However, these biases are unlikely to be interannual if a large number of events are analysed each year. Therefore, the222Rn based method is robust to detect trends in fluxes.
Our inferred fluxes have been compared to emission inventory data, with the
5
caveat that inventories often ignore natural emissions. Our estimated CH4 fluxes are 33% to 24% higher than the inventory data for Europe and Ireland+UK, respec-tively. This indicates that natural sources of CH4 (mainly wetlands) contribute up to 3.9 103kg CH4km−2yr−1 in both Europe and Ireland+UK. The decreasing trend of an-thropogenic CH4emissions over continental Europe (−30% over 1996–2004) reported
10
by the UNFCCC inventory is independently confirmed by our analysis. For N2O, we de-termined a mean European flux very close to the UNFCCC inventory data over western Europe, and 30% higher than the inventory value for Ireland+UK. The decreasing trend of N2O emissions detected with the radon method (−21% and−29%, respectively, for
Western Europe and Ireland+UK over 1996–2004) are in good agreement with the
UN-15
FCCC inventory (−23% and−28%, respectively). The CO2fluxes deduced from222Rn variations are more difficult to compare with inventories given the variability in space and time of biospheric fluxes. Further, the222Rn based approach has a sampling bias towards respiratory fluxes, since most of our summer time “events” occur during the night. The radon based CO2flux are in good agreement with the sum of UNFCCC
fos-20
sil fuel emissions and respiratory fluxes from the ORCHIDEE ecosystem model. We have combined the CO2and CO fluxes derived from the222Rn method, with the mean CO/CO2 emission ratio of inventories, in a rough attempt to separate the contribution of fossil fuel emissions. The fossil CO2emissions estimated in that manner agree well with the UNFCCC inventory data (within 23%). This work suggests that 222Rn data
25
can be used to constrain unknown emissions of other compounds. Long time series are useful for independent verification of emission trends. To overcome the present limitations of the 222Rn method, we plan in the future to use a newly available soil emission map (Szegvary, 2007; Szegvary et al., 2007) and to estimate the footprint of
ACPD
8, 1191–1237, 2008European greenhouse gases fluxes over the last
ten years
C. Messager et al.
Title Page
Abstract Introduction
Conclusions References
Tables Figures
◭ ◮
◭ ◮
Back Close
Full Screen / Esc
Printer-friendly Version
Interactive Discussion each concentration measurement using transport model simulations (run in backward
mode). Furthermore, correcting for the covariance between222Rn and other species emissions will reduce the biases in the tracer approach.
Acknowledgements. This work is part of a PhD thesis funded by the French Research and Education Ministry, the French ANR N-TWO-O project and CarboEurope program. Mace Head
5
station operations are supported by the Global Atmospheres Division of the UK Department of the Environment, Food, and Rural Affairs through contracts EPG1/1/30, and CEPG 24. We also thank all members of the AGAGE team for their contributions to the Mace Head research. We thank N. Viovy (LSCE, Gif-sur-Yvette, France) for providing the ORCHIDEE data and F. Cheval-lier (LSCE, Gif-sur-Yvette, France) for providing the ECMWF data. We thank the Comissariat `a
10
l’Energie Atomique for the calculation support.
References
Bakwin, P., Hurst, D., Tans, P., and Elkins, J.: Anthropogenic sources of halocarbons, sulfur hexafluoride, carbon monoxide, and methane in the southeastern United States, J. Geophys. Res., 102(D13), 15 915–15 925, 1997.
15
Bergamaschi, P., Krol, M., Dentener, F., Vermeulen, A., Meinhardt, F., Graul, R., Ramonet, M., Peters, W., and Dlugokencky, E. J.: Inverse modelling of national and european ch4 emissions using the atmospheric zoom model tm5, Atmos. Chem. Phys., 5, 2431–2460, 2005,
http://www.atmos-chem-phys.net/5/2431/2005/.
20
Biraud, S.: Vers la r ´egionalisation des puits et spources des compos ´es `a effet de serre: Analyse de la variabilit ´e synoptique `a l’observatoire de mace head, irlande, PhD, University Paris VII, Paris, 1–241, 2000.
Biraud, S., Ciais, P., Ramonet, M., Simmonds, P., Kazan, V., Monfray, P., O’Doherty, S., Spain, T. G., and Jennings, S. G.: European greenhouse gas emissions estimated from continuous
25
atmospheric measurements and radon-222 at mace head, ireland, J. Geophys. Res., 105, 1351–1366, 2000.
ACPD
8, 1191–1237, 2008European greenhouse gases fluxes over the last
ten years
C. Messager et al.
Title Page
Abstract Introduction
Conclusions References
Tables Figures
◭ ◮
◭ ◮
Back Close
Full Screen / Esc
Printer-friendly Version
Interactive Discussion chloroform emissions over ireland from atmospheric observations at mace head, Tellus, 54,
41–60, 2002.
Bousquet, P., Gaudry, A., Ciais, P., Kazan, V., Monfray, P., Simmonds, P. G., Jennings, S. G., and O’Connor, T. C.: Atmospheric concentration variations recorded at mace head, ireland, from 1992 to 1994, Phys. Chem. Earth, 21, 477–481, 1997.
5
Bousquet, P., Ciais, P., Miller, J. B., Dlugokencky, E. J., Hauglustaine, D. A., Prigent, C., Van der Werf, G. R., Peylin, P., Brunke, E. G., Carouge, C., Langenfelds, R. L., Lathiere, J., Papa, F., Ramonet, M., Schmidt, M., Steele, L. P., Tyler, S. C., and White, J.: Contribution of anthropogenic and natural sources to atmospheric methane variability, Nature, 443, 439– 443, 2006.
10
Bouwman, A. F., Taylor, J. A., and Kroeze, C.: Testing hypotheses on emissions of nitrous oxide using atmospheric models, Chemosphere - Global Change Science, 2, 475–492, 2000. Butler, J. H., Montzka, S. A., Clarke, A. D., Lobert, J. M., and Elkins, J. W.: Growth and
distri-bution of halons in the atmosphere, J. Geophys. Res., 103, 1503–1511, 1998.
Conway, T. J., Tans, P. P., Waterman, L. S., Thoning, K. W., Masarie, K. A., and Gammon, R. H.:
15
Atmospheric carbon dioxyde measurements in the remote global troposphere, 1981–1984, Tellus, 40, 81–115, 1988.
Cunnold, D. M., Weiss, R. F., Prinn, R. G., Hartley, D., Simmonds, P. G., Fraser, P. J., Miller, B., Alyea, F. N., and Porter, L.: Gage/agage measurements indicating reductions in global emissions of ccl3f and ccl2f2 in 1992–1994, J. Geophys. Res., 102, 1259–1269, 1997.
20
Denning, A. S., Fung, I. Y., and Randall, D. A.: Latitudinal gradient of atmospheric co2 due to seasonal exchange with land biota, Nature, 376, 240–243, 1995.
Derwent, R. G., Simmonds, P. G., O’Doherty, S., Ciais, P., and Ryall, D. B.: European source strengths and northern hemisphere baseline concentrations of radiatively active trace gases at mace head, ireland, Atmos. Environ., 32, 3703–3715, 1998.
25
Dlugokencky, E. J., Steele, L. P., Lang, P. M., and Masarie, K. A.: The growth rate and distribu-tion of atmospheric methane, J. Geophys. Res., 99, 17 021–17 043, 1994.
Hysplit (hybrid single-particle lagrangian integrated trajectory) model access via noaa arl ready website (http://www.Arl.Noaa.Gov/ready/hysplit4.Html), available at: http://www.arl. noaa.gov/ready/hysplit4.html, 2003.
30
Eckhardt, K.: Messung des radonflusses und seiner abh ¨angigkeit von der bodenbeschaff en-heit, Diplomarbeit, Institut f ¨ur umweltphysik – Universit ¨at Heidelberg, Heidelberg, 1990. EDGAR: Emission Database for Global Atmospheric Research, available at: http://www.Mnp.
ACPD
8, 1191–1237, 2008European greenhouse gases fluxes over the last
ten years
C. Messager et al.
Title Page
Abstract Introduction
Conclusions References
Tables Figures
◭ ◮
◭ ◮
Back Close
Full Screen / Esc
Printer-friendly Version
Interactive Discussion Nl/edgar/, 2007.
EEA: Greenhouse gas emissions and removals (csi 010), European Environment Agency, Copenhagen, Denmark, 2005.
EMEP: Activity data and emission database, available at:http://webdab.Emep.Int/, 2007. Gamnitzer, U., Karstens, U., Kromer, B., Neubert, R. E. M., Meijer, H. A. J., Schroeder, H.,
5
and Levin, I.: Carbon monoxide: A quantitative tracer for fossil fuel co2?, J. Geophys. Res.-Atmos., 111, D22302, doi:10.1029/2005JD006966, 2006.
Gibert, F., Schmidt, M., Cuesta, P., Ciais, P., Ramonet, M., Xueref, I., Larmanou, E., and Flamant, P. H.: Retrieval of average co2 fluxes by combining in situ co2 measurements and backscatter lidar information, J. Geophys. Res., 112, D10301, doi:10.1029/2006JD008190,
10
2007.
Granier, C., Petron, G., Muller, J. F., and Brasseur, G.: The impact of natural and anthropogenic hydrocarbons on the tropospheric budget of carbon monoxide, Atmos. Environ., 34, 5255– 5270, 2000.
Gr ¨osslinger, E., Radunsky, K., and Ritter, M.: Corinair 1990 summary report 1 – topic report
15
7/96, European Environment Agency, Copenhagen, Denmark, 1996.
Hirsch, A. I.: On using radon-222 and co2 to calculate regional-scale co2 fluxes, Atmos. Chem. Phys. Discuss., 6, 10 929–10 958, 2006.
Krinner, G., Viovy, N., de Noblet-Ducoudre, N., Ogee, J., Polcher, J., Friedlingstein, P., Ciais, P., Sitch, S., and Prentice, I. C.: A dynamic global vegetation model for
stud-20
ies of the coupled atmosphere-biosphere system, Global Biogeochem. Cy., 19, GB1015, doi:10.1029/2003GB002199, 2005.
Lambert, G., Polian, G., Sanak, J., Ardouin, B., Buisson, A., Jegou, A., and Le Roulley, J. C.: Cycle du radon et de ses descendants: Application `a l’ ´etude des ´echanges troposph `ere-stratosph `ere, Ann. Geophys., 38, 497–531, 1982,
25
http://www.ann-geophys.net/38/497/1982/.
Levin, I., Glatzel-Mattheier, H., Marik, T., Cuntz, M., Schmidt, M., and Worthy, D. E.: Verification of german methane emissions inventories and their recent changes based on atmospheric observations., J. Geophys. Res., 104, 3447–3456, 1999.
Levin, I. and Karstens, U.: Inferring high-resolution fossil fuel co2 records at continental sites
30
from combined (co2)-c-14 and co observations, Tellus B, 59, 245–250, 2007.
mod-ACPD
8, 1191–1237, 2008European greenhouse gases fluxes over the last
ten years
C. Messager et al.
Title Page
Abstract Introduction
Conclusions References
Tables Figures
◭ ◮
◭ ◮
Back Close
Full Screen / Esc
Printer-friendly Version
Interactive Discussion eling back-attribution technique, J. Geophys. Res., 108, 4405, doi:10.1029/2002JD002312,
2003.
Olivier, J. G. J., Bouwman, A. F., Berdowski, J. J. M., Veldt, C., Bloos, J. P. J., Visschedijk, A. J. H., van der Maas, C. W. M., and Zandveld, P. Y. J.: Sectoral emission inventories of greenhouse gases for 1990 on a per country basis as well as on 1ox1o, Environ. Sci. Policy,
5
2, 241–263, 1999.
Olivier, J. G. J., Peters, J., Granier, C., P ´etron, G., M ¨uller, J. F., and Wallens, S.: Present and future surface emissions of atmospheric compounds, EU proj. EVK2-1999-0001111, Eur. Union, Brussels, 2003.
Peylin, P., Rayner, P. J., Bousquet, P., Carouge, C., Hourdin, F., Heinrich, P., Ciais, P., and
10
contributors, A.: Daily co2 flux estimates over europe from continuous atmospheric mea-surements: 1, inverse methodology, Atmos. Chem. Phys. Discuss., 5, 1647–1678, 2005, http://www.atmos-chem-phys-discuss.net/5/1647/2005/.
Pfister, G., P ´etron, G., Emmons, L. K., Gille, J. C., Edwards, D. P., Lamarque, J. F., Attie, J.-L., Granier, C., and Novelli, P. C.: Evaluation of co simulations and the analysis of the co budget
15
for europe, J. Geophys. Res., 109, D19304, doi:10.1029/2004JD004691, 2004.
Polian, G., Lambert, G., Ardouin, B., and Jegou, A.: Long-range transport of continental radon in subantarctic and antarctic areas, Tellus, 38B, 178–189, 1986.
Prinn, R., Cunnold, D., Rasmussen, R., Simmonds, P., Alyea, F., Crawford, A., Fraser, P., and Rosen, R.: Atmospheric emissions and trends of nitrous-oxide deduced from 10 years of
20
ale-gauge data, J. Geophys. Res., 95, 18 369–18 385, 1990.
Prinn, R., Weiss, R., Fraser, P., Simmonds, P., Cunnold, D., Alyea, F., O’Doherty, S., Salameh, P., Miller, B., Huang, J., Wang, R., Hartley, D., Harth, C., Steele, L., Sturrock, G., Midgley, P., and McCulloch, A.: A history of chemically and radiatively important gases in air deduced from ale/gage/agage, J. Geophys. Res., 105, 17 751–17 792, 2000.
25
Real-time environmental applications and display system (ready) website (http://www.Arl.Noaa.Gov/ready/hysplit4.Html), available at: http://www.arl.noaa.gov/ ready/hysplit4.html, 2003.
Ryall, D. B., Maryon, R. H., Derwent, R. G., and Simmonds, P. G.: Modelling long-range trans-port of cfcs to mace head, ireland, Q. J. Roy. Meteor. Soc., 124, 417–446, 1998.
30
Schmidt, M., Glatzel-Mattheier, H., Sartorius, H., Worthy, D., and Levin, I.: Western european n2o emissions: A top-down approach based on atmospheric observations, J. Geophys. Res., 106, 5507–5516, 2001a.
ACPD
8, 1191–1237, 2008European greenhouse gases fluxes over the last
ten years
C. Messager et al.
Title Page
Abstract Introduction
Conclusions References
Tables Figures
◭ ◮
◭ ◮
Back Close
Full Screen / Esc
Printer-friendly Version
Interactive Discussion Schmidt, M., Neubert, R., Facklam, C., Heinz, R., Weller, R., and Levin, I.: Variability of co2
and its stable isotope ratios at shauinsland (germany) and neumayer (antarctica), 6th inter-national CO2 conference, Senda¨ı, Japan, 116–119, 2001b.
Schmidt, M., Graul, R., Sartorius, H., and Levin, I.: The schauinsland co2 record: 30 years of continental observations and their implications for the variability of the european co2 budget,
5
J. Geophys. Res., 108(D19), 4619, doi:10.1029/2002JD003085, 2003.
Simmonds, P. G., Derwent, R. G., Mc Culloch, A., O’Doherty, S., and Gaudry, A.: Long-term trends in concentrations of halocarbons and radiatively active trace gases in atlantic and european air masses monitored at mace head, ireland from 1987–1994, Atmos. Environ., 30, 4041–4063, 1996.
10
Szegvary, T., Leuenberger, M. C., and Conen, F.: Predicting terrestrial 222rn flux using gamma dose as a proxy, Atmos. Chemi. Phys. Discuss., 7, 1877–1892, 2007.
UNECE: Present state of emission data., Geneva, Switzerland, EB.AIR/GE.1/2004/2010., 2003.
United Nations Framework Convention on Climate Change, avalable at: http://unfccc.int/ghg
15
emissions data/items/3800.php, 2007.
Uppala, S. M., Kallberg, P. W., Simmons, A. J., Andrae, U., Bechtold, V. d. C., Fiorino, M., Gibson, J. K., Haseler, J., Hernandez, A., Kelly, G. A., Li, X., Onogi, K., Saarinen, S., Sokka, N., Allan, R. P., Andersson, E., Arpe, K., Balmaseda, M. A., Beljaars, A. C. M., Berg, L. v. d., Bidlot, J., Bormann, N., Caires, S., Chevallier, F., Dethof, A., Dragosavac, M., Fisher,
20
M., Fuentes, M., Hagemann, S., Holm, E., Hoskins, B. J., Isaksen, L., Janssen, P. A. E. M., Jenne, R., McNally, A. P., Mahfouf, J.-F., Morcrette, J.-J., Rayner, N. A., Saunders, R. W., Simon, P., Sterl, A., Trenberth, K. E., Untch, A., Vasiljevic, D., Viterbo, P., and Woollen, J.: The era-40 re-analysis, Q. J. Roy. Meteor. Soc., 131, 2961–3012, 2005.
Vetter, M., Churkina, G., Jung, M., Reichstein, M., Zaehle, S., Bondeau, A., Chen, Y., Ciais,
25
P., Feser, F., Freibauer, A., Geyer, R., Jones, C., Papale, D., Tenhunen, J., Tomelleri, E., Trusilova, K., Viovy, N., and Heimann, M.: Analyzing the causes and spatial pattern of the european 2003 carbon flux anomaly in europe using seven models, Biogeosciences Dis-cuss., 4, 1201–1240, 2007,
http://www.biogeosciences-discuss.net/4/1201/2007/.
30
ACPD
8, 1191–1237, 2008European greenhouse gases fluxes over the last
ten years
C. Messager et al.
Title Page
Abstract Introduction
Conclusions References
Tables Figures
◭ ◮
◭ ◮
Back Close
Full Screen / Esc
Printer-friendly Version
Interactive Discussion Table 1.Parameters used to select air masses from the ocean, Ireland+UK and Europe.
Air mass initials 222Rn 212Pb wind direction wind velocity CO2hourly event duration (mBq m−3) (mBq m−3) (◦) (m s−1) SD (ppm) (h)
210–290 >4 <0.4 >4
Ocean RBC – – 200–210 >8 <0.4 >8
& 290–300
Ireland+UK IRL >400 >10 – <5 – >4
Europe EUR >1000 <40 – >5 – >4
ACPD
8, 1191–1237, 2008European greenhouse gases fluxes over the last
ten years
C. Messager et al.
Title Page
Abstract Introduction
Conclusions References
Tables Figures
◭ ◮
◭ ◮
Back Close
Full Screen / Esc
Printer-friendly Version
Interactive Discussion Table 2.Dual tracer approach selection statistics.
Ireland+UK Europe
year number of events % of available data number of events % of available data
1996 28 7 24 8
1997 39 11 32 9
1998 22 5 11 3
1999 48 9 19 3
2000 49 8 17 3
2001 38 7 31 5
2002 26 4 36 12
2003 45 5 63 14
2004 21 2 31 5
2005 23 3 21 5
ACPD
8, 1191–1237, 2008European greenhouse gases fluxes over the last
ten years
C. Messager et al.
Title Page
Abstract Introduction
Conclusions References
Tables Figures
◭ ◮
◭ ◮
Back Close
Full Screen / Esc
Printer-friendly Version
Interactive Discussion Table 3.NAME model selection statistics.
Local Europe
year number of events % of total data number of events % of total data
1996 81 19 46 19
1997 90 23 48 15
1998 66 16 28 9
1999 65 16 26 7
2000 67 19 22 6
2001 77 19 38 12
2002 55 14 32 13
2003 52 12 47 17
2004 59 12 34 8
2005 55 14 33 8
average 16 11
ACPD
8, 1191–1237, 2008European greenhouse gases fluxes over the last
ten years
C. Messager et al.
Title Page
Abstract Introduction
Conclusions References
Tables Figures
◭ ◮
◭ ◮
Back Close
Full Screen / Esc
Printer-friendly Version
Interactive Discussion Table 4. CO2 fluxes for Europe region computed using two data selections (units are
103kg CO2km− 2
yr−1 ).
year Tracers selection NAME model selection Combination Inventories (UNFCCC) 103kg CO2km−2 yr−1 103
kg CO2km−2 yr−1 103
kg CO2km−2 yr−1 103
kg CO2km−2 yr−1
1996 2738–3705 4634–6021 3307–5015 1668
1997 2334–5064 3659–6569 4555–6669 1612
1998 557–2796 1629
1999 5009–6814 5513–7139 1585
2000 4974–7564 3610–5718 1591
2001 2130–4984 3786–5504 3255–7720 1614
2002 4440–5807 4103–5597 4251–5989 1582
2003 2067–3072 3271–4547 1926–2640 1604
2004 1089–3547 2993–4644 4053–7217 1606
2005 763–5773 3570–5988 3644–7051
ACPD
8, 1191–1237, 2008European greenhouse gases fluxes over the last
ten years
C. Messager et al.
Title Page
Abstract Introduction
Conclusions References
Tables Figures
◭ ◮
◭ ◮
Back Close
Full Screen / Esc
Printer-friendly Version
Interactive Discussion Table 5. CH4 fluxes for Europe region computed using two data selections (units are
103kg CH4km− 2
yr−1 ).
year Tracers selection NAME model selection Combination Inventories (UNFCCC) 103kg CO4km−2 yr−1 103
kg CO4km−2 yr−1 103
kg CO4km−2 yr−1 103
kg CO4km−2 yr−1
1996 11–14 14–18 11–14 10
1997 12–14 10–12 10–12 9
1998 7–14 9
1999 13–15 16–19 9
2000 11–15 17–20 12–18 8
2001 13–16 16–19 13–16 8
2002 8–10 12–16 8–11 8
2003 10–12 10–12 9–11 8
2004 8–10 9–11 7–10 7
2005 14–20 7
average 11–14 12–16 10–13