© 2006 Author(s). This work is licensed under a Creative Commons License.
Hydrometeor classification from dual-polarized weather radar:
extending fuzzy logic from S-band to C-band data
F. S. Marzano1,2, D. Scaranari2, M. Celano3,4, P. P. Alberoni3, G. Vulpiani1, and M. Montopoli1
1CETEMPS, Universit`a dell’Aquila, L’Aquila, Italy
2DIE, Universit`a degli Studi di Roma “La Sapienza”, Rome, Italy 3ARPA-SIM, Bologna, Italy
4DF, Universit`a di Ferrara, Ferrara, Italy
Received: 11 November 2005 – Revised: 16 January 2006 – Accepted: 30 January 2006 – Published: 14 February 2006
Abstract.A model-based fuzzy classification method for C-band polarimetric radar data, named Fuzzy Radar Algorithm for Hydrometeor Classification at C-band (FRAHCC), is pre-sented. Membership functions are designed for best fitting simulation data at C-band, and they are derived for ten dif-ferent hydrometeor classes by means of a scattering model, based on T-Matrix numerical method. The fuzzy logic classi-fication technique uses a reduced set of polarimetric observ-ables, i.e. copolar reflectivity and differential reflectivity, and it is finally applied to data coming from radar sites located in Gattatico and S. Pietro Capofiume in North Italy. The final purpose is to show qualitative accuracy improvements with respect to the use of a set of ten bidimensional MBFs, pre-viously adopted and well suited to S-band data but not to C-band data.
1 Introduction
New generation of dual-polarized weather radar systems may offer the opportunity to detect and identify different classes of hydrometeors present in stratiform and convective storms (Bringi and Chandrasekar, 2001). This important feature depends on the fact that polarimetric radar measurements are highly sensitive to physical properties of hydrometeors like composition, size, shape and orientation (Vulpiani et al., 2005). Hydrometeor classification may facilitate to study rain-cloud microphysics, to detect hailstorms and to choose the correct algorithm for precipitation rate retrieval. Last but not least, hydrometeor identification may also be useful for flight assistance and weather nowcasting.
Polarimetric signatures depend also on the frequency used by the radar system. The consequence is that S-band sig-nals differ substantially from C-band sigsig-nals, especially as Correspondence to:F. S. Marzano
far as differential reflectivity and specific differential phase are concerned. As a matter of fact, most scientific litera-ture about hydrometeor classification describes classification techniques designed for S-band radar data (e.g., Vivekanan-dan et al., 1999; Straka et al., 2000; Zrni´c et al., 2001; Lim et al., 2005). Only recently some works related to C-band measurements have been presented (Alberoni et al., 2002; Keenan, 2003; Baldini et al., 2004; Galletti et al., 2005). The interest of assessing C-band hydrometeor classification emerges from the consideration that almost all European weather radars operate at C-band. C-band radar systems have a reduced antenna size and, usually, an overall lower cost with respect to that of an S-band system with similar charac-teristics (Baldini et al., 2004).
In this work, a model-based fuzzy-logic classification method for C-band polarimetric radar data is presented. Membership functions (MBFs) are designed for best fitting simulation data at C-band and they are derived for ten dif-ferent hydrometeor classes by means of a radar scattering model, based on T-Matrix numerical method. The fuzzy logic classification technique, named Fuzzy Radar Algorithm for Hydrometeor Classification at C band (FRAHCC), uses here a reduced set of polarimetric observables, i.e.Zhhand
Zdr, and it is finally applied to data coming from radar sites located in Gattatico and S. Pietro Capofiume in Northern Italy. The main purpose is to show qualitative accuracy im-provements with respect to the use of a set of ten bidimen-sional MBFs, previously adopted and well suited for S-band dual-polarized data, but not for C-band dual-polarized data.
2 Hydrometeor radar scattering model
Tw2(T) Cw2(Zhh, Zdr)
Tw1(T) Cw1(Zhh, Zdr)
Zhh Zdr
T Tw0(T)
Cw0(Zhh, Zdr)
x MAX
0=LD 1=LR 2=MR 3=HR 4=H/R 5=H 6=G/SH 7=DS 8=WS 9=IC
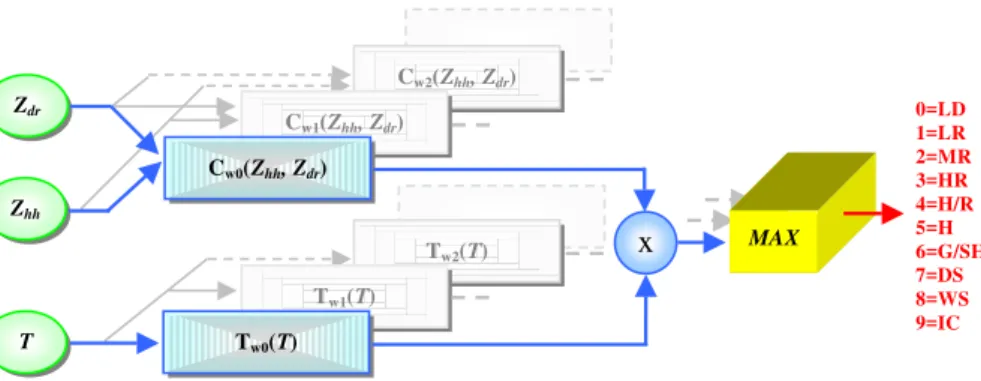
Fig. 1.Schematic flow diagram of the Fuzzy Radar Algorithm for Hydrometeor Classification at C-band (FRAHCC). The fuzzy logic scheme
for hydrometeor classification is illustrated with a reduced set of polarimetric radar observables (Zhh,Zdr)and temperature (T )as inputs.
The hydrometeor classes are defined in the text.
polarimetric signatures and their relation with hydrometeor properties (Vulpiani et al., 2005). T-Matrix method is also known as EBCM, Extended Boundary Condition Method, and it is the theoretical solution of the scattering problem for non spherical particles by means of the electromagnetic equivalence theorem (Mishchenko and Travis, 1998).
Horizontally-polarized reflectivity (factor)Zhhis defined as:
Zhh=
λ4
π5|K|2
∞ Z
0
σb,hh(D)N (D)dD=
λ4
π5|K|2 < σb,hh>(1)
being|K|2the dielectric factor (its value for water is about 0.93 from S-band to X-band), whereasDis the diameter and
N (D) represents the particle size distribution (PSD) for a specific hydrometeor. In (1)σb is the backscattering cross section, whereas the angle brackets stand for ensemble aver-aging overN (D). The differential reflectivityZdr and spe-cific differential phaseKdp are given by:
Zdr =10 log10
Z
hh
Zvv
=10 log10
σb,hh
σb,vv
!
(2)
Kdp=10−3 180
π λRe
∞ Z
0
N(D)[fhh(r, D)−fvv(r, D)]dD
(3)
where Zdr is here measured in dB,Kdp in deg/km, fhh,vv is the forward scattering amplitude at horizontal and vertical polarization, whereasDandλare here expressed in mm.
A correct physical and dielectric modelling of hydrome-teors is essential to obtain simulations of polarimetric radar measurements. Useful information about several hydrome-teor types can be found in Straka et al. (2000). Hydrom-eteor models together with environmental temperature in-formation are included in the model simulation. Tempera-ture is a fundamental variable in hydrometeor classification schemes: some classes can physically exist at certain tem-peratures, others can not. Possible temperature ranges for
ten different hydrometeor classes are derived from Zrni´c et al. (2001).
Scattering simulations have been carried out with tempera-ture randomly varying in intervals specified inside the code in order to have statistically significant simulated polarimetric signatures. Temperature for every radar bin is evaluated by means of a vertical radio-sounding profile realized in prox-imity of the storm. In absence of this kind of measure, a stan-dard temperature gradient can be assumed in an approximate way.
3 Fuzzy classification method for C-band data
Radar measurements are affected by thermal noise and power path-attenuation problems. At C-band path attenuation is relevant and cannot be neglected. Furthermore, data pro-vided by radar measurements or T-Matrix numerical simu-lations tend to overlap significantly on the plane ofZhhand
Zdr observations. All these aspects make fuzzy logic one of the best solutions for the hydrometeor classification problem (Bringi and Chandrasekar, 2001; Zrni´c et al., 2001). Use of simulated data also allows robustness tests to be performed, adding noise with increasing standard deviations to data; in this respect, fuzzy logic performs well and its behavior tends to be robust to noise.
Polarimetric radars have dual-polarization capabilities and can retrieve reflectivity and differential reflectivity signals: these observables together with temperature information are the three inputs to the fuzzy classification scheme, as illus-trated by Fig. 1 which describes the basics of FRAHCC ap-proach.
Table 1.Contingency table for evaluating the errors due to a fuzzy classification, designed at S-band and applied to C-band synthetic
data. OnlyZhh, Zdr andT are inputs to the classifier. Standard
errors are equal to 1 dBZ and 0.3 dB forZhhandZdr, respectively
(see text for details).
S I M U L A T I O N S-band FUZZY
(Zhh,Zdr,T) LD LR MR HR H/R H G/SH DS WS IC U A
LD 288 16 43 28 0 0 5 0 3 7 74%
LR 0 204 58 0 0 0 1 2 23 1 71%
MR 0 20 110 29 0 0 5 1 53 0 50%
HR 0 0 26 79 25 0 1 0 2 0 59%
H/R 0 0 0 0 174 62 3 0 0 0 73%
H 0 0 0 0 27 172 4 0 0 0 85%
G/SH 0 13 9 2 0 21 186 135 19 1 48%
DS 0 10 2 0 0 0 4 83 0 42 59%
WS 0 2 1 0 0 0 4 0 16 0 70%
IC 0 3 1 0 0 0 18 40 1 142 69%
P A 96% 68% 37% 26% 58% 57% 62% 28% 5% 47% OA=48%
C L
A S
S
I F I C A T
I
O N
N C 4% 11% 17% 54% 25% 15% 23% 13% 61% 36% NCAV =26%
H/R (hail/rain mixture), H (hail), G/SH (graupel/small hail), DS (dry snow), WS (wet snow), IC (ice crystals). The out-put of the MBFs are called membership degrees and can as-sume values ranging from 0 (no membership) to 1 (maximum membership). Definition of MBFs is a fundamental task that affects classification accuracy.
The starting point was a set of MBFs originally described by Straka et al. (2000), and it is usually referred as the fuzzy logic scheme developed at the NSSL polarimetric radars (Zrni´c et al., 2001). The scheme was designed for S-band data so that it cannot be applied in straightforward way to C-band radar data. The latter are usually more sensitive to shapes and present bigger values of differential reflectivity (Celano et al., 2005) and specific differential phase, with re-spect to S-band measurements. Resonance effects due to Mie scattering cannot be neglected at C-band and MBFs must be modified.
MBFs adopted in this work have trapezoidal forms, and analytical expressions have been derived by means of accu-rate observations of T-Matrix simulations at 5.6 GHz, typi-cal frequency of C-band radar systems. Most relevant dif-ferences between the two bands behaviors were found for LD, MR, HR and H/R classes. Linear fuzzy thicknesses can be different for each hydrometeor class. Temperature MBFs are trapezoidal functions, directly derived from Zrni´c et al. (2001). Analytical expressions for bidimensional MBFs related to C-band observablesZhhandZdr and for monodi-mensional MBFs related to environmental temperatureT are similar to those of Zrni´c et al. (2001).
The inference rule (IR) is based on the product of mem-bership degrees derived from MBFs, as it follows:
I Ri =Cwi(Zhh, Zdr)·Twi(T ), i=0,1, ...,9 (4)
Table 2. Contingency table for evaluating the errors due to a FRAHCC fuzzy classification, designed at C-band and applied to
C-band synthetic data. OnlyZH,ZdrandT are inputs to the
clas-sifier. Standard errors are equal to 1 dBZ and 0.3 dB forZhhand
Zdr, respectively (see text for details).
S I M U L A T I O N C-band FUZZY
(Zhh,Zdr,T) LD LR MR HR H/R H G/SH DS WS IC U A
LD 298 9 5 4 0 0 2 0 0 6 92%
LR 0 209 65 0 0 0 1 2 24 2 69%
MR 0 20 134 35 0 0 5 1 55 0 54%
HR 0 0 35 235 6 0 2 0 2 0 84%
H/R 0 0 0 3 246 52 4 0 0 0 81%
H 0 0 0 0 29 194 5 0 0 0 85%
G/SH 0 13 11 3 0 21 185 132 19 1 48%
DS 0 11 2 0 0 0 5 95 0 40 62%
WS 0 2 1 0 0 0 4 0 16 0 70%
IC 0 3 1 0 0 0 20 38 1 241 79%
P A 99% 70% 45% 78% 82% 65% 62% 32% 5% 80% OA=62%
C L
A S
S
I F I C A T
I
O N
N C 1% 11% 15% 7% 6% 11% 22% 11% 61% 3% NCAV =15%
where the combined Cwi and temperature Twi weighting MBFs properly defined. The choice of product instead of linear combination has the purpose to limit classification er-rors as far as possible: if, for a given class, one measurement is significantly out of range, the low value of corresponding MBF will definitely suppress the class (Baldini et al., 2004). Temperature MBFs are of primary importance because they take in account peculiar physical characteristics of hydrom-eteors. Maximum rule value finally gives the hydrometeor class index to which the radar bin is assigned. If two or more rules present the same maximum value, NC (not classified) label is assigned to the radar bin.
Contingency tables, also known as confusion matrices, are used to evaluate classification accuracy on either real or syn-thetic data (Lillesand and Kiefer, 1994). In our case “truth” data consist of 300 simulations ofZhhandZdr for each hy-drometeor class, with environmental temperature uniformly distributed inside specific intervals. Radar measurements have been simulated by adding gaussian noise to data, 1 dBZ standard deviation forZhhand 0.2 dB for Zdr. Classifica-tion results for C-band simulated radar data using previous S-band MBFs are reported in Table 1, while the contingency table for C-band data, when new MBFs C-band adapted are used within the FRAHCC scheme, is reported in Table 2. Ac-curacy improvements, measured in terms of overall acAc-curacy (OA) and average not classified bins percentage (NCAV), are absolutely evident.
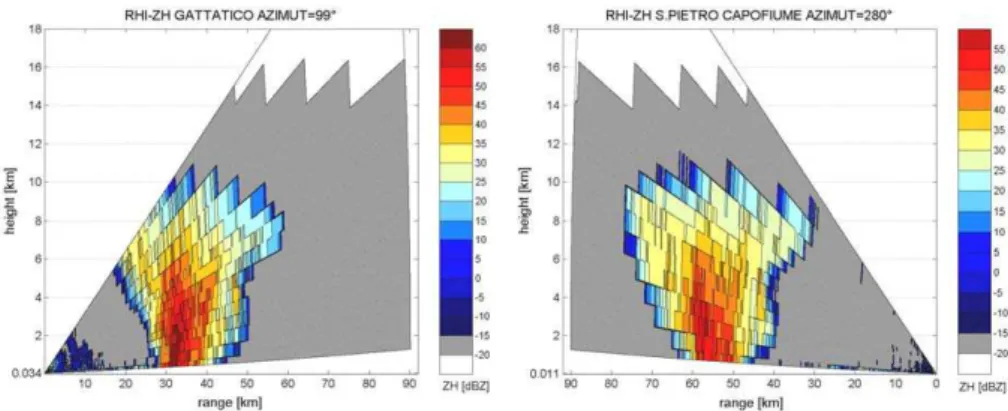
Fig. 2.Vertical section (Range Height Indicator: RHI) of copolar reflectivityZhhwith respect to the line of sight between the two C-band
radar systems in Italy on 19 May 2003 at 16:31. Gattatico (GAT) radar is on the left side and S. Pietro Capofiume (SPC) radar on the right side and the distance between the two is about 90 km.
4 C-band dual-polarized radar data
Available radar data refer to a convective episode occurred in the region between two dual-polarized C-band systems, both located in the Po valley and about 90 km apart: the S. Pietro Capofiume (SPC) and the Gattatico (GAT) radars, both man-aged by ARPA-SIM Emilia-Romagna (Alberoni et al., 2001). 4.1 Radar systems
These dual-polarization GPM-500C radar are placed on a tower with a Cassegrain parabolic antenna (without radome cover), providing a half-power beam-width of 1.0◦and a di-rectivity of about 45-dB. The klystron peak-power is 250 kW at 5.6 GHz with an alternating horizontal-vertical polariza-tion transmission and dual pulse repetipolariza-tion frequency (PRF) system for unfolding capability. Pulse widths are of 0.5 ms (i.e., short pulse with a resampled bin resolution of 250 m) and 1.5 ms (i.e., long pulse with a resampled bin resolution of 1500 m). The receiver sensitivity is equal to−113 dBm. The typically used maximum range is 250 km (with long pulse) and 125 km (with short pulse) for the intensity and velocity mode, respectively. A self-contained software is used to re-motely operate and archive radar data of measuredZhhand
Zdr, beingKdpnot available as output.
Radar data are acquired with a prescribed scanning strat-egy during operational activity, consisting of 15 elevations with an angular spacing of 1◦. Radial spatial resolution is set
to 250 m for short ranges (i.e., 125 km) and to 1000 km for long range (i.e., 250 km) scans, the latter being carried out only twice per hour. Time sampling of radar volume data is such that there are 4 acquisitions per hour (i.e., every 15 min), the dual-polarized one being performed only twice per hour. Procedures to correct for gas absorption, to remove ground-clutter echoes and to identify anomalous propagation condi-tions are routinely applied (Alberoni et al., 2001). Side-lobe effects at short ranges (less than 20 km) for low elevations are avoided by choosing higher elevations not affected by this disturbance.
4.2 Case study
During the night between the 19 and 20 May 2003 a cold front, arriving from North-West and moving across the Alps, caused a deep convective event in the flat lands of North-East Italy.
The reference line connecting the two radar systems was interested by the hailstorm and the storm core, characterized by high values of reflectivity (50–60 dBZ), was at about 55– 60 km from SPC and 30–35 km from GAT. Reflectivity verti-cal sections, with respect to the connection line, are reported in Fig. 2. Sections refer to data acquired on 19 May 2003 at 16:31. The distance between the two radars is about 90 km and, close to the SPC site, a radiosounding station is op-erated. The latter is used for inferring the thermodynamic structure of the observed atmosphere.
Figure 2 displays the range-height-indicator (RHI) of the reflectivity Zhh for GAT and SPC radars on the reference line, namely the line connecting the position of the two radars. The core of the storm, characterized by high values ofZhh(50–60 dBZ), is located at about 55–60 km from SPC and about 30–35 km from GAT radar. FromZdr maps (not shown for brevity) it is possible to note the different attenu-ations zones in the two regions behind the convective core, depending on the different viewing of the radars. The atten-uation signature is clearly highlighted by analyzing the first elevation rays ofZhhandZdrfrom each radar along the ref-erence line connecting the two radars. No attempt to correct for path attenuation has been carried out in this work, even though the bistatic radar view may be exploited to this aim.
5 Hydrometeor classification at C-band
IC
WS
DS
G/SH
H
H/R
HR
MR
LR
LD
NC
IC
WS
DS
G/SH
H
H/R
HR
MR
LR
LD
NC
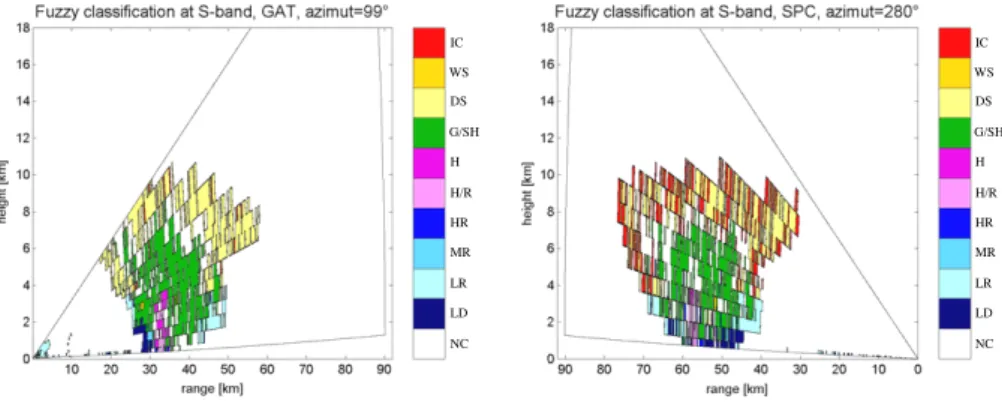
Fig. 3.Fuzzy-logic classifications using S-band membership functions (MBFs) applied to C-band radar data, displayed in Fig. 2 along the line of sight between the two radar systems.
IC
WS
DS
G/SH
H
H/R
HR
MR
LR
LD
NC
IC
WS
DS
G/SH
H
H/R
HR
MR
LR
LD
NC
Fig. 4.Fuzzy-logic classification, using FRAHCC algorithm with proper C-band MBFs and applied to C-band radar data, displayed in Fig. 2 along the line of sight between the two radar systems.
Since truth data regarding the storm on the connection line are not available, only qualitative tests can be carried out. Classification results obtained by conventional S-band de-signed MBFs are shown in Fig. 3, while results obtained by new C-band adapted MBFs (i.e., FRAHCC) are reported in Fig. 4.
Accuracy improvements can be recognized by direct ob-servations of the RHI diagrams, first with S-band MBFs and then with C-band MBFs: number of not classified (NC, white) radar bins considerably decreases, especially for GAT radar measurements, and ice crystals detection (IC, red) is now performed in a more realistic way. Classification results are also physically self-consistent: the hail core (H and H/R, pink and violet) is correctly detected at the centre of the con-vective storm, graupel (G/SH, green) is reasonably identified all around the hail core, rain is present only at low altitude (different shades of blue) while snow and ice crystals (DS, WS, IC, from yellow to red) are properly found at the top of the storm.
As noted, better results could be obtained withKdp mea-surements and with attenuation correction techniques applied to the measured reflectivity signals. A composite maximum-reflectivity approach (i.e., using co-locating maximum-reflectivity data and choosing the maximum value) could be used to correct the whole vertical section radar data for path attenuation ef-fects (Celano et al., 2005).
6 Conclusions
Backscattering radar simulations confirm the presence of noteworthy behavioral differences between S-band and C-band data. At C-C-band Mie-scattering resonance effects can-not be neglected and the consequence is a major sensitivity to shapes and orientations, with respect to S-band signals. Us-ing S-band MBFs to classify C-band simulated data naturally induces a poor classification accuracy. Appropriate C-band modified MBFs, constituting the basics of the FRAHCC ap-proach, must be defined and, when applied to available data, they seem to perform reasonably well. Making changes is not straightforward: it requires a solid experience and accu-rate observations of hydrometeor polarimetric signatures on
Zhh−Zdrplane, derived from T-Matrix simulations, must be performed in order to modify the internal contour lines of the trapezoidal functions. New C-band MBFs have been tested on simulated radar measurements, obtained adding Gaussian noise to simulated data: overall accuracy considerably in-creases and average not classified bins percentage dein-creases as well.
and with the new modified system: accuracy improvements are directly visible, the hail core is correctly detected and the classification results are physically reasonable. Future work shall be devoted to the improvement of classification accu-racy with the use ofKdpmeasurements, still not available on GPM-500C systems, and to the devise of a path-attenuation correction algorithm applied to the entire vertical section of the precipitating cloud. Preliminary results given by the hy-brid fuzzy logic technique withKdpsimulated measurements are quite promising and the bistatic radar configuration can be surely exploited to this aim.
Acknowledgements. This work has been funded by Civil Protec-tion Directorate of Region Abruzzo, Italy, and by RISK-AWARE project within INTERREG-IIIB CADSES framework.
Edited by: V. Kotroni and K. Lagouvardos Reviewed by: anonymous referee
References
Alberoni, P. P, Andersson, T., Mezzasalma, P., Michelson, D. B, and Nanni, S.: Use of the vertical reflectivity profile for identification of anomalous propagation, Meteorol. Appl., 8, 257–266, 2001. Alberoni, P. P., Zrni´c, D. S., Ryzhkov, A. V., and Guerrieri, L.: Use
of a fuzzy logic classification scheme with a C-band polarimetric radar: first results, Proceedings of ERAD, pp. 324–327, 2002. Baldini, L., Gorgucci, E., and Chandrasekar, V.: Hydrometeor
clas-sification methodology for C-band polarimetric radars, Proceed-ings of ERAD, pp. 62–66, 2004.
Barber, P. W. and Yeh, C.: Scattering of electromagnetic waves by arbitrarily shaped dielctric bodies, Appl. Opt., 14, 12, 2864– 2872, 1975.
Bringi, V. N. and Chandrasekar, V.: Polarimetric Doppler weather radar, Cambridge University Press, 2001.
Celano, M., Alberoni, P. P., Levizzani, V., and Holt, A. R.: Analysis of severe convective event from two operational dual polarisation doppler radars, EGU General Assembly, 24–29 April, no. 671, 2005.
Galletti, M., Alberoni, P. P., Levizzani, V., and Celano, M.: Assess-ment and tuning of the behaviour of a microphysical characteri-sation scheme, Adv. Geosci., 2, 145–150, 2005.
Keenan, T. D.: Hydrometeor classification with a C-band polari-metric radar, Australian Meteorological Magazine, 52, 1, 23–31, 2003.
Lillesand, T. M. and Kiefer, R. W.: Remote sensing and image in-terpretation, 3rd Edition, John Wiley & Sons. Inc., 1994. Lim, S., Chandrasekar, V., and Bringi, V. N.: Hydrometeor
clas-sification system using dual-polarization radar measurements: model improvements and in situ verification, 43, 4, 792–801, 2005.
Mendel, J. M.: Fuzzy logic systems for engineering: a tutorial, Pro-ceedings of the IEEE, 83, 345–377, 1995.
Mishchenko, M. I. and Travis, L. D.: Capabilities and limitations of a current Fortran implementation of the T-Matrix method for randomly oriented, rotationally symmetric scatterers, Journal of Quantitative Spectroscopy and Radiative Transfer, 60, 3, 309– 324, 1998.
Straka, J. M., Zrni´c, D. S., and Ryzhkov, A. V.: Bulk hydrom-eteor classification and quantification using polarimetric radar data: synthesis of relations, J. Appl. Meteorol., 39, 8, 1341– 1372, 2000.
Vivekanandan, J., Zrni´c, D. S., Ellis, S. M., Oye, R., Ryzhkov, A. V., and Straka, J.: Cloud microphysics retrieval using S-band dual-polarization radar measurements, Bull. Amer. Meteorol. Soc., 80, 3, 381–388, 1999.
Vulpiani, G., Marzano, F. S., Chandrasekar, V., and Lim, S.: Con-strained Iterative Technique with Embedded Neural-Network for Dual-Polarization Radar Correction of Rain Path Attenuation, IEEE Trans. Geosci. Rem. Sensing, 43, 2305–2314, 2005. Zrni´c, D. S., Ryzhkov, A. V., Straka, J., Liu, Y., and Vivekanandan,