ASSESSMENT OF CERAMIC TILE FROST RESISTANCE
BY MEANS OF THE FREQUENCY INSPECTION METHOD
IVETA PLŠKOVÁ, ZDENĚK CHOBOLA, MICHAL MATYSÍK Physics Department, Faculty of Civil Engineering, Brno University of Technology,
Veveří 95, 602 00 Brno, Czech Republic
E-mail: [email protected]
Submitted October 13, 2010; accepted May 5, 2011
Keywords: Frequency inspection, Ceramic tiles, Frost resistance
The paper presents some results of our experimental analysis of ceramic cladding element frost resistance, particular attention being paid to the application of the frequency inspection method. Three different sets of ceramic tiles of the Ia class to EN 14 411 B standard made by various manufacturers have been analyzed. The ceramic tiles under investigation have been subjected to freeze-thaw-cycle-based degradation in compliance with the relevant ČSN EN ISO 10545-12 standard. Furthermore, accelerated degradation procedure has been applied to selected test specimens, consisting in reducing the temperature of water soaked ceramic tiles in the course of the degradation cycles down –70°C. To verify the correctness of the frequency inspection results, additional physical properties of the ceramic tiles under test have been measured, such as, the ceramic tile strength limit, modulus of elasticity and modulus of deformability, resulting from the lexural tensile strength tests, integrity defect and surface micro-geometry tracking. It has been proved that the acoustic method of frequency inspection is a sensitive indicator of the structure condition and can be applied to the ceramic cladding element frost resistance and service life prediction assessment.
INTRODUCTION
It is the task of the non-destructive testing to ind out whether a building element, product or device in question shows or does not show a defect in terms of a deviation from the standard and, if such a defect does occur, to determine its nature and locate it [1]. The defect detection, identiication and location are constituents of the diagnosis of the object technical condition [2]. The non-destructive testing methods make it possible to timely identify the occurrence and development of defects in materials and thus ward off the failure or even the breakdown of structural units consisting of mechanically or thermally stressed, or corrosion affected parts [3, 4]. The frequency inspection (impact-echo) method belongs to the family of non-destructive testing methods and can be applied in many branches, among others also in civil engineering [5, 6,]. To assess the ceramic tile frost resistance, a new measurement method has been designed which is based on using the acoustic properties of the tiles [7].
The frost resistance of a ceramic product is its capa-city to withstand, under speciied conditions, a certain number of freeze-thaw cycles without any induced
defects in the glaze or the body. Whether the material is on duty inside (for example, in refrigerating or freezing plants) or outdoors (rain, snow, ice), it is always exposed to the joint action of frost and water. Water penetrates into the pores to freeze in them. During this transition from the liquid to the solid phase, its volume grows up, resulting in a mechanical stress in the pores, which gives rise to and affects the tension and deformation distribution. Material integrity defects, such as crevices, cracks, pitting, etc., may occur consequently. The frost may also give rise to the material spalling.
EXPERIMENTAL
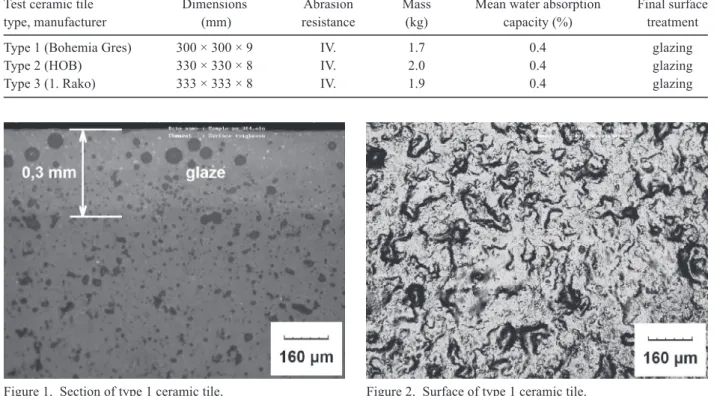
Three different sets of sintered ceramic glazed lining elements, featuring a water absorption capacity of below 0.5 %, denoted B Ia according the EN 14411 [8] standard have been analyzed. Each set consisted of 20 tiles.Table 1 shows basic parameters of the ceramic tiles which have been selected for testing. Figures 1 and 2 show the optical microscope photographs. Figure 1 presents a section of type 1 ceramic tile in 200-fold magniication. The internal structure of the body coated with a glaze of a thickness of about 0.33 mm, is apparent in the Figure. Figure 2 illustrates the surface relief for type 1 ceramic tile in 200-fold magniication. It is a sintered body featuring a high vitreous phase portion.
The ceramic tiles under investigation have been subjected to freeze-thaw-cycle-based degradation in compliance with the relevant ČSN EN ISO 10545-12 standard - Ceramic tiles - Part 12: Determination of frost resistance [9].
After having been saturated with water, the lining elements were exposed to alternating temperatures of +5°C and -5°C. The lining elements were exposed to the omni-directional action of the freeze and thaw stress treatment in a total of 300 cycles. The ceramic tile quality was assessed after the completion of 50, 100, 150, 200 and 300 freeze-thaw cycles. Both visual and frequency-inspection based analyses of the specimens were carried out.
Selected ceramic tiles were subjected to additional degradation stressing.Water soaked ceramic tiles were deposited in a Dewar vessel to be kept there at a
tem-perature of -70°C for 10 minutes. Liquid nitrogen vapours were employed to produce the low temperature. A total of ive degradation cycles were carried out. The frequency inspection parameters were measured both prior to each temperature stressing cycles and after each degradation cycles.
The frequency inspection method makes it possible to detect cracks also in heterogenous materials. A short-time mechanical impulse is applied to the specimen under test. This impulse propagates throughout the specimen in the form of transversal and longitudinal spherical waves. It propagates from point of its origin in the form of a surface wave, too. The transversal and longitudinal waves are relected on the internal interface (with cracks and defects) or on an external boundary [10]. The response signal therefore carries information of the existence of structural defects. If the test specimen is damaged, energy is dissipated on the defect boundaries. This is relected in an increased signal attenuation and waveform distortion [11]. The frost-induced damage of the tiles can be assessed on the basis of the signal attenuation and the signiicant resonance frequency shift. In our experiments, the response signal was picked up by means of Sedlak type piezoelectric sensors. The sensor output was fed into the input of a Yokogawa DL1540CL four-channel, eight-bit digital oscilloscope with a GPIB interface [12]. The sampling frequency was 150 MHz. Special software, which had been developed for this type of measurement, was used to further process the signal [13]. When locating the sensors on the measured object, the measured body’s geometry and acoustic signal attenuation are taken into
Table 1. Ceramic tiles tested.
Test ceramic tile Dimensions Abrasion Mass Mean water absorption Final surface
type, manufacturer (mm) resistance (kg) capacity (%) treatment
Type 1 (Bohemia Gres) 300 × 300 × 9 IV. 1.7 0.4 glazing
Type 2 (HOB) 330 × 330 × 8 IV. 2.0 0.4 glazing
Type 3 (1. Rako) 333 × 333 × 8 IV. 1.9 0.4 glazing
account. To ensure a good acoustic transmission, a layer of a suitable medium (such as parafin jelly, wax, etc.) is laid on between the sensor and the specimen under test. The sensor output signals are ampliied, iltered and saved [14]. What follows is the analysis of thus recorded signals using the a mathematical analysis method called Fourier transform which decomposes the signals into sine waves of various frequencies and transforms the signal from the time domain into the frequency domain. We are looking for predominant frequencies in the Fourier spectrum and, particularly, their variations, i.e., their shift towards lower or higher frequencies in each of the load test stages. Furthermore, it is the coeficient of attenuation, λ, characterizing the exponential drop in the [15] signal amplitudes (see our papers). The method can be successfully applied to the location of cavities, delaminations, the determination of the depth of open cracks in the surface and measurement of structure thickness.
Another important parameter of the ceramic tiles is the modulus of elasticity expressing the capacity of the material in question to undergo elastic or viscous deformations under the inluence of external load. Materials, which have a high modulus of elasticity, feature low deformations, however, heavy tensions are generated in them even by low deformations. It was the objective of our experiments to determine the modulus of elasticity and deformability for the ceramic tiles. The measurements were carried out on intact specimens as well as on specimens that had undergone 150 and 300 freeze-thaw cycles. The test procedure was carried out in compliance with ČSN 73 6174 standard [16].
To determine the strength, the elasticity and deformability moduli of the ceramic tiles on the basis of lexural tensile stress tests, a HACKERT/FPZ/100/1 pressing machine was employed. The delections of each specimen were measured by digital indicators to 0.001 mm (Figure 3).
Olympus LEXT 3100 laser-type confocal scanning microscope was used to study the surface micro-geometry and integrity defects. The microscope uses the
Ar laser blue-green spectral line of the wavelength λ = 488 nm, which makes it possible to attain a very high precision 3D imaging and measurement. The microscope resolution power: supericial, 120 nm; sectional, 40 nm.
RESULTS AND DISCUSSION
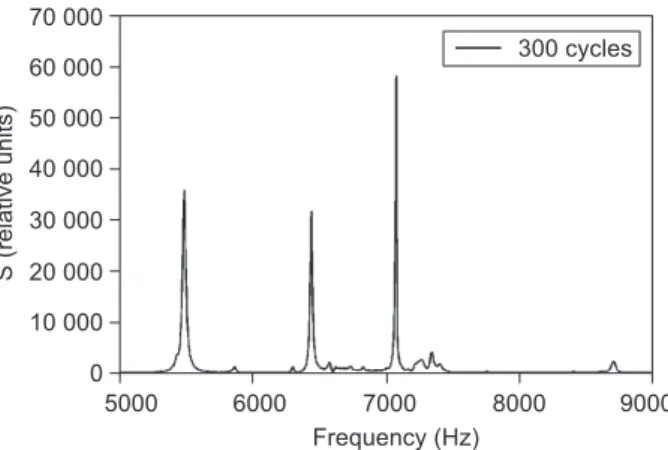
Figure 4 shows the spectral density versus frequency plot (thereinafter, the spectral characteristic, or, the frequency spectrum) for type 1, No 305 test tile prior to the temperature stressing start. A spectral component of a frequency of 6.4 kHz is dominating the plot. Figu- re 5 shows the frequency spectrum of the same specimen, however, after having been exposed to 300 freeze-thaw cycles. A shift of the predominant frequency to 7.1 kHz (11-percent increase) is apparent in the diagram. Two marked frequency components appear in the frequency spectrum now. Their frequencies are f2= 5.6 kHz and f3 = 6.4 kHz. Fig. 6 shows the response of specimen
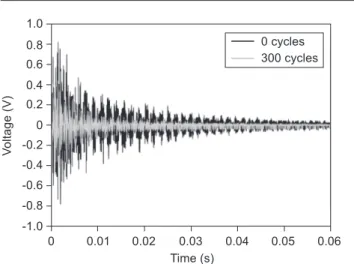
No. 305, which is a type 1 tile, prior to and after 300 freeze-thaw cycles. After the total number of freeze-thaw cycles had been completed, the response signal appeared to have undergone a heavy change, its original duration
t1= 42 ms being reduced to t3= 28 ms. The attenuation
coeficient grew from its original value, λ1 = 79 s-1
to λ3= 102 s-1, i.e. by 29 %.
Figures 7 through 9 show the dominant frequency occurrence regions and mean values versus the number of freeze-thaw cycles applied. Mean values of complete sets of 20 specimens are presented here for each of the tile types (Figure 7: type 1 tiles, Figure 8: type 2 tiles, Figure 9: type 3 tiles).
As is seen in these igures, the frequency analysis characterizes the degradation process taking place in the ceramic tiles. Contrary to large changes which we had observed formerly in other building elements, for example, rooing tiles [15], the presently investigated tiles showed relatively small parameter variations. It may be stated, therefore, that all of these tiles are of a very good quality.
To conirm the conclusiveness of the frequency inspection method as an assessment tool for the ceramic tile frost resistance, we carried out accelerated degradation tests, where water-soaked tiles were deep-frozen down to -70°C.
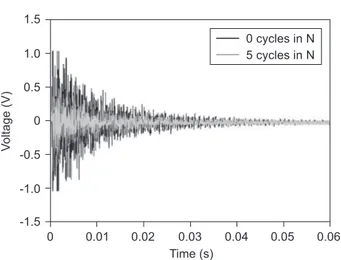
Figure 10 shows the time response of type 2 ceramic tile, specimen No 2, prior to and after 5 accelerated degradation cycles, where the temperature dropped as low as -70°C. A signal shortening from t1 = 36 ms to t5
= 27 ms and an attenuation coeficient growth from λ1 =
107 s1 to λ
3 = 146 s-1, i.e., by 36 % can be observed.
In the frequency spectrum (Figure 11), dominant frequency shifts occurring in the course of 5 accelerated degradation cycles with the temperature going down as low as -70°C, are apparent. The initial dominant frequency characterizing an intact tile (0N) equalled
f1= 6.6 kHz to grow up to f1 = 9.1 kHz, i.e., by 38 %, after
5 accelerated degradation cycles (5N) had been applied. Mean values of the dominant frequencies and the corresponding variation coeficients for the different accelerated degradation stages for all type 2 tiles are shown in Figure 12. It is evident that considerable changes in the dominant frequencies took place in these tiles during 5 accelerated cycles, in which water-soaked tiles were cooled down to -70°C.
Figure 6. Time response record for type 1 tile No. 305, prior to and after 300 freeze-thaw cycles.
Figure 8. Dominant frequency occurrence regions and mean values, ⊕ versus the number of freeze-thaw cycles for type 2 tiles.
Figure 9. Dominant frequency occurrence regions and mean values, ⊕ versus the number of freeze-thaw cycles for type 3 tiles.
The reader is referred to Figure 2, where an intact surface of type 2, No 41 tile prior to the accelerated degradation, as magniied by LEXT 3100 microscope, is shown. It is a sintered body featuring a high vitreous phase portion.
A small number of ine crack clusters (5 to 8 cracks in each cluster) of a thickness of 0.5 μm to 1.5 μm and a length of 200 μm to 780 μm was observed after the irst accelerated degradation cycle by means of freezing water-soaked tiles down to -70°C, Figure 13, had been applied to this tile. The crack depth ranged from 0.4 μm to 0.5 μm.
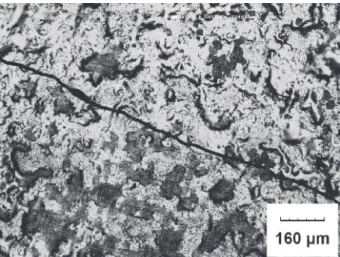
Figure 14 illustrates the condition of the surface of type 2, No 41 tile after three accelerated degradation cycle application. In this case, a higher number of cracks (10 to 15 in each tile) of a thickness ranging from 5 μm to 15 μm and a length of 1000 μm to 2000 μm was observed. The crack depth ranged from 20 μm to 30 μm. Figure 15 shows the surface of type 2, No 41 tile after the application of 5 accelerated degradation cycles. Here, a still higher number of cracks (20 to 30 in each tile) of a thickness ranging from 30 μm to 60 μm and a length of 1000 μm to 5000 μm was observed.
Figure 16 illustrates the surface relief of type 2 No. 41 specimen, after the application of 5 accelerated degradation cycles. The crack depth of 150 μm to 300 μm is apparent, too.
To verify the correctness of the frequency inspection results, the ceramic tile strength limit, the modulus of elasticity and the modulus of deformability, were measured by means of the lexural tensile strength test.
The test method was identical with that described in ČSN 73 6174 [16] and ČSN ISO 4013 standards [18] for the testing of concrete. On a longitudinal section of the ceramic tile, the lexural tensile strength Rtfwas measured,
for which it holds Rtf = M/wd, where M is the maximum
bending moment in N.m, wd is the section modulus with
respect to the bottom ibre at the disturbance point (the unit = mm3). The load was applied to the specimen via hard rubber bands. Two identical weights were applied at the 1st and 2nd thirds of the specimen span L. The maximum bending moment is calculated from the formula
where F is the applied force [N], L is the distance between the support points [mm] (in this case, 200 mm).
The determination of the moduli of elasticity, E, and deformability, E0, was carried out in compliance with
ČSN 73 6174 standard [16,17], the calculations being based on the specimen delection measured. A digital delection indicator, measuring to 0.001 mm, was used in these measurements.
The type 1/type 2 ceramic tiles featured the re-spective mean tensile strengths of 35 MPa / 28 MPa prior to the degradation tests. The mean tensile strength of type 1 / type 2 tiles dropped to 32 MPa / 27 MPa (about Figure 10. Time response for type 2 No 41 specimen prior to
(0N) and after (5N) 5 accelerated degradation cycles.
Figure 11. Shift of the dominant frequencies in type 2, No 41 specimen, in the course of 5 accelerated degradation tests with the temperature dropping down to - 70°C (0N - prior to, 5N - after ive cycles).
92 % / 95 % of the initial value), respectively, after the completion of 150 freeze-thaw cycles. The above-mentioned tensile strength further dropped to 31 MPa / 25 MPa (87 % / 85 % of the intact specimen strength value), respectively, after the application of 300 freeze-thaw cycles (Figure 17).
Similarly to the tensile strength values, the moduli of elasticity E and deformability Eo dropped likewise
after the application of the freeze-thaw cycles.
For example, the modulus of elasticity E of type 1 ceramic tiles dropped from 59500 MPa to 53000 MPa and the modulus of deformability, Eo from 58000 MPa
to 52500 MPa (Figure 18).
Figure 13. A ine crack which appeared after a single accele-rated stress cycle.
Figure 15. The crack after ive accelerated stress cycles. Figure 14. The same crack after three accelerated stress cycles.
Figure 16. The crack relief for No. 41 tile after 5 accelerated degradation cycles.
Figure 17. Cyclic-stressing induced strength variations for ceramic tiles.
If we consider the degradation factor D = (1-E/ /E1) [18,19], where E1 is the initial value of modulus of elasticity and E values after application of freeze-thaw cycles, we can determine for example for specimen No. 1 after 300 cycles value D = 0.11 .
CONCLUSIONS
The present paper deals with the application potential of the frequency inspection method to the assessment and service life prediction for ceramic lining elements and presents the respective results. Three sets containing 20 ceramic tiles each, produced by three different manufacturers, have been tested.
The ceramic tiles were subjected to degradation tests consisting in 300 freeze-thaw cycles within the temperature interval from -5oC to 5oC and the degradation-test-induced variations in their properties were tracked. An upward shift of the dominant frequencies, namely, by 8% to 31% (depending on the tile type), as well as a progressive growth of the attenuation coeficient by 23% to 28% (depending on the tile type) were observed.
To emphasize the stress-induced changes, 5 tiles were subjected to the accelerated degradation tests, in which water-soaked ceramic tiles were frozen down to -70 degrees centigrade. In this case, we observed appreciable dominant frequency upward shifts, namely, by 38%, as well as a heavy growth of the attenuation coeficient (by 36%).
Accelerated-degradation-induced gradual genera-tion and growth in number of cracks was observed by means of a confocal microscope. As many as 20 to 30 new cracks were observed in the surface of a single tile after 5 accelerated degradation cycles. The crack thickness reached 80 μm to 320 μm, the length, 1000 μm to 5000 μm and their depth ranges from 160 μm to 240 μm.
To verify the correctness of the frequency inspection results, we measured the ceramic tile strength limit, modulus of elasticity and modulus of deformability, resulting from the lexural tensile strength tests. During the degradation tests consisting in 300 freeze-thaw cycles the strength limit, the elasticity modulus and the deformability modulus dropped by 14%, 11% and 10%, respectively.
The strong correlation between the variations in the classical parameters, such as, the strength limit, the elasticity and deformability moduli, and the dominant frequency upward shifts as well as the attenuation coeficient growth are showing convincingly the frequency inspection method to be a convenient tool for assessing the ceramic tile quality and service life.
Based on the test results, we are justiied to state that all of the three tile types, coming from three different manufacturers, feature a very high quality and, predictably, a very good service life. The frequency
inspection method can also be recommended as a continuous screening tool for ceramic tile automated production lines.
Acknowledgement
This research is supported by Czech Science Foundation - project GP103/09/P247 and by project SV FAST - 1083.
References
1. Limaye H. S., Krause R. J.: Materials Evaluation 49, 1312 (1991).
2. Kopec B., et al.: Non-destructive testing of materials and structures, 1st ed., CERM, Brno 2008.
3. Liang MT., Su PJ.: Cement and Concrete Research 31, 1427 (2001).
4. Epasto G., Proverbio E., Venturi V.: Materials and Structures 43, 235 (2010).
5. Krause M., Barmann M., Frielinghaus R., et al.: NDT & E International 30, 195 (1997).
6. Wang J.J., Chang T.P., Chen B.T., Lin H.C., Wang H.: Journal of Nondestructive Evaluation 29, 111 (2010). 7. Plskova I., Chobola Z., Matysik M., Martinek J. in: EWGAE
2008 - Proceedings of the 28th European Conference on Acoustic Emission Testing, p. 322-327, Ed. Kanji Ono, European Working Group on Acoustic Emission and Cracow University of Technology, Cracow 2008.
8. ČSN EN 14411. Ceramic tiles - Deinitions, classiication, characteristics and marking, 1st ed., Úřad pro technickou normalizaci, metrologii a státní zkušebnictví, Praha, 2007. 9. ČSN EN ISO 10545-12. Ceramic tiles - Part 12:
Deter-mination of frost resistance, 1st ed., Úřad pro technickou normalizaci, metrologii a státní zkušebnictví, Praha, 1998. 10. Plskova I., Matysik M., Chobola Z. in: Proceedings The
10th International Conference of the Slovenian Society for Non-destructive Testing, p. 333-340, Ed. Grum J, Slovenian Society for NDT, Ljubljana 2009.
11. Cam E., Orhan S., Luy M.: NDT & E International 38, 368 (2005).
12. Lunak M., Kusak I. in: Defektoskopie 2009 - NDE for Safety, p. 269-274, Ed. Mazal P., BETIS, Praha 2009. 13. Martinek J. in: Physical and material engineering, p.121,
Ed. Palackova A., Slovak university of technology, Bratislava 2006.
14. Pazdera L., Smutny J., Topolar L., Korenska M., Bilek V.: NDT Welding Bulletin (special issue), 18 (2010).
15. Korenska M., Chobola Z., Sokolar R., Mikulkova P., Martinek J.: Ceramics-Silikáty 50, 185 (2006).
16. ČSN 73 6174. Determination of the modulus of elesticity and modulus of deformation by testing concrete for lexural strength, 1st ed., Úřad pro technickou normalizaci, metrologii a státní zkušebnictví, Praha, 1994.
17. ČSN ISO 4013. Concrete. Determination of lexural strength of test specimens, 1st ed., Úřad pro technickou normalizaci, metrologii a státní zkušebnictví, Praha, 1994. 18. Van Den Abeele K.E-A., Sutin A., Carmeliet J., Johnson
P.A.: in: NDT&E International 34, 239 (2001).