SENSITIVITY ANALYSIS ON PM TRAFFIC EMISSION MODELING PARAMETERS J. Garcia1, R. Cerdeira1, N. Tavares1, L. M. R. Coelho1, M.G.Carvalho2
1
Escola Superior de Tecnologia de Setúbal, Instituto Politécnico de Setúbal, Setúbal, Portugal 2
Instituto Superior Técnico, Lisboa, Portugal 3
Member of the European Parliament, Brussels, Belgium
Abstract: Particulate Matter (PM) street concentration is one major issue in urban air quality and are closely related to emissions from urban traffic. As so, the correct knowledge of road traffic emissions is a matter of major importance in urban planning and mobility strategies. This aspect had taken even more importance, with the implementation of Euro 5 and Euro 6 European Emission Standards. Urban traffic emission values can be achieved by measurement and by modelling techniques. In the past, some models have been proposed, considering not only exhaust pipe emissions from traffic but also non-exhaust pipe emissions like break-wear, tire wear, and re-suspension of loose material on the road. Exhaust traffic emission depends on the type of vehicle, velocity, engine technology (manufactory year and maintenance state). By other hand the non-exhaust pipe emission are strongly dependent on the abrasion and re-suspension processes and also on the brake-wire technology, type and condition of the tires and corrosion. In this article a sensitivity analysis of the modelling parameters used in estimation of PM10 emission sources from traffic is made in a city of Portugal. The parameters considered in this study were the type of vehicle, number of vehicles from each class, year emission, type of road and velocity. Results show that Diesel vehicles have a greater contribution of exhaust pipe while gasoline vehicles show a significant contribution from brakes and tires. Brakes are the main PM10 emissions (51%) on LDV vehicles. For LDDV vehicles, HDDV and buses, exhaust pipe emissions are the main emissions, being 80% for LDDV, 87% for HDDV and 93% for buses. For motorcycles exhaust pipe emissions represents 55% of total followed by break emissions (34%) and tire emissions (11%).
Key words: particle emissions, traffic sources, non-exhaust pipe emissions
INTRODUCTION
Air quality has received special attention as a result of the adverse impacts on the environment and in public health. Due to these critical effects a strict legislation has been considering the protection of human health and nature (Decreto-Lei n.º 102/2010). In fact the European Commission has already launched some lawsuits against Portugal due to the exceed of particulate matter limits in outdoor air, which could force the country to pay significant rates (IP/09/174, 2009). It is known that airborne particulate matter sources can be natural or anthropogenic. Natural sources includes fires, desert sand, erosion, marine salt, etc. and anthropogenic sources are caused by human activities, such as industries and traffic. Primary particles are emitted directly to the atmosphere and secondary particles are formed as a result of chemical reactions. Internal combustion engines such as motor vehicles are a major source of particle emission. A study comparing nine possible sources of particles in Tokyo, namely, local and continental soil, road dust, fuel oil and coal plants, incinerators, industries, brakes and exhaust emissions of cars, found that diesel vehicles are the biggest contributors (about 70%) for particle emission in urban area (A. Iijima, 2008). Particle emissions from vehicles occur mainly from exhaust pipe, from brakes, tires and through re-suspension of particles on the road. The class of vehicle and the type of fuel used also influences the concentration of this pollutant, being heavy duty vehicles a big contributor due to weight and greater area of tires, releasing particles from tires and through re-suspension. Diesel vehicles are also an important source due to incomplete combustion and to the composition of the fuel itself (Garcia et al, 2007). The aim of the present work was to study the influence of exhaust and non-exhausts particle matter emissions from vehicles of different classes in the main streets of a small city of Portugal.
METHOD
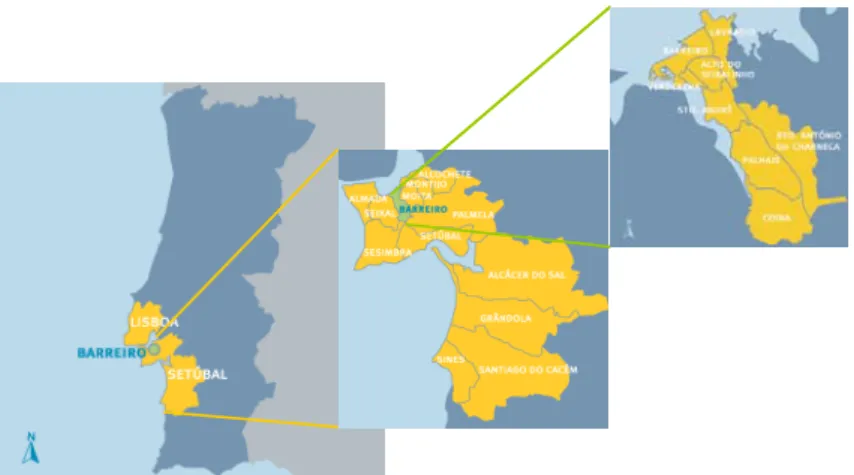
This study of exhaust and non-exhaust PM10 emissions from traffic was performed in Barreiro, a Portuguese city, with approximately 80,000 inhabitants distributed over 34km2. The city is near Lisbon, on Tagus River south margin (Figure 1).
Figure 1: Barreiro city location (source: Barreiro council)
A field campaign for the characterization of road traffic pollutant emissions was carried out in the main streets of Barreiro city, during five days, in the spring. The purpose of this campaign was to account the number of vehicles and categorize them in classes. At the same time PM10 was measured in order to study the influence of traffic flow and road characteristics in PM10 total concentration. The vehicle counting was made according to four classes - light-duty vehicles (LDV), heavy-duty diesel vehicles (HDDV), buses (Bus) and motorcycles (MC), in the rush hour (8:00-9:00am, 9:00-10:00am, 5:00-6:00pm and 6:00-7:00pm) for most congested streets and out of the rush hour for streets where traffic is approximately constant all over the day. PM10 measurement was made with an equipment that determines particle concentration in the ambient air using Beta radiation. In this study PM measurements were carried out for 1h periods, while the vehicles were being counted. Meteorological data such as temperature, humidity and wind speed were also monitored. Figure 2 illustrates how vehicles count was made in roundabout and crossroads.
Figure 2. Crossroads and roundabound counting method
Countings were aggregated according to the driving direction in each studied street. Figure 3 shows the streets considered in this study.
The majority of the studied streets are asphalted, with two-ways and buildings on both sides. The speed limit is 50km/h. The road from 1 to 3 is an expressway with two asphalted ways and two-lanes each. The speed limit is 100km/h and there’s just a few buildings along the street. Every crossroads considered have traffic lights. As known vehicle emissions of PM10 are the result of many processes, such as combustion products from fuel and oil (exhaust pipe emissions), products from the brake lining (brakes), tires, bearings, car body and road material, and the re-suspension of road and soil dust (Marko V., 2005).To study the contribution of exhaust pipe, brakes and tires on PM10 emission, the software Mobile 6.2 from the Environmental Protection Agency (EPA) was used. This software calculates emission factors, i.e. average emission rate of a given pollutant for a given source, relative to units of activity (EPA, 2003). Data from the traffic study was used as input in the software. Vehicle category, road type, vehicle's velocity, meteorological data such as temperature, humidity and clouds were the parameters from traffic study used. Also the type of fuel was considered, taking into consideration that HDDV, buses and 58% of the LDV are diesel engines (LDDV) and MC and 42% of the LDV uses gasoline (LDGV) (IMTT, 2011).
RESULTS
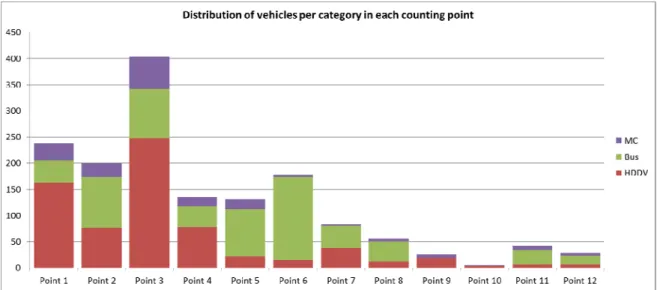
The traffic study referred above and performed on the streets shown in Figure 3 has resulted on Table 1 counts, divided by vehicle categories.
Table 1 Number of vehicles by type: LDV, Bus, HDDV and MC counted in each point from Figure 3
Counting point
Type and number of vehicles Vehicle/hour Total of vehicles per hour LDV HDDV Bus MC Point 1 4371 (94,8%) 162 (3,5%) 44 (1,0%) 33 (0,7%) 4610 Point 2 3048 (93,8%) 76 (2,3%) 98 (3,0%) 26 (0,8%) 3248 Point 3 4504 (91,8%) 248 (5,1%) 94 (1,9%) 62 (1,3%) 4908 Point 4 2309 (94,4%) 78 (3,2%) 40 (1,6%) 18 (0,7%) 2445 Point 5 1916 (93,6%) 22 (1,1%) 90 (4,4%) 20 (1,0%) 2048 Point 6 1171 (86,8%) 15 (1,1%) 159 (11,8%) 4 (0,3%) 1349 Point 7 934 (91,7%) 38 (3,7%) 43 (4,2%) 3 (0,3%) 1018 Point 8 399 (87,5%) 12 (2,6%) 39 (8,6%) 6 (1,3%) 456 Point 9 671 (96,3%) 19 (2,7%) 0 (0,0%) 7 (1,0%) 697 Point 10 213 (97,7%) 4 (1,8%) 0 (0,0%) 1 (0,5%) 218 Point 11 456 (91,6%) 7 (1,4%) 27 (5,4%) 8 (1,6%) 498 Point 12 473 (94,4%) 7 (1,4%) 17 (3,4%) 4 (0,8%) 501
Points 1, 2 and 3 are the expressway counts that as expected is the road with more traffic from all categories. The road with the counting points 2-5 is Bocage avenue which is a very important access road to the expressway, also with an important number of vehicles. The large majority of vehicles in Barreiro city are LDGV’s independently on the location of the counting point. It is also interesting to see that considering only the other categories (not LDV), in some roads HDDV are the majority and in other roads buses are in majority (Figure 4). The reason for this difference is the industrial zone located on the north area of the city, with a great flow of HDDV. The number of public transports (buses), is higher in the city centre.
Considering PM10 results from the monitoring campaign, performed at the same time and in the same points of traffic study (Figure 5), it is visible that the highest concentrations measured are coincident with the roads with more traffic, except for point number 4. PM10 concentration measured at this point is lower than in the other locations with great traffic flow, probably due to the higher wind intensity. Figure 5 shows also the wind intensity and direction measured on the measuring points with higher traffic intensity. Some PM10 concentration values measured are higher than the legal limit, which is 50 µg/m3 for a period of 24h, but it should be taken into consideration that the measurements were made in only one hour of the day, so it is not representative of the whole day. In this research work, it was important to measure the concentration of PM10 emitted during the traffic counting, to see the contribution of that source in that particular hour.
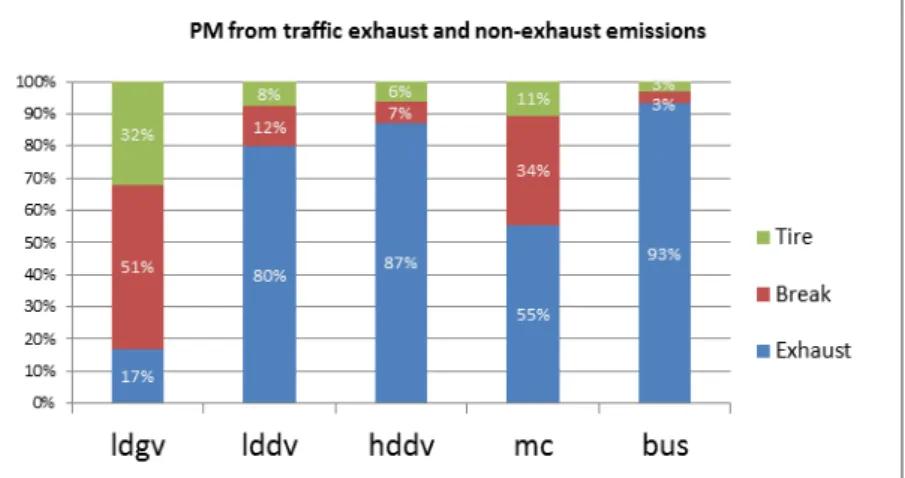
Figure 5. PM10 concentration (µg/m3) measured in the monitoring campaign performed at the same time of the traffic study Data from traffic study was used in Mobile 6.2 to verify the contribution of exhaust and non-exhaust PM10 emissions originated from traffic source. Figure 6 shows the simulation results. The contribution of each mobile emission calculated for exhaust pipe, brakes and tires, per each type of vehicle (LDGV, MC, LDDV, HDDV and buses) is represented in the figure.
Figure 6. Exhaust and non-exhaust traffic contribution to PM10 concentration (%)
Considering the above results it visible to see the greater contribution of exhaust pipe from diesel vehicles in PM10 emissions, while gasoline vehicles shows a significant contribution from brakes and tires. In fact LDGV have a slight contribution from exhaust pipe, according to these results most of PM10 emitted by these vehicles are from breaks. In spite of running on gasoline MC exhaust pipe has a big weight on the PM10 emissions, in agreement with these results, but much lower than diesel vehicles.
CONCLUSIONS
To understand traffic exhaust pipe and non-exhaust pipe emissions that contributes to PM10 concentration in outdoor air, a field campaign was performed on the main streets of Barreiro city in Portugal. The number of vehicles per categories and per hour was registered, and PM10 and meteorological parameters were measured. Results show that the large majority of vehicles are LDDV (86,8% to 97,7%). HDDV vehicles achieve its larger number near the industrial zone (5,1%) while buses achieves its higher number in the city centre (11,8%). Considering PM10 results from the monitoring campaign it was possible to see that the highest concentrations measured are coincident with the roads with more traffic, except for the point with higher wind intensity. Results from this study show that Diesel vehicles have a greater contribution of exhaust pipe while gasoline vehicles show a significant contribution from brakes and tires. Brakes are the main PM10 emissions (51%) on LDV vehicles in the city. For LDDV vehicles, HDDV and buses exhaust pipe emissions are the main emissions 80% for LDDV, 87% for HDDV and 93% for buses. For motorcycles (MC) exhaust pipe emissions represents 55% of total followed by break emissions (34%) and tire emissions (11%). In spite of the different type of sources, traffic is the major contributor to PM10 emissions in the city.
REFERENCES
Decreto-Lei n.º 102/2010, de 23 de Setembro, Ministério do Ambiente e do Ordenamento do Território EPA, 2003, User’s guide to Mobile 6.1 and Mobile 6.2
Iijima, H. Tago, K. Kumagai, M. Kato, K. Kozawa, K. Satob, N. Furutab,m 2088, Regional and seasonal characteristics of emission sources of fine airborne particulate matter collected in the center and suburbs of Tokyo, Japan as determined by multielement analysis and source receptor models, Journal of Environmental Monitoring, 10:1025–1032.
IMTT - Instituto da Mobilidade e dos Transportes Terrestres, 2011, Parque de veículos rodoviários motorizados presumivelmente em circulação (a) por tipo de veículo, segundo o combustível principal
IP/09/174, 2009, Air pollution: Commission starts legal action against 10 Member States over airborne particles, IP/09/174. http://europa.eu/rapid/pressReleasesAction.do?reference=IP/09/174
Garcia J., C. Louro, R. Cerdeira, A. R. Rosado, L. M. Coelho, C. Gouveia, 2007, Exposure to road traffic and respiratory symptoms, 6th International Conference on Urban Air Quality.
Marko V., 2005, Characteristics and Sources of Fine Particulate Matter in Urban Air, Publications of the National Public Health Institute
Mossetti S., Angius S. and Angelino E., 2004, Assessing the Impact of Particullate Sources in the Milan Urbain Area, Proceedings, volume 2 of Harmonization within Atmospheric Dispersion Modelling for Regulatory Purposes, Garmich-Partenkirchen, Germany, 1-4 June.