ABSTRACT: Kale plants are usually sold “in natura” in street markets and malls. Kale leaves can have their appearance compromised by dehydration and discoloration due to increased post-harvest time exposure. We aimed to analyze the Global Stability Index (GSI) in kale accessions by means of repeated measurement analysis and curve grouping as a complementary form of superior sample identification with regard to post-harvest preservation. Thirty kale accessions were evaluated using a randomized block design with four blocks and five plants per plot. Two commercial leaves per plant were collected, and kept on workbenches in the shade at a tempera-ture of 18 ± 1 °C. Subsequently, the degrees of discoloration and dehydration, total chlorophyll content, and accumulated fresh mass loss were evaluated over a 15-day period. From these data, the GSI was calculated for each day of evaluation. In addition, using mixed models, thirteen co-variance structures were tested. For graphical analysis, thirteen linear and non-linear models were assessed followed by curve grouping using multivariate analysis. The GSI was efficient for differentiating accessions, which became an important tool in post-harvest studies. GSI values were not equally correlated, therefore the use of mixed models became an important approach. The unstructured matrix was the best fit to model the dependence of error. The Melow I model was the best fit for studying the GSI. The accessions UFVJM-10, UFLA-1, COM-1, UFVJM-32, COM-3, UFVJM-8, UFVJM-36 and UFVJM-24, belonging to 3 and 5 clusters, are recommended for crop cultivation and as parental material in breeding programs.
Keywords: Brassica oleracea var. acephala DC, post-harvest preservation, repeated measure-ments, multivariate statistics, curve grouping
cient in the evaluation of beverages (Achour, 2006) and lettuce conservation (Ansorena et al., 2009; Ansorena et al., 2012) as a function of storage time.
Post-harvest study is generally performed in a se-ries of successive evaluations for each experimental unit over the course of time. This kind of experiment has been improperly analyzed as split plots must be analyzed by a series of repeated measures. Another approach is graphi-cal methods. With this technique, when a large number of treatments is performed, it becomes feasible to aggregate similar treatments with regard to the curves, i. e. treat-ments that present similar vectors to the estimates of ad-justed model parameters. Thus, this study aimed to analyze the GSI of 30 kale accessions by means of repeated mea-sure analysis with various co-variance structures, plotting curve grouping through multivariate analysis as a comple-ment to the identification of superior vegetable material.
Materials and Methods
The experiment was carried out in the municipal-ity of Diamantina, in the state of Minas Gerais, Brazil (18º12'01'' S; 43º34'20'' W, 1387 m.a.s.l.). During the period of the experiment, the average temperature was 18.3 ºC and the relative air humidity was 80 % with few oscillations.
Three commercial cultivars and twenty-seven kale accessions from the germplasm bank of UFVJM were used. The experimental design was a completely random-ized block with four replications and five plants per plot.
1Federal University of Viçosa, Av. Peter Henry Rolfs, s/n − 36570-000 − Viçosa, MG − Brazil.
2Federal University of the Jequitinhonha and Mucuri Valleys, Campus JK, Rod. MGT 367 - km 583, nº 5000 − 39100-000 − Diamantina, MG − Brazil.
3Federal University of Lavras, Campus Universitário, C.P. 3037 − 37200-000 − Lavras, MG − Brazil.
*Corresponding author <[email protected]>
Edited by: Antonio Costa de Oliveira
Longitudinal data assessment of global stability index in kale leaves
Alcinei Mistico Azevedo¹*, Valter Carvalho de Andrade Júnior², Carlos Enrrik Pedrosa3, Nermy Ribeiro Valadares², Marcos Aurélio Miranda Ferreira², Paulo Roberto Cecon¹
Received September 22, 2014 Accepted July 14, 2015
Introduction
Several studies were conducted on the kale crop (Brassica oleracea var. acephala DC) which revealed its health benefits (Ayaz et al., 2008; Sousa et al., 2008; Lemos et al., 2011). The appearance of Kale leaves is compromised by dehydration and discoloration due to post-harvest time exposure. Thus, cultivation of varieties resistant to this early dehydration and discoloration is a desirable trait.
Vegetable dehydration over periods of storage is commonly evaluated by water loss measurement (Ague-ro et al., 2011) and a rating scale. However, discoloration can also be assessed by considering the chlorophyll con-tent, which has also been efficiently evaluated, in some reports, by a rating scale (Agüero et al., 2008; Agüero et al., 2011; Martínez-Sánchez et al., 2011; Atkinson et al., 2013a; Atkinson et al., 2013b). When many character-istics are taken into account in a post-harvest study, it becomes difficult to make a decision. Achour (2006) pro-posed a method called the Global Stability Index (GSI) that allows for quantifying the stability of vegetable quality throughout a period, and aggregating informa-tion about a number of traits into a unique variable.
effi-Nineteen accessions were obtained by collections in rural properties within the region of Diamantina-MG (UFVJM-2, UFVJM-3, UFVJM-4, UFVJM-5, UFVJM-7, UFVJM-8, UFVJM-9, UFVJM-10, UFVJM-13, UFVJM-19, UFVJM-21, UFVJM-22, UFVJM-24, UFVJM-26, UFVJM-27, UFVJM-30, UFVJM-32, UFVJM-34 and UFVJM-36) and eight accessions were donated by the Federal University of Lavras (UFLA-1, UFLA-3, UFLA-6, UFLA-8, UFLA-5, UFLA-10, UFLA-11 and UFLA-12). Three commercial cul-tivars were also studied (COM-1, COM-2 and COM-3).
On 28 Jul 2011, lateral sprouts were collected to form seedlings through herbaceous cutting propagation by collecting 3- to 4-cm high sprouts from mother-plants with two leaflets in the bottom third. After the sprout collections, the material was planted into 72-cell poly-styrene trays filled with commercial substrate. Then, cuttings were transferred into a greenhouse in the Oleri-culture Sector of the UFVJM for 30 days in order to en-sure optimal rooting. When the seedlings were ready, they were transplanted into 7.5 kg vessels filled with soil:manure in a 3:1 ratio. The vessels were kept under greenhouse conditions for a period of 30 days in order to ensure a high seedling survival rate
On 28Sept 2011, vases were taken into the field where they remained until data collection for agricultural evaluation. Soil and top dressing fertilizations were car-ried out in accordance with crop recommendations; aphid and caterpillar control were manually administered on alternating days. In addition, old leaves and sprouts were removed weekly to allow for optimum plant development.
On 2 Jan 2012, two commercial leaves were collected from each plant (with absence of defects and leaf limb more than 20-cm long). These leaf samples were left on workbenches in the shade at 18 ± 1 °C. The valuations were performed at 0 (collection time), 1, 2, 3, 4, 5, 7, 9, 11, 13 and 15 days after collection. The degrees of discoloration and dehydration, total chlorophyll content and accumulated loss of fresh mass were analyzed. Five previously trained individuals made evaluations according to a rating scale and degrees of discoloration and dehydration were assessed by visual examination. To define the degree of discoloration, the following rating scale was used: 1 (absence of discoloration), 2 (presence of low discoloration), 3 (moderate discoloration), 4 (moderate to severe discoloration) and 5 (severe discoloration). To define the degree of dehydration, the following rating scale was used: 1 (dehydration non-apparent), 2 (low dehydration), 3 (moderate dehydration), 4 (moderate to severe dehydration) and 5 (severe dehydration). Total chlorophyll was evaluated using a portable chlorophyll meter, taking three readings per leaf for each evaluation event. Accumulated fresh mass loss (FML) was obtained by the following equation: FMLi (%) = (P0- Pi) /P0*100, where FMLi is the accumulated fresh mass loss at i time, P0 is the weight of the kale head at harvest time and Pi is the weight of the head at i time.
Statistical analysis was carried out on a plot by plot basis, taking into account the mean of observed values
for leaf evaluation (five plants per plot and two leaves per plant). For the best result in terms of viewing and interpretation, the Global Stability Index (GSI) was used as recommended by Achour (2006). For this index, the variation terms (Vij' s) were initially calculated as follows: Vij= (cij- cio)/(Li- cio), where Cij is the measured value for the i trait at j time; Ci0 is the initial value of the i criterion at the moment of the first evaluation (time = 0); Li is the threshold value of the i trait, as established by the user. The value of Li, which is used for all treatments, was such that the highest value for Vij may be equal to 1, and values should increase in line with prolongations in storage time.
From the value of Vij it is possible to calculate the GSI for any j time by using the expression: GSIj = 1 –
Σn
i=1∝i * Vij, where j is the j-th unit of time, Σ n
i= 1 is the
addition of i=1 up to n, in which n is the total number of traits evaluated; Vij is the variation term of the i criterion at j time; and ∝i is the weight from the i criterion, as established by the user. In this research study, in order to reach the same weight for each one of the four traits, ∝i = 0.25 was adopted . Thus, as the values of Vij vary from 0 to 1 and the sum of the ∝i must be 1, GSI also will also vary between 0 and 1.
The mathematical model for the analysis of repeated measures of the GSI is given by: yijk, = µ + ti +aj+ taij + bk + εijk, where yijk= GSI value at the j evaluation, in k block and i treatment; µ = global mean; ti= fixed effect of i genotype; aj= fixed effect of j evaluation; (ta)ij= fixed effect of the interaction between genotype and evaluation; bk= random effect of k block;
εijk= random error, εijk ~N (0, V), in which, V is the co-variance matrix used to model error dependence that is associated with the GSI at j evaluation, k block, and i genotype. It was assumed that error dependence occurs between jth and j' th (jth ≠ j'th) in the evaluation of an
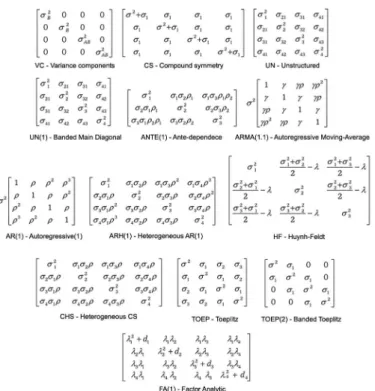
identical experimental unit, in an identical block and, consequently, co-variance matrices feature in Figure 1.
The model was adjusted to the data by the maxi-mum likehood estimate, using the PROC MIXED soft-ware (Statistical Analysis System, version 9.2), in which 13 co-variance matrices were tested. To identify the best matrix, the Akaike Information Criterion (AIC) and the Bayesian Information Criterion (BIC) were used. When fixing the time effect, mean values of the GSI of acces-sions were compared for each evaluation using the Scott-Knott test (p < 0.05). This test was performed consider-ing changes in adjusted co-variance structure by PROC MIXED, similarly to Cecon et al. (2008).
To describe the behavior of the GSI as a function of evaluation time, a statistical method similar to that de-scribed by Cecon et al. (2008) was adopted. In addition to the polynomial models of first degree, second degree and exponential, more complex models were also tested such as the Schnute, Mitscherlich, Richards, Gompertz, Logistics, Meloun I, von Bertalanffy and Michaelis-Men-ten. These models were adjusted for each replication by cultivar using the PROC MODEL from SAS® software
a multivariate variance analysis was carried out using a PROC GLM (Statistical Analysis System, version 9.2) with MANOVA option, in order to evaluate the accession effect on the estimates of model coefficients. Adjusted means were extracted from coefficients by least square (LSMEANS) and were subjected to clustering analysis in a PROC CLUSTER (Statistical Analysis System, version 9.2) by the centroid method.
In order to identify an optimal number of clusters, root mean squared standard deviation values (RMSSTD) were used. To view the dendrogram and check cultivars that belonged to different groups obtained by statistical discrimination, a PROC TREE (Statistical Analysis Sys-tem, version 9.2) was used.
Results and Discussion
Verification of variance and co-variance matrix adjustments, by the Akaike Information Criterion (AIC) and the Bayesian Information Criterion (BIC) are shown in Table 1. The variance component structure (VC) pre-sented the worst adjustment due to higher values for AIC and BIC, and in this structure, zero co-variance among successive evaluations were admitted. This behavior is not expected for similar experiments, once using repeat-ed measurements are taken, the responses of different evaluation times in the same plot, are not equally cor-related (Araújo et al., 2009) as can be observed in Table 2. For this reason, a good adjustment for the composed symmetrical structure (CS) was not obtained and con-stant variances and co-variance are assumed.
According to García et al. (2010) if the sphericity condition is incorrectly met, which is equivalent to vari-ance homogeneity in ANOVA analysis, apparent signifi-cance of difference between treatment means will be coarsely extrapolated and the sensitivity of interaction tests will be seriously reduced. An alternative to test ma-trix sphericity is to obtain an unstructured mama-trix (UN) and test it with the Huynh-Feldt matrix (H-F). Thus, us-ing values of -2 Res Log Likelihood, freedom degrees of UN structure (1193.3 and 54), and of H-F (1883.4 and 10), the value of X2=|1193.3-1883.4|=690.1 with 44
de-Figure 1 − Variances and co-variance structures used to model error dependence. Source: http://support.sas.com/
Table 1 − Evaluators of adjustment quality of co-variance structures used for modeling the dependence of residuals.
Structures AIC BIC
Variance components 2744.0 2746.8
Compound symmetry 2144.4 2150.0
Compound heterogeneous symmetry 1948.2 1978.8
Unstructured 1303.3 1402.4
Unstructured banded main diagonal 2607.7 2635.5
Autoregressive 1692.3 1697.9
Autoregressive heterogeneous 1473.3 1504.0 Autoregressive moving average 1675.3 1683.7
Huynh-Feldt 1905.4 1936.1
Toeplitz 1665.8 1693.7
Banded Toeplitz 2093.7 2099.3
Factor Analytic 1861.0 1916.8
Ante-dependence 1349.5 1456.6
Table 2 − Pearson correlation of Global Stability Index (GSI) values obtained in kale accessions at different storage points.
Times Day 2 Day 3 Day 4 Day 5 Day 7 Day 9 Day 11 Day 13 Day 15 Day 1 0.977 0.878 0.802 0.712 0.560 0.541 0.586 0.603 0.664 Day 2 0.926 0.864 0.786 0.628 0.598 0.639 0.626 0.684 Day 3 0.970 0.915 0.754 0.712 0.727 0.679 0.716
Day 4 0.947 0.816 0.766 0.768 0.673 0.701
Day 5 0.943 0.910 0.878 0.783 0.795
Day 7 0.986 0.933 0.825 0.821
Day 9 0.935 0.854 0.854
Day 11 0.934 0.922
Day 13 0.981
Times: Day (evaluation day after harvest).
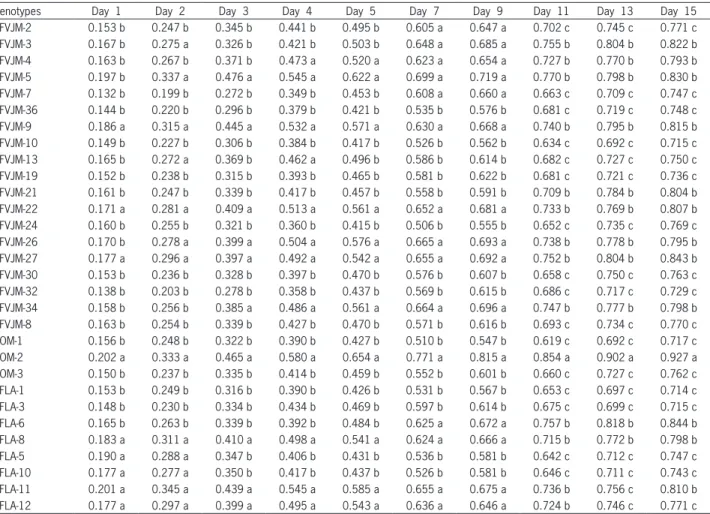
Table 3 − Grouping of mean for the global stability index (GSI) of leaves kale evaluated at different storage points (Days).
Genotypes Day 1 Day 2 Day 3 Day 4 Day 5 Day 7 Day 9 Day 11 Day 13 Day 15
UFVJM-2 0.153 b 0.247 b 0.345 b 0.441 b 0.495 b 0.605 a 0.647 a 0.702 c 0.745 c 0.771 c
UFVJM-3 0.167 b 0.275 a 0.326 b 0.421 b 0.503 b 0.648 a 0.685 a 0.755 b 0.804 b 0.822 b
UFVJM-4 0.163 b 0.267 b 0.371 b 0.473 a 0.520 a 0.623 a 0.654 a 0.727 b 0.770 b 0.793 b
UFVJM-5 0.197 b 0.337 a 0.476 a 0.545 a 0.622 a 0.699 a 0.719 a 0.770 b 0.798 b 0.830 b
UFVJM-7 0.132 b 0.199 b 0.272 b 0.349 b 0.453 b 0.608 a 0.660 a 0.663 c 0.709 c 0.747 c
UFVJM-36 0.144 b 0.220 b 0.296 b 0.379 b 0.421 b 0.535 b 0.576 b 0.681 c 0.719 c 0.748 c
UFVJM-9 0.186 a 0.315 a 0.445 a 0.532 a 0.571 a 0.630 a 0.668 a 0.740 b 0.795 b 0.815 b
UFVJM-10 0.149 b 0.227 b 0.306 b 0.384 b 0.417 b 0.526 b 0.562 b 0.634 c 0.692 c 0.715 c
UFVJM-13 0.165 b 0.272 a 0.369 b 0.462 a 0.496 b 0.586 b 0.614 b 0.682 c 0.727 c 0.750 c
UFVJM-19 0.152 b 0.238 b 0.315 b 0.393 b 0.465 b 0.581 b 0.622 b 0.681 c 0.721 c 0.736 c
UFVJM-21 0.161 b 0.247 b 0.339 b 0.417 b 0.457 b 0.558 b 0.591 b 0.709 b 0.784 b 0.804 b
UFVJM-22 0.171 a 0.281 a 0.409 a 0.513 a 0.561 a 0.652 a 0.681 a 0.733 b 0.769 b 0.807 b
UFVJM-24 0.160 b 0.255 b 0.321 b 0.360 b 0.415 b 0.506 b 0.555 b 0.652 c 0.735 c 0.769 c
UFVJM-26 0.170 b 0.278 a 0.399 a 0.504 a 0.576 a 0.665 a 0.693 a 0.738 b 0.778 b 0.795 b
UFVJM-27 0.177 a 0.296 a 0.397 a 0.492 a 0.542 a 0.655 a 0.692 a 0.752 b 0.804 b 0.843 b
UFVJM-30 0.153 b 0.236 b 0.328 b 0.397 b 0.470 b 0.576 b 0.607 b 0.658 c 0.750 c 0.763 c
UFVJM-32 0.138 b 0.203 b 0.278 b 0.358 b 0.437 b 0.569 b 0.615 b 0.686 c 0.717 c 0.729 c
UFVJM-34 0.158 b 0.256 b 0.385 a 0.486 a 0.561 a 0.664 a 0.696 a 0.747 b 0.777 b 0.798 b
UFVJM-8 0.163 b 0.254 b 0.339 b 0.427 b 0.470 b 0.571 b 0.616 b 0.693 c 0.734 c 0.770 c
COM-1 0.156 b 0.248 b 0.322 b 0.390 b 0.427 b 0.510 b 0.547 b 0.619 c 0.692 c 0.717 c
COM-2 0.202 a 0.333 a 0.465 a 0.580 a 0.654 a 0.771 a 0.815 a 0.854 a 0.902 a 0.927 a
COM-3 0.150 b 0.237 b 0.335 b 0.414 b 0.459 b 0.552 b 0.601 b 0.660 c 0.727 c 0.762 c
UFLA-1 0.153 b 0.249 b 0.316 b 0.390 b 0.426 b 0.531 b 0.567 b 0.653 c 0.697 c 0.714 c
UFLA-3 0.148 b 0.230 b 0.334 b 0.434 b 0.469 b 0.597 b 0.614 b 0.675 c 0.699 c 0.715 c
UFLA-6 0.165 b 0.263 b 0.339 b 0.392 b 0.484 b 0.625 a 0.672 a 0.757 b 0.818 b 0.844 b
UFLA-8 0.183 a 0.311 a 0.410 a 0.498 a 0.541 a 0.624 a 0.666 a 0.715 b 0.772 b 0.798 b
UFLA-5 0.190 a 0.288 a 0.347 b 0.406 b 0.431 b 0.536 b 0.581 b 0.642 c 0.712 c 0.747 c
UFLA-10 0.177 a 0.277 a 0.350 b 0.417 b 0.437 b 0.526 b 0.581 b 0.646 c 0.711 c 0.743 c
UFLA-11 0.201 a 0.345 a 0.439 a 0.545 a 0.585 a 0.655 a 0.675 a 0.736 b 0.756 c 0.810 b
UFLA-12 0.177 a 0.297 a 0.399 a 0.495 a 0.543 a 0.636 a 0.646 a 0.724 b 0.746 c 0.771 c
Means followed by same letter in the column do not differ from each other by the Scott-Knott (1974) test at 5 % probability. grees of freedom (54-10) was obtained, leading to a p-value
lower than 0.001, indicating non-sphericity.
The unstructured matrix (UN) was the one that presented the best adjustment, with the lowest AIC and BIC values. According to Barnett et al. (2010) this co-vari-ance matrix assumes that no two pairs of observations are equally correlated, and that there is no ‘structure’ between neighboring values in the matrix. Additionally,
it also allows for different variance terms along the di-agonal of the matrix. From variance estimates for each evaluation in UN structure, a post-analysis of the interac-tion was carried out (evaluainterac-tion date x accession) by using the Scott-Knott test for the grouping of means (Table 3). A procedure similar to this was implemented by Cecon et al. (2008), when assessing the productivity of 50 clonal varieties of coffee over five harvests.
The GSI behavior was described with respect to evaluation time by means of the graphical method. For this purpose, adjustments of different linear and non-lin-ear models are displayed in Table 4. A good fit for the Bro-dy model with the lowest AIC (26.238) was found, with the highest R2 value (0.985) and 99 % of convergence;
however, The best model was considerd to be the Melow I (yi = β1– β2e(–β3xi) + ε
i), since in this model there was 100
% convergence with values around 26.285 for AIC and 0.984 for R2.
for multivariate variance analysis, when a significant effect (p small or equal to 0.01) of accessions was detected in vec-tors of the coefficients studied by Wilks' lambda, Pillai's trace, Hotelling-Lawley and Roy's root tests. This indicates the need for more than one curve to explain the progress of GSI. Cecon et al. (2008) found similar results that cor-roborate the present ones. Therefore, fitted means were justified by the minimum squares of GSI as a function of accessions for grouping analysis by the centroid method.
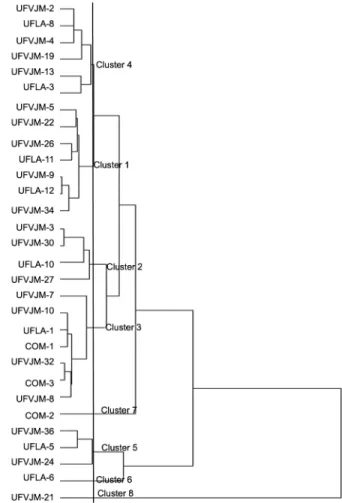
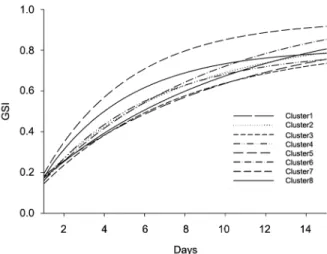
The ideal number of clusters is presented in Figure 2, which is based on root-mean-square standard deviation (RMSSTD). The RMSSTD measures the homogeneity of the clusters formed (Liu et al., 2013) and enables iden-tification of an optimal number of clusters by means of the maximum curvature method (Cecon et al, 2008). The use of this method is advantageous, since it allows for non-subjectivity of the stipulated number of groups in the dendrogram (Liu et al., 2013), showing feasibility for the formation of eight clusters (Figure 3). With the GSI means of each evaluation in function of the accessions that com-pose each cluster, eight curves were plotted and displayed in Figure 4. Using the same technique, Cecon et al. (2008) explained the behavior of 50 coffee accessions with 10 curves in respect of crop yield.
With respect to the GSI, higher values are unde-sirable since they indicate lesser stability throughout the post-harvest period. In this sense, COM-2 presented worse results, the group of accessions having the highest GSI for all evaluation periods (Table 3). Multivariate anal-ysis showed that cluster 7 (Figure 3) was composed of this accession alone. Verification of the same undesired results of this accession are also v shown in Figure 4, in which the curve shows higher values for the GSI during storage. Clusters 1 and 6 composed of UFVJM-5, UFVJM-22, UFVJM-26, UFLA-11, UFVJM-9, UFLA-12, UFVJM-34 and UFLA-6 accessions (Figure 3) have also not presented
good results in terms of the GSI (Figure 4). All these acces-sions were among the ones which presented higher GSI values, during the first 9 days of evaluation (Table 3). The best GSI results were found in clusters 3 and 5, when curves are close to the X-axis (Figure 4); these clusters were composed of the following accessions UFVJM-7,
Table 4 − Evaluators of adjustment quality in models used to describe the Global Stability Index (GSI) in kale leaves submitted in storage under room temperature.
Models R2 R2
Ajst AIC Conv. (%)
Schnute 0.866 0.828 52.212 100.000
Mitscherlich 0.987 0.984 26.240 99.167
Richards 0.986 0.982 28.326 100.000
Gompertz 0.986 0.982 28.326 100.000
Logistico 0.980 0.974 32.489 100.000
Meloun I 0.988 0.984 26.285 100.000
Meloun II 0.988 0.984 26.373 95.833
Brody 0.988 0.985 26.238 99.167
von Bertalanffy 0.987 0.982 27.131 100.000
Michaelis-Menten 0.982 0.980 28.356 100.000
Exponential 0.822 0.800 53.731 100.000
Polynomial models of 1°degree 0.899 0.886 46.881 100.000 Polynomial models of 2°degree 0.978 0.972 31.791 100.000 Evaluators: R2 (coefficient of determination), R2
Ajst(adjusted coefficient of determination), AIC (Akaike Information Criterion), Conv.(percentage of convergence).
Figure 2 − Statistical behavior of root-mean-square standard deviation (RMSTSD), and distance between the straight line and the estimated curve (RMSTSD) for verification of optimal number of clusters by maximum curve method.
Figure 3 − Dendrogram by the centroid method for classification of genotypes considering the estimates of β1and β3coefficients
UFVJM-10, UFLA-1, COM-1, UFVJM-32, COM-3, UFVJM-8, UFVJM-36, UFLA-5 and UFVJM-24 (Figure 3). Except for UFVJM-7 and UFLA-5 these accessions have remained in the group of lower GSI values for all evaluation periods (Table 3). Thus, these accessions are recommended for crop cultivation and as parental mate-rial in breeding programs.
Conclusions
The accessions UFVJM-10, UFLA-1, COM-1, UFVJM-32, COM-3, UFVJM-8, UFVJM-36 and UFVJM-24, belonging to clusters 3 and 5, are recom-mended for crop cultivation and as parental material in breeding programs.
Acknowledgements
The authors thank Brazilian National Council for Scientific and Technological Development (CNPq), Co-ordination for the Improvement of Higher Level Per-sonnel (CAPES) and Minas Gerais State Foundation for Research Support (FAPEMIG) for providing scholarships and resources to develop this study.
References
Achour, M. 2006. A new method to assess the quality degradation of food products during storage. Journal of Food Engineering 75: 60-564.
Agüero, M.V.; Barg, M.V.; Yommi, A.; Camelo, A.; Roura, S.I. 2008. Postharvest changes in water status and chlorophyll content of lettuce (Lactuca sativa L.) and their relationship with overall visual quality. Journal of Food Science 73: 47-55.
Agüero, M.V.; Ponce, A.G.; Moreira, M.R.; Roura, S.I. 2011. Lettuce quality loss under conditions that favor the wilting phenomenon. Postharvest Biology and Technology 59: 124-131.
Ansorena, M.R.; Goñi, M.G.; Aguëro, M.V.; Goni, M.G.; Roura, S.I.; Ponce, A.; Moreira, M R.; Di Scala, K.C. 2012. Assessment of lettuce quality during storage at low relative humidity using Global Stability Index methodology. Ciência e Tecnologia de Alimentos 32: 366-373.
Ansorena, M.R.; Goñi, M.G.; Aguëro, M.V.; Roura, S.I.; Di Scala, K.C. 2009. Application of the general stability index to assess the quality of butter lettuce during postharvest storage by a multi-quality indices analysis. Journal of Food Engineering 92: 317-323. Araújo, S.I.; Regazzi, A.J.; Araújo, C.V.; Cruz, C.D.; Silva,
C.H.O; Viana, J.M.S. 2009. Variance component estimation with longitudinal data: a simulation study with alternative methods. Crop Breeding and Applied Biotechnology 9: 202-209.
Atkinson, L.D.; Hilton, H.W.; Pink, D.A.C. 2013a. A study of variation in the tendency for postharvest discoloration in a lettuce (Lactuca sativa) diversity set. International Journal of Food Science and Technology 48: 801–807.
Atkinson, L.D.; Mchale, L.K.; Truco, M.J.; Hilton, H.W.; Lynn, J.; Schut, J.W.; Michelmore, R.W.; Hand, P.; Pink, D.A.C. 2013b. An intra–specific linkage map of lettuce (Lactuca sativa) and genetic analysis of postharvest discolouration traits. Theoretical and Applied Genetics 126: 2737–2752.
Ayaz, F.A.; Hayirlioglu-Ayaz, S.; Alpay-Karaoglu, S.; Gruz, J.; Valentova, K.; Ulrichova, J.; Strnad, M. 2008. Phenolic acid contents of kale (Brassica oleracea L. var. acephala DC.) extracts and their antioxidant and antibacterial activities. Food Chemistry 107: 19-25.
Barnett, A.G.; Koper, N.; Dobson, A.J.; Schmiegelow, F.; Manseau, M. 2010. Using information criteria to select the correct variance– covariance structure for longitudinal data in ecology. Methods in Ecology and Evolution 1: 15–24.
Cecon, P.R.; Silva, F.F.; Ferreira, A.; Ferrão, R.G.; Carneiro, A.P.S.; Detmann, E.; Faria, P.N.; Morais, T.S. Da S. 2008. Repeated measures analysis in the evaluation of clones 'Conilon' coffee = Análise de medidas repetidas na avaliação de clones de café ‘Conilon’. Pesquisa Agropecuária Brasileira 43: 1171-1176. García, P.F.; Vallejo, G.; Livacic-Rojas, P.; Herrero, H.; Cuesta, M.
2010. Comparative robustness of six tests in repeated measures designs with specified departures from sphericity. Quality & Quantity 44: 289-301.
Liu, Y.; Li, Z.; Xiong, H.; Gao, X.; Wu, J.; Wu, S. 2013. Understanding and enhancement of internal clustering validation measures. IEEE Transactions on Cybernetics 43: 982-993.
Lemos, M.; Santin, J.R.; Júnior, L.C.K.; Niero, R.; Andrade, S.F.D. 2011. Gastroprotective activity of hydroalcoholic extract obtained from the leaves of Brassica oleracea var. acephala DC in different animal models. Journal of Ethnopharmacology 138: 503–507. Martínez-Sánchez, A.; Tudela, J.A.; Luna, C.; Allende, A.; Gil, M.I.
2011. Low oxygen levels and light exposure affect quality of fresh-cut Romaine lettuce. Postharvest Biology and Technology 59: 34-42. Sousa, C.; Taveira, M.; Valentao, P.; Fernandes, F.; Pereira, J.A.;
Estevinho, L.; Bento, A.; Ferreres, F.; Seabra, R.M.; Andrade, P.B. 2008. Inflorescences of Brassicacea species as source of bioactive compounds: a comparative study. Food Chemistry 110: 953-961. Souza, L.A.; Carneiro, P.L.S.; Malhado, C.H.M.; Silva, F.F.; Silveira,
F.G. 2013. Traditional and alternative nonlinear models for estimating the growth of Morada Nova sheep. Revista Brasileira de Zootecnia 42: 651-655.