DOI: http://dx.doi.org/10.1590/2446-4740.00117 Volume 33, Number 2, p. 121-129, 2017
Introduction
One of the most recurrent pathologies in the spine is scoliosis. It occurs in the frontal plane and is formed by one or more curves in the spinal column. There are several types of scoliosis, three of the most common ones being congenital, neuropathic, and idiopathic. Of these, the idiopathic type affects the largest number of patients is. Each individual behaves differently in terms of evolution. The general prognosis of scoliosis depends on the patient’s age and the magnitude of the curve (Rosenthal, 2008; Schroth, 1992). The main causes for the most common types of scoliosis are as follows:
• Congenital: it arises due a problem with the formation of the spinal bones (vertebrae) or due to problems with the fusion the spinal bones; • Neuromuscular: it is caused by neurological
problems such as cerebral or muscular paralysis; • Idiopathic: it has no known causes; however,
some risk factors are considered by medicine, such as the following:
o Age: it usually occurs at the most pronounced stage of growth, during puberty (between 9 and 15 years);
o Sex: although it can occur in both sexes, girls have a higher risk of occurrence;
o Family history: it commonly occurs in members of the same family who have antecedents with deformity.
Scoliosis is detected by postural examination and speciic examination, with radiography being the most common examination. With the aid of radiography, it is possible to locate the height and determine the angulation of scoliosis. The angulation of scoliosis determines the severity of the pathology.
There are different methods for assessing and determining scoliosis, the major ones being those of King, Lenke, Rei, and Cobb. The most commonly used
Evaluation of scoliosis using baropodometer and artiicial neural network
Caroline Meireles Fanfoni
1, Fabian Castro Forero
1, Marcelo Augusto Assunção Sanches
1,
Érica Regina Marani Daruichi Machado
2, Mateus Fernandes Réu Urban
3, Aparecido Augusto de Carvalho
1*
1 Graduate Program in Electrical Engineering, São Paulo State University, Ilha Solteira Campus, Ilha Solteira, SP, Brazil. 2 Department of Mathematics, São Paulo State University, Ilha Solteira Campus, Ilha Solteira, SP, Brazil.
3 Federal Institute of São Paulo, Campus of São José dos Campos, São José dos Campos, SP, Brazil.
Abstract Introduction: One of the most recurrent pathologies in the spine is scoliosis. It occurs in the frontal plane and is formed by one or more curves in the spinal column. The scoliosis causes global postural misalignment in an
individual. One of the modiications produced by postural misalignment is the way in which an individual distributes weight to the feet. We aimed to implement an electronic system for separating patients with Degree I scoliosis (i.e., 1° to 19° scoliosis according to the Ricard classiication) into two groups: C1 (1°-9°) and C2 (10°-9°). The highest
percentage of patients with scoliosis is in this range: those who do not need to wear vests or undergo surgery and whose treatment is performed via special physical exercise and frequent evaluations by healthcare professionals. Methods: The electronic system consists of a baropodometer and artiicial neural networks (ANNs). The classiication
of patients in the scoliosis groups was performed with MATLAB software and a Single Layer Perceptron network using the backpropagation training algorithm. Evaluations were performed on 63 volunteers. Results: The mean
classiication sensitivity was 93.7% in the C1 group and 94.5% in the C2 group. The classiication accuracy was 83.3% in the C1 group and 96.0% in the C2 group. Conclusion: The implemented system can contribute to the treatment of patients with scoliosis grades ranging from 1° to 19°, which represents the highest incidence of this pathology, for which the monitoring of the clinical condition using noninvasive techniques is of fundamental importance.
Keywords Scoliosis, Baropodometer, Weight discharge, Artiicial neural networks, Single layer perceptron.
This is an Open Access article distributed under the terms of
the Creative Commons Attribution License, which permits
unrestricted use, distribution, and reproduction in any medium,
provided the original work is properly cited.
How to cite this article: Fanfoni CM, Forero FC, Sanches MAA,
Machado ERMD, Urban MFR, Carvalho AA. Evaluation of scoliosis using baropodometer and artificial neural network. Res Biomed Eng. 2017; 33(2):121-129. DOI: 10.1590/2446-4740.00117.
*Corresponding author: Graduate Program in Electrical Engineering,
São Paulo State University, Avenida Brasil, 56, CEP 15385-000, Ilha Solteira, SP, Brazil. E-mail: [email protected]
classiication is the Cobb angle (Cunha et al., 2009; Mezghani et al., 2010).
Scoliosis angulation is usually measured directly on the radiography ilms. In the literature, studies using computer programs have been developed to obtain the scoliosis curve angles or to extract the spine deformity features from digital radiography images in order to identify deformities automatically.
Scoliosis can be divided into four groups: Degrees I, II, III, and IV, depending on the Cobb angle, according to the treatise on Theoretical and Practical Osteopathy (Ricard and Sallé, 1996):
• Degree I: angulation less than 20°; • Degree II: angulation between 20° and 30°; • Degree III: angulation between 31° and 50°; • Degree IV: angulation above 51°.
The scoliosis degree directly inluences the type of treatment. There are three options for treating idiopathic scoliosis:
• Degree I: physiotherapy, special physical exercise, Pilates, global posture reeducation (GPR), and routine follow-up are used, seeking to reduce scoliosis through the correction of postural asymmetries, stretching, and muscle strengthening, among others, as diffused in several studies (Folhadela and Mejia, 2012; Pontes, 2008; Rosenthal, 2008; Segura et al., 2011; Toledo et al., 2011);
• Degrees II and III: physical therapy treatment and use of orthopedic or Milwaukee vest; • Degree IV: surgical intervention.
In the last decades researchers have been using artiicial intelligence techniques to analyze spinal deformities. Ramirez et al. (2003) used Fuzzy Logic to develop a classiier system to assess the severity of scoliosis in 41 adolescents. Radiographic images of the volunteers’ backs were used. The severity of scoliosis was classiied as mild, moderate and severe. Ajemba et al. (2004) implemented a system with Fuzzy Logic to evaluate scoliosis and predict its progression. They used radiographic images of patients with scoliosis between 20 and 45 degrees. Wu et al. (2006) used Fuzzy Logic to predict scoliosis evolution during the period of 6 to 12 months, in order to analyze the progress of scoliosis and to prevent patients from frequently exposing themselves to X-ray radiation. Kim et al. (2006) used topographic images of Moiré from the coastal region of 1200 individuals and applied the backpropagation algorithm to diagnose body asymmetries and scoliosis in the studied group. Lin (2008) scanned radiographs taken in the sagittal and frontal planes and developed a software for the spinal column to be displayed, presenting three curves in three dimensions. He then trained ANN using the backpropagation algorithm
to identify spinal column deformities using the Rei classiication. Igwe et al. (2008) scanned 3D images of the trunk and used Kohonen’s self-organizing model to parameterize and map spinal deformities caused by scoliosis. Camilo et al. (2010) proposed a tool based on augmented reality (AR), which enables the demonstration of a virtualized spine and virtual ideal spine visible through the monitors. They made comparisons with traditional methods such the use of a symetrograph and palpation method. Mezghani et al. (2010) also used ANN to assist medical teams in decision-making with regard to the surgical procedure in patients with scoliosis. A database of patients who underwent surgery to correct scoliosis was provided to the network. The network used was Kohonen’s self-organizing model.
Waller et al. (2013) reported that there are families with recurrent cases of idiopathic scoliosis and families with sporadic cases. Families with recurrent cases of the pathology exhibit alterations in housekeeping genes encoding β-actin cytoskeleton (ACTB) and glyceraldehyde-3-phosphate dehydrogenase (GAPDH) proteins. In their study, Waller et al. used the backpropagation algorithm to map ACTB and GAPDH levels in the tissues of patients with scoliosis and to differentiate familial and sporadic cases from idiopathic ones.
According to Bienfait (2000), any deformation of the feet will require an adaptation of the postural system and vice versa. Thus, it is believed that the assessment and monitoring of treatment with baropodometry may be of clinical and academic relevance. The deformity caused by scoliosis affects the organism as a whole, causing postural misalignment. This misalignment can affect the way in which individuals discharge their body weight onto their feet. Thus, another way to understand the misalignment process caused by scoliosis is to evaluate the individual from the caudal to the axial axis, i.e., to investigate the deformity caused by scoliosis, evaluating the individual making the feet diagnosis.
tests, an improvement in the weight distribution on the plantar surface and pressure peaks as well as more homogeneous weight on both feet was observed, which can induce improvements in the postural behavior and prevention of spinal injuries. According to Cordeiro et al. (2014) the baropodometric projection could be used in clinical practice as an evaluation tool for the treatment of postural dysfunctions and spinal deviations. Thus, it is believed that the assessment and monitoring of treatment with baropodometry may be of clinical and academic relevance. Almeida et al. (2015) evaluated 67 preschool children. Postural parameters were analyzed through postural evaluation, baropodometry to verify plantar pressure, and photography to analyze the medial foot arch. The research concluded that postural asymmetries and asymmetries in the distribution of plantar pressure, observed in early childhood, demonstrate the importance of monitoring postural parameters and long-term foot load to prevent future postural and biomechanical changes. Urban (2015) implemented a baropodometer consisting of 2 platforms, each with 60 force sensing resistive sensors (FSRs), distributed on a matrix, signal conditioning circuits, data interface, and a personal computer. With the help of a computer program, it was possible to determine the force amplitude applied at 240 points from measurements using 120 sensors and calculations related to the mechanical platform structure. The equipment was used to measure the weight distribution in the plantar region of 10 healthy volunteers and 10 hemiplegic volunteers. Castro (2016) made some improvements in the baropodometer developed by Urban and used it to analyze a group of 30 volunteers with different ages and different scoliosis degrees. The volunteers were divided into two age groups: G1 (13-30 years) and G2 (45-78 years). The G2 group had higher values of stabilometry than the G1 group. Similarly, the same population was segmented into two groups according to the degrees of GrA (0°-9°) and GrB (10°-32°). GrB had higher values of stabilometry in relation to GrA. It was possible to determine that the greater the scoliosis degree, the smaller is the stabilometry variable’s dependence with age.
The aim of this study was to implement an electronic system using a baropodometer and ANNs to determine whether a patient with Degree I scoliosis according to the Ricard classiication has a scoliosis degree ranging from 1° to 9° or from 10° to 19°. The highest percentage of patients with scoliosis have Degree I scoliosis: those who do not need to wear vests or undergo surgery and whose treatment is performed via special physical exercise and frequent evaluations by health professionals.
According to Rosenthal (2008), curvatures up to 10° are considered “normal” and do not interfere with strength, joint mobility, resistance, or any other body
function whereas curvatures that measure between 10° and 20° deserve special observation and should be examined periodically. It is convenient to divide Degree I into two ranges because it enables health professionals to better follow the clinical condition of patients with scoliosis without the need for frequent X-ray examinations. In this case, the use of a noninvasive technique to monitor treatment, as described here, is of great relevance.
Methods
To reach the objective proposed in this study, evaluations were performed with volunteers. The criteria for participation in the study were that the participants should have scoliosis, a spine X-ray performed less than 6 years previously, weight less than 100 kg, and be able to stand without assistance.
Prior to the start of the tests, the volunteers were informed about the research procedures. They signed the Free and Clariied Consent Term. The procedures were approved by the Ethics Committee of São Paulo State University (UNESP), Campus of Presidente Prudente, according to protocol 27/2011, renewed in 2014.
Participants became aware of the test results, and their identities were kept conidential.
Volunteer evaluations
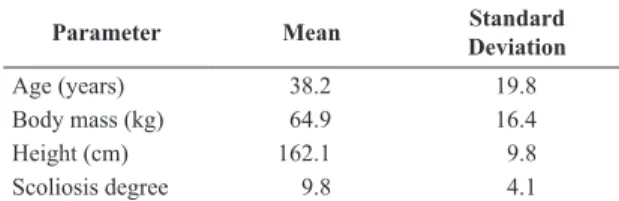
Sixty-three volunteers diagnosed with scoliosis participated in this study. Most volunteers were female (77.8%), and the largest age group was between 20 and 59 years (60.3%). The predominant scoliosis height was the thoracic region and the convexity side was the right. Only the main scoliosis curve was considered. All volunteers fell into Degree I according to the Ricard classiication (<20°). Table 1 shows some demographic data of the volunteers.
The evaluations were performed at the Basic Health Unit 04 (UBS 04) from Ilha Solteira - SP and at the Family Health Support Center (NASF) in Cassilândia - MS.
An evaluation protocol was set up for the research. All volunteers underwent anamnesis, postural evaluation, radiographic analysis, photographic evaluation of the back, and baropodometry examination.
Table 1. Biometric data of the volunteers.
Parameter Mean Standard
Deviation
Age (years) 38.2 19.8
Body mass (kg) 64.9 16.4
Height (cm) 162.1 9.8
By anamnesis, the following data were collected from the volunteers: name, age, sex, laterality, weight, height, occupation, educational level, address, and telephone number. In addition, volunteers were asked whether they had already undergone physiotherapeutic treatment or were still undergoing it and whether they practiced physical activity, considering that these factors inluence the scoliosis pathology.
Radiographic analysis
Using radiography, it was possible to identify the scoliosis height, convexity side, the impairment degree. Some radiographs have already been printed with the scoliosis degree. In others, scoliosis angulation was obtained by calculating the Cobb angle. For this calculation, it was necessary to use a goniometer. The Cobb angle is determined in three stages:
In the irst stage, the apical vertebra and caudal vertebra should be identiied. The apical vertebra is determined to be the irst vertebra rotated to the concavity and the caudal vertebra is the last round to the concavity.
In the second stage, a line is drawn over the upper plateau of the apical vertebra and another line is drawn under the lower plateau of the caudal vertebra. If necessary, the lines can be traced over the pedicles instead of the plateaus.
In the third stage, two lines perpendicular to the irst one are drawn and the angle formed between them is the measurement of the scoliosis curvature.
Baropodometer
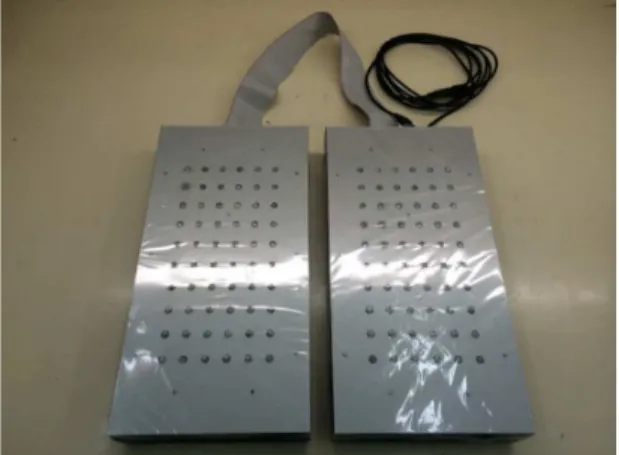
The equipment used to perform the baropodometry test was implemented at the Laboratory of Electronic Instrumentation and Biomedical Engineering (LIEB) from the Department of Electrical Engineering, UNESP - São Paulo State University, Campus of Ilha Solteira (Castro, 2016; Urban et al., 2014; Urban, 2015). It consists of two platforms, one for each foot, with a size up to 42, according to the company Podaly templates (Podaly, 2013). In each of the platforms, 60 commercial FSRs were installed, matricially arranged in 10 rows and 6 columns, and mechanically insulated with each other. The platforms were prepared with polycarbonate and Alurevest, with dimensions of 400 mm length, 200 mm width, 60 mm height, and 8.5 kg weight (Urban, 2015).
The signal conditioning, data acquisition, and interface circuits were placed inside the platforms, making the equipment portable and robust. The platforms do not have visible wires or elements that can cause discomfort to patients and are connected between them by means of a 40-wire ribbon cable. The equipment does not require batteries or external power supply because power is supplied by the Universal Serial Bus (USB) computer
port through the communication board that has the FT232 chip. A photo of the equipment is shown in Figure 1.
A 1-mm-thick ethyl vinyl acetate (EVA) ilm was placed on the platforms. This ilm aims to preserve the device hygiene and the patient’s comfort and to avoid that the patient’s worries about feet positioning, which could generate a false test result. In order to guarantee stability, protection to the volunteers, comfort, and a sense of security, an EVA structure was developed to be around the apparatus. The baropodometer with the EVA ilm and structure is shown in Figure 2.
During the examination, the volunteers remained on the equipment in an orthostatic position, with their arms along the body, looking forward, with an orientation to avoid any movement during the information gathering period. Each subject was evaluated for 120 s, with 60 s with eyes open and 60 s with eyes closed.
The sampling frequency used in the equipment was 20 Hz, allowing the evaluator to visualize the force distribution in the volunteers’ plantar region in real time.
Figure 1. Baropodometer.
The graphical interface used in the baropodometry examination was implemented in LIEB with the graphical programming language LabVIEW, which was chosen for its versatility, ease of graphic application development, and data processing (Castro, 2016). The implemented software has the application home screen, registration form, and data acquisition system. Figure 3 shows the data of force distribution in a patient’s plantar region obtained using the baropodometer.
To show the difference of weight distribution in plantar region between volunteers with different scoliosis degree, the images related to weight distribution of volunteer A and volunteer B, whose characteristics are shown in Table 2, are presented. Both were female and had approximately the same weight and laterality.
The data were exported to a spreadsheet, storing one ile for each volunteer. These data were the arithmetic means generated during the examination. As the volunteers had different weights, the data obtained from each volunteer were normalized according to the signal produced by the sensor where the maximum weight discharge was observed. Normalization was calculated by dividing all values of the data matrix by the highest value found. Thus, the values for all data were in the 0 to 1 range. This process was performed using MATLAB.
Neural network
After the normalization, it was possible to start neural network training. Training and network programming were performed in MATLAB. For the training, the following were informed:
• The quantity of samples supplied to the network; • The desired class formation (groups), providing
the ile name where the data are inserted and the data matrix address;
• The names of the classes;
• The desired outputs for each class formed; • The algorithm to be used;
• The error value;
• The number of iterations;
• The iles for a volunteer’s classiication.
Figure 3. Force distribution in a volunteer’s plantar region. AP: Anterior-Posterior; ML: Medial-Lateral.
Table 2. Some characteristics of volunteers A and B.
Parameter Volunteer A Volunteer B
Scoliosis degree 3 16
Body mass (kg) 52 50
Height (cm) 170 157
Laterality Right-handed Right-handed
The data extracted for the training were inserted in an array of 120 lines and one column, corresponding to 120 input neurons. The ANN used was a Single Layer Perceptron (SLP), with 121 inputs (including bias) and 1 output (0 or 1). The SLP is considered the simplest kind of feed-forward network, so backpropagation algorithm methodology can be used. The training inishes when the number of iterations reaches 1000 or a 0% error.
The algorithm was structured in the following sequence:
1. The training was initiated by presenting a pattern X to the network, which produced an output Y; 2. The error of each output was calculated,
corresponding to the difference between the desired value and the output;
3. The error to be propagated in the inverse sense was determined;
4. The weights of each element were adjusted; 5. Training was inalized when the number of
iterations was reached or until a pre-set error was reached.
When the training was inished, the network view was displayed.
The classiication objective was to test the accuracy of the electronic system’s in classifying patients in the class with scoliosis between 1° and 9° or those in the class with scoliosis between 10° and 19°. In this step, a desired output was not informed and the classiication response was based on training performed by the neural network.
Volunteer testing
With the electronic system implemented, training of the neural network was performed with 26 volunteers and classiication with 37 volunteers with scoliosis diagnosis.
In this study, only the main scoliosis curve was considered. All volunteers fall into Degree I according to the Ricard classiication (<20°). This group has the highest percentage of patients with scoliosis: those who do not need to wear vests or undergo surgery and whose treatment is performed via special physical exercise and frequent evaluations by health professionals. In this case, the use of a noninvasive technique to monitor the treatment, as described here, is of great relevance.
Neural network training
In the training, the net was divided into two classes, with class 1 (C1) being volunteers with scoliosis between 1° and 9° and class 2 (C2) being volunteers with scoliosis between 10° and 19°. Table 3 shows the number of volunteers used for training and classiication.
The neural network classiication accuracy is evaluated as proposed by Temurtas (2009) and described using the following equations:
( ) ( ), N
i i 1
i assess n classification accuracy N n N
N
=
=∑ ∈ (1)
( ) ( )
1if classify n nc assess n
0 otherwise
=
=
(2)
where N is the set of data items to be classiied (the test
set), n N∈ , nc is the class of the item n, and classify n( ) returns the classiication of n by neural networks.
Similarly, a group of 13 volunteers underwent several baropodometry tests in order to evaluate the classiication sensitivity of the system. They were asked to climb on the platforms and be free to choose the most comfortable position. The neural network classiication sensitivity, also called recall, was evaluated as proposed by Wafai et al. (2014) using the following equation:
%
TP Sensitivity 100
TP FN
= ×
+ (3)
where TP is the true positive set of data items correctly classiied and FN is the false negative set of data items wrongly classiied by the neural network.
Results
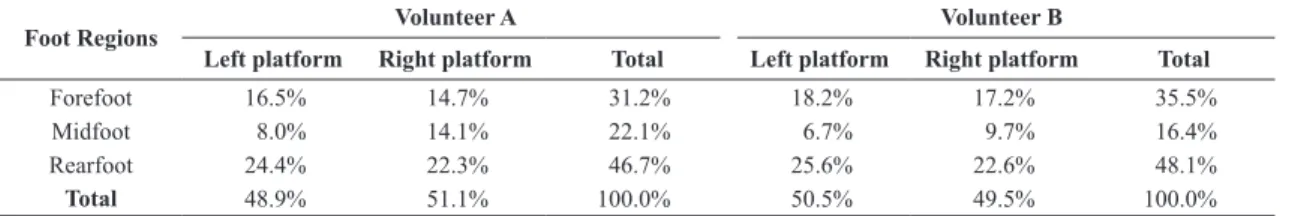
The images related to weight distribution in the plantar region of volunteers A and B are presented in Figure 4. It is possible to see the regions of greater and smaller discharge. In both cases, higher force is concentrated in the left hindfoot, but it is evident that the distribution of body weight is different in other areas of the plantar region of the volunteers. Table 4 shows the force distribution in plantar regions of volunteers A and B.
Table 3. Volunteers used for training and classiication.
Parameter C1 (1°-9°)
NV
C2 (10°-19°) NV
C1 + C2 TV
Training 13 13 26
Classiication 12 25 37
Total 25 38 63
The neural network training inished when the 0% error was reached (with 117 interactions). Training time was 2.6 s and classiication time was 7.5 ms for each volunteer.
Table 5 shows the results obtained in the tests performed to determine the sensitivity of the system in the classiication of 13 volunteers.
The mean classiication sensitivity was 93.7% in the C1 group and 94.5% in the C2 group. Table 6 presents data related to the classiication accuracy.
The classiication accuracy was 83.3% in the C1 group and 96.0% in the C2 group. The classiication accuracy of all the patients was 91.9%. Incorrect classiications
Figure 4. Force distribution in the plantar region of volunteers A and B.
Table 4. Force distribution in plantar regions of volunteers A and B.
Foot Regions Volunteer A Volunteer B
Left platform Right platform Total Left platform Right platform Total
Forefoot 16.5% 14.7% 31.2% 18.2% 17.2% 35.5%
Midfoot 8.0% 14.1% 22.1% 6.7% 9.7% 16.4%
Rearfoot 24.4% 22.3% 46.7% 25.6% 22.6% 48.1%
Total 48.9% 51.1% 100.0% 50.5% 49.5% 100.0%
Table 5. Artiicial neural network sensitivity.
Volunteer C1 C2
TP + FN TP Sensitivity (%) TP + FN TP Sensitivity (%)
1 5 5 100.0 7 7 100.0
2 6 5 83.3 5 5 100.0
3 5 4 80.0 6 6 100.0
4 5 5 100.0 5 4 80.0
5 7 6 85.7 5 5 100.0
6 7 6 85.7 5 5 100.0
7 4 4 100.0 6 5 83.3
8 7 7 100.0 6 6 100.0
9 5 5 100.0 7 6 85.7
10 5 5 100.0 6 6 100.0
11 6 5 83.3 5 4 80.0
12 5 5 100.0 5 5 100.0
13 4 4 100.0 3 3 100.0
Average 93.7% 94.5%
occurred in patients with scoliosis degree near the border between the classes.
Discussion
There is no way to ensure that in all tests, the volunteers remained exactly at the same place. It was observed that during the tests, some volunteers showed signs of fatigue and began to become restless during the last examinations; they were even oriented at the beginning of the examinations to remain as still as possible during the examinations.
By checking only the total weight discharge on each platform (left-right), we could observe that they are very close. In volunteer A, the value was 48.9% on the left platform and 51.1% on the right, while in volunteer B, it was 50.5% and 49.5% on each platform, respectively. On the other hand, on analyzing the weight discharge by foot regions, it could be noted that volunteer B discharged a greater percentage of weight on each forefoot (FF). In the same way, each midfoot (MF) of volunteer B had lesser weight discharge than that of volunteer A. Similarly, the weight discharge on each rearfoot (RF) was similar between them, although volunteer B discharged a little more percentage of weight on each RF than volunteer A. Thus, volunteer B who had a greater scoliosis degree discharged lesser weight in MF and carried this weight to FF. In this manner, it was conirmed that there is a difference in weight discharge through the feet according to the scoliosis degree. Thus, using ANN, it is possible to automatically classify scoliosis degrees according to force distribution on the plantar region of each volunteer.
The mean classiication sensitivity (93.7% in the C1 group and 94.5% in the C2 group) can be considered satisfactory. The classiication accuracy in the C1 group was worse than that in the C2 group, probably because the number of volunteers in the C1 group was lower than that in the C2 group.
In the bibliographic research, no study has been found that addresses the use of a baropodometer and ANNs to classify the scoliosis degree in patients.
The obtained results show that the implemented electronic system satisfactorily determines whether a patient with Degree I according to the Ricard classiication has a scoliosis degree ranging from 1° to 9° or from 10° to 19°.
Table 6. Classiication accuracy. NV: number of volunteers; TV: total volunteers.
Parameter C1 (1°-9°)
NV
C2 (10°-19°) NV
C1 + C2 TV
Correct 10 24 34
Incorrect 02 01 03
Total 12 25 37
Classiication accuracy 83.3% 96.0% 91.9%
The implemented system may contribute to the treatment of patients with a scoliosis degree ranging from 1° to 19°, which represents the highest incidence of this pathology, for which the monitoring of the clinical condition using a noninvasive technique is of fundamental importance.
Acknowledgements
The authors wish to acknowledge the support of Brazilian Councils CAPES and CNPq in this research.
References
Ajemba PO, Ramirez L, Durdle NG, Hill DL, Raso VJ. A fuzzy classifier approach to assessing the progression of
adolescent idiopathic scoliosis from radiographic indicators.
In: Proceedings of the Canadian Conference on Electrical and Computer Engineering; 2004 May 2-5; Niagara Falls, Ontario, Canada. USA: IEEE Conference Publications; 2004. p. 1467-70. http://dx.doi.org/10.1109/CCECE.2004.1349681. Almeida PO, Prudente GFG, Sá FE, Lima LAO, Moraleida FRJ, Cardoso KVV. Postural and load distribution asymmetries in preschoolers. Motri. 2015; 11(4):58-70. http://dx.doi. org/10.6063/motricidade.4033.
Alvarenga GM, Zizcycki CC, Kunhavalik E, Gamba HR. A
postura e o apoio plantar em idosas com escoliose no uso do
método pilates stúdio: resultados preliminares. In: Proceedings of the XXIV Brazilian Congress on Biomedical Engineering (CBEB); 2014 Oct 13-17; Uberlândia. Curitiba: CBEB; 2014. p. 2552-5.
Bienfait M. As bases da fisiologia da terapia manual. São Paulo: Summus; 2000.
Camilo CG Jr, Ueda MTM, Viana RF. Um sistema de auxílio
ao diagnóstico da escoliose baseado em realidade aumentada.
Revista Brasileira de Engenharia Biomédica. 2010;
26(3):185-93. http://dx.doi.org/10.4322/rbeb.2012.086.
Castro FR. Aprimoramento de um baropodômetro eletrônico e análise de estabilometria em voluntários com escoliose [dissertation]. Ilha Solteira: Universidade Estadual Paulista “Júlio de Mesquita Filho”; 2016.
Cordeiro TL, Duarte A, Collucci A, Frade M. Baropodometer
as a clinical tool for evaluating and following treatment of
Columna. 2009; 8(2):161-70.
http://dx.doi.org/10.1590/S1808-18512009000200011.
Folhadela NN, Mejia DPM. Utilização da técnica reeducação postural global (RPG) no tratamento da lombalgia Internet]. Manaus: Faculdade Ávila-Biocursos; 2012 [cited 2017 Jan 15]. Available from: http://portalbiocursos.com.br/ohs/data/ docs/32/63_-_UtilizaYYo_da_tYcnica_de_ReeducaYYo_ Postural_Global_RPG_no_tratamento_da_lombalgia.pdf Igwe P, Emrani M, Adeeb S, Hill D. Assessing torso deformity in scoliosis using self-organizing neural networks (SNN). In: Proceedings of the 7th International Conference on Machine Learning and Applications; 2008 Dec 11-13; San Diego, CA, USA. USA: IEEE Conference Publications; 2008. p. 497-502. http://dx.doi.org/10.1109/ICMLA.2008.68.
Kim H, Tan JK, Ishikawa S. Automatic judgment of spinal deformity based on back propagation on neural network. International Journal of Innovative Computing, Information and Control. 2006; 2(6):1271-9.
Lin H. Identification of spinal deformity classification with
total curvature analysis and artificial neural network. IEEE Transactions on Biomedical Engineering. 2008; 55(1):376-82. PMid:18232388.http://dx.doi.org/10.1109/TBME.2007.894831.
Mezghani N, Phan P, Mitiche A, Labelle H, De Guise JA. A computer-aided method for scoliosis fusion level selection by a topologicaly ordered self organizing kohonen network. In: Proceedings of the 20th International Conference on Pattern Recognition; 2010 Aug 23-26; Istanbul, Turkey. USA: IEEE Conference Publications; 2010. p. 4012-5. http://dx.doi. org/10.1109/ICPR.2010.976.
Podaly [Internet]. Brusque: Podaly Posturologia; 2013 [cited 2017 Jan 15]. Available from: http://www.podaly.com.br/2015/ Pontes S. Efeitos do método pilates no alongamento da cadeia posterior. Revista Nova Físio & Terapia. 2008; 60:23-4. Ramirez L, Durdle NG, Hill DL, Raso VJ. Prototypes stability analysis in the design of fuzzy classifiers to assess the severity of scoliosis. In: Proceedings of the Canadian Conference on Electrical and Computer Engineering. Toward a Caring and Humane Technology-CCECE; 2003 May 4-7; Montréal. USA: IEEE Conference Publications; 2003. p. 1465-8. http://dx.doi. org/10.1109/CCECE.2003.1226180.
Ricard F, Sallé JL. Tratamento osteopático da pelve. In: Ricard F, Sallé JL. Tratado de Osteopatia teórico e prático. São Paulo: Robe; 1996. p. 122-6.
Rosenthal MS. Escoliose: uma abordagem sensata. Baltimore: University of Maryland; 2008 [cited 2017 June 5]. Available from: http://quackwatch.haaan.com/escoliose.html
Schroth CL. Introduction to the three-dimensional scoliosis treatment according to Schroth. Physiotherapy. 1992;
78(11):810-5. http://dx.doi.org/10.1016/S0031-9406(10)60451-8.
Segura DCA, Nascimento FC, Chiossi CA, Silva MAA,
Guilherme JH, Santos JV. Estudo comparativo do tratamento
da escoliose idiopática adolescente através dos métodos de rpg e pilates. Revista Saúde e Pesquisa. 2011; 4(2):200-6. http:// dx.doi.org/10.17765/1983-1870.2011v4n2p%25p.
Temurtas F. A comparative study on thyroid disease diagnosis
using neural networks. Expert Systems with Applications. 2009; 36(1):944-9. http://dx.doi.org/10.1016/j.eswa.2007.10.010.
Toledo PCV, Mello DB, Araújo ME, Daoud R, Dantas EHM. Global Posture Reeducation effects in students with scoliosis. Fisioterapia e Pesquisa. 2011; 18(4):329-34. http://dx.doi. org/10.1590/S1809-29502011000400006.
Urban MFR, Sanches MAA, Kozan RF, Felão LHV, Bazani MA, Carvalho AA. Desenvolvimento de um protótipo de baropodômetro. In: Anais do XXIV Congresso Brasileiro de Engenharia Biomédica (CBEB); 2014 Oct 13-17; Uberlândia. Curitiba: CBEB; 2014. p. 2687-90.
Urban MFR. Implementação de um sistema eletrônico para avaliar a distribuição da força na região plantar de pacientes [thesis]. Ilha Solteira: Universidade Estadual Paulista “Júlio de Mesquita Filho”; 2015.
Wafai L, Zayegh A, Woulfe J, Begg R. Automated classification
of plantar pressure asymmetry during pathological gait using
artificial neural network. In: Proceedings of the 2nd Middle East Conference on Biomedical Engineering; 2014 Feb 17-20; Doha, Qatar. USA: IEEE; 2014. p. 220-3. http://dx.doi. org/10.1109/MECBME.2014.6783244.
Waller T, Nowak R, Tkacz M, Zapart D, Mazurek U. Familial
or sporadic idiopathic scoliosis–classification based on
artificial neural network and GAPDH and ACTB transcription profile. Biomedical Engineering Online. 2013; 12(1):1-14. PMid:23289769.http://dx.doi.org/10.1186/1475-925X-12-1.