DOI: http://dx.doi.org/10.1590/2446-4740.05316 Volume 33, Number 2, p. 105-112, 2017
Introduction
Drug delivery through respiratory route using inhalers has been applied in the treatment of diseases such as asthma, cystic ibrosis and other disorders of the respiratory tract (Siekmeier and Scheuch, 2008; Terzano and Allegra, 2002). The delivery of drugs directly into the alveoli by nasal or oral inhalation has the advantage
of being a simple non-invasive procedure. The deposition of micro-droplets in the alveoli is primarily related to its size, however. For instance, micro-droplets greater than 5.0 μm of diameter are unable to pass through the throat and vocal cords - the upper airways (Coates and O’Callaghan, 2006). Micro-droplets between 0.5 and 5.5 μm in diameter are considered ideal for proper deposition in the lower airways, more speciically in the pulmonary alveoli (Yang et al., 2008).
Inhalers are used to deliver drugs via the respiratory route. Among the different classes of inhalers, one inds nebulizers, that are electric powered devices used to create a suspension of droplets, allowing the administration of drugs directly into the alveoli (Amirav and Newhouse, 2012; Hardy et al., 1993; Patton and Byron, 2007). Such devices can also be divided into atomizer jet nebulizers and ultrasonic nebulizers.
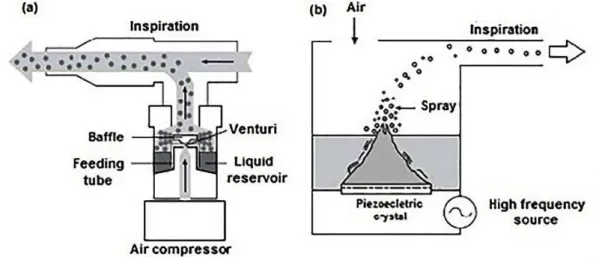
Atomizer jet nebulizers produce aerosol. When a low of solution combined with a stream of air or oxygen passes through a small oriice (Venturi), it causes an
Performance evaluation of nebulizers based on aerodynamic droplet
diameter characterization using the Direct Laminar Incidence (DLI)
Luciana Martins Pereira de Araújo
1*, Paulo José Abatti
1, Walter Duarte de Araújo Filho
2,
Rafael Fabrício Alves
31 Graduate Program on Electrical Engineering and Industrial Informatics, Federal University of Technology - Paraná, Curitiba,
PR, Brazil.
2 Department of Exact and Earth Sciences, Bahia State University, Salvador, BA, Brazil.
3 Laboratory of Thermal Sciences, Federal University of Technology - Paraná, Curitiba, PR, Brazil.
Abstract Introduction: Optical microscope images can be useful to evaluate nebulizers considering the size of droplets produced by these devices. From this perspective, the proposed method was compared to the classic concept of Mass Median Aerodynamic Diameter (MMAD) for the ideal droplet size between 0.5-5.5 µm. Methods: We tested
a sample of ive home nebulizers sold on the Brazilian market. A high-speed camera coupled to a microscope
obtained images of the droplets during the nebulization process, which allowed us to characterize the diameter of the aero-dispersed droplets. The Count Median Aerodynamic Diameter (CMAD) was used as measurement parameter.
Results: The images obtained during the nebulization process with the ive different nebulizers provided data to
determine the frequency distribution of the aero-dispersed droplet population. Successive images were obtained in the range of 2.0s to evaluate the dynamic behavior of the droplets. The generated data also allowed the elaboration
of histograms emphasizing the ideal diameter range of droplets between 0.5 and 5.5 μm. Conclusion: The Direct Laminar Incidence (DLI) model using digital image processing technique allowed the characterization of respirable particles. This model proposes the creation of a range of optimum absorption of the droplets by the respiratory tract. Although there is a technical limitation in the direct acquisition of images due to the depth of focus, presenting an error of 9.3%, the described method provides consistent results when compared to other droplets characterization techniques. Thus, the authors believe that Direct Laminar Incidence (DLI) is a viable method to assess the performance of nebulizers despite the requirement of adjustments and possible improvements required to minimize measurement errors.
Keywords Droplets, Nebulizers, Direct laminar incidence.
This is an Open Access article distributed under the terms of the Creative Commons Attribution License, which permits unrestricted use, distribution, and reproduction in any medium, provided the original work is properly cited.
expansion that generates an abrupt pressure drop and a sudden magniication in velocity. For a Bernoulli Effect, the liquid in the reservoir is sucked and aerosols are generated. The largest droplets are retained in especially arranged shields and join the rest of the luid in the reservoir, whereas the smallest are inhaled. More than 99% of the particles may be returned to the liquid reservoir (Hess, 2000). The residual aerosol is channeled into a pipe and delivered to the patient’s airways.
Ultrasonic nebulizers have a piezoelectric crystal immersed in a tank containing a solution. When the crystal produces ultrasonic vibration, the solution stored in the tank is converted in suspended micro-droplets (Chan and Lippmann, 1980; Greenspan, 1996). Figure 1 shows the two types of nebulizers.
It is also important to emphasize that the effective administration of drugs into the respiratory tract requires that the size of micro-droplets (particularly those in the range 0.5-5.5 µm) remains constant during inspiration. Usually it is considered that 2.0 s are required for normal quiet inspiration (Guyton and Hall, 2006). Therefore, in order to evaluate the performance of nebulizers, it is mandatory to devise means of determining the fraction of droplets in the ideal range (between 0.5 and 5.5µm) and if the droplets size remains constant for at least 2.0s.
Currently, according to Mitchell and Nagel (2004), the most commonly used methods to characterize the nebulizers are based on Laser Diffraction (LD), Cascade Impact (CI), Time Aerodynamics Flight (TOF) and Phase Doppler Particle Size Analysis (PDA).
Laser Diffraction (LD) devices, such as the Malvern Mastersizer (Malvern Ltd, Malvern, UK), emit a laser beam that passes through the aerosol cloud. The capacity of a particle to diffract light is inversely related to its diameter. Therefore, detecting the amount of diffracted light allows the computation of micro-droplets size
distribution. It is important to observe that all particles produced by the nebulizer and passing through the laser beam are measured whether or not containing drug (Kwong et al., 2000).
Cascade Impactor (CI) is based on the inertial behavior of the aero-dispersed particles. An air stream contains particles that are accelerated through the nozzle of the nebulizer. In sequence, the particles are deposited abruptly on a collection plate. An air stream causes the particles to change direction brusquely. Due to particles high inertia, the air stream causes the larger particles to precipitate on the collection plate. The passage of the particles by many successive collection plates gives a deposition with increasingly smaller fractions. Separation is based on the differences in inertia that depends on the size of the particles and their speed. Each plate receives fractions of particles with the same inertia. The fractions can then be classiied according to the distribution of size (Nichols et al., 1998; O’Callaghan and Barry, 1997).
Aerodynamic particle size analyzers based on Time Aerodynamic Flight (TOF) determine the aerodynamic particle size distribution of aerosols generated by nebulizers. This technique is based on the time delay of the velocity of particles suspended in relation to the speed of the air molecules surrounding them. During this process, the period taken for the individual particles to move between the two light beams is accurately measured.
Phase Doppler Particle Size Analysis (PDA) is a method consisting of a coherent light source (laser), an optical transmission device, signal processing and data analysis, and storage. A scattered light intensity proile is detected as individual particles passing through a series of interference fringes formed from laser beams that intersect and deine a measurement volume. Several detectors positioned at different scattering angles are used to sample slightly different spatial portions of
the light signal scattered by the particle. A two-phase shift detection system transmits information about the particle diameter, content and shrinkage features of the geometry. PDA has a wide range for dynamic size, from 0.3 to 8.0µm, with accuracy of 5%.
The devices employed to characterize nebulizers using the methods mentioned previously are usually calibrated by optical microscopy (Mitchell and Nagel, 2004).
This paper aims to present a method to measure the diameter of droplets generated by nebulizers in misting procedures by means of Direct Laminar Incidence (DLI). This paper also evaluates the morphological proile of the droplets in the period of normal inspiration, corresponding to 2.0s.
Methods
The sample consisted of ive home nebulizers of different brands chosen at random, three atomizer jet nebulizers (AJN) and two ultrasonic nebulizers (US), all of them acquired in Brazil.
The experimental procedure was carried out in ambient temperature of 22 °C, atmospheric pressure 102.1kPa, and 68% air relative humidity. The proposed technique (Direct Laminar Incidence - DLI) directly
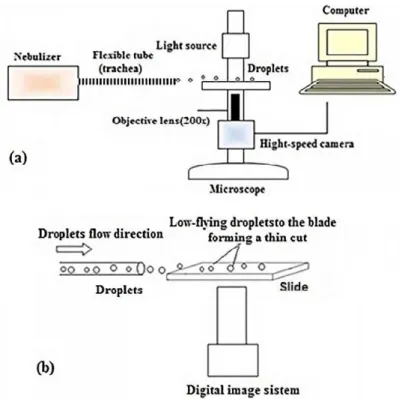
focuses the spray stream produced by the nebulizer and deposited on the surface of a slide in an inverted tri-ocular microscope, (Axiovert - Carl Zeiss Microscopy, Germany) at a magniication of 200x, coupled to a high-speed camera (Fastec - Model 5 4G San Diego, CA. USA). Laminar low aerosol (Reynolds Number (Re) < 2000) is deposited on the slide using a lexible tube (trachea), which is attached to the nebulizer. This method replicates the same conditions observed in a common nebulization procedure. In the process, the mist is led through the tube driven by an additional air stream produced by the nebulizer The droplets are photographed at 200 fps (frames per second) during 2.0s while they low-ly over the slide forming a thin cut, resulting in an amount of 400 images. The aerosol consisted of a population of droplets from a 0.9% saline solution commonly used in inhalation procedures. The droplets size has been quantiied by a stage-micrometer (Edmund Optics 30-101. USA), with the smallest division of 100 µm and error estimate of ± 3%. The system has been calibrated using polyamide micro spheres of known sizes (20 µm) presenting a maximum error (probably due to lens focusing range) of ± 9.3%. Figure 2 shows a schematic diagram of the experimental apparatus used to evaluate the performance of the nebulizer.
Figure 2. Schematic diagram of the experimental apparatus for evaluating the nebulizers’ performance. (a) General coniguration. (b) Aerosol
A MATLAB® program was developed to process the experimental data – image pre-processing, identiication of droplets and measurement of diameter. Image processing was performed by comparing a standard image, in the absence of droplets, to another image that shows droplets particles, and highlighting the different regions on the standard image. The regions found during the processing are analyzed individually to determine, through its shape, if they are corresponding to droplets. At this stage, overlapping or partially under scale stage-micrometer droplets are eliminated.
Each droplet-identiied pixel has its diameter (DP) determined based on the occupied area in pixels (AP):
4 P P
A
D =
π (1)
The result, in pixels, is then multiplied by a conversion factor (CF) [µm/pixel]) to obtain the diameter in µm (D):
P F
D=D C (2)
The conversion factor (CF) is the ratio between a known length in stage-micrometer (LSM) and the quantity of equivalent pixels in the image (LP):
SM F
P
L C
L
= (3)
The images were acquired with a resolution of 1200 x 1520 pixels, resulting in the lower division-stage micrometer (100 µm) to be equivalent to approximately 250 pixels in the image. The smallest possible value to be measured in the image (corresponding to 1.0 pixel) i.e. 0.4 µm. Considering [µm] and [pixel], it is possible to reach the conversion factor [µm/pixel]. These parameters are inherent to the focal depth of the objective lens and to the stage-micrometer, used as a reference. The calibration of the measuring instrument (optical assembly) was determined by taking a polyamide microsphere of known diameter (20 µm) as reference. After successive measurements and statistical treatment, we obtained a maximum uncertainty of 9.3%. All experimental measurements were performed using the same focal length and the same microscope objective lens. Each trial was performed on a clean microscope slide in the absence of deposited condensed droplets.
Results
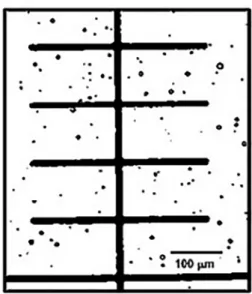
Figure 3 shows a typical image of droplets obtained during the data acquisition process, using the nebulizer E, with a magniication of 200X, and acquisition rate of 200 fps.
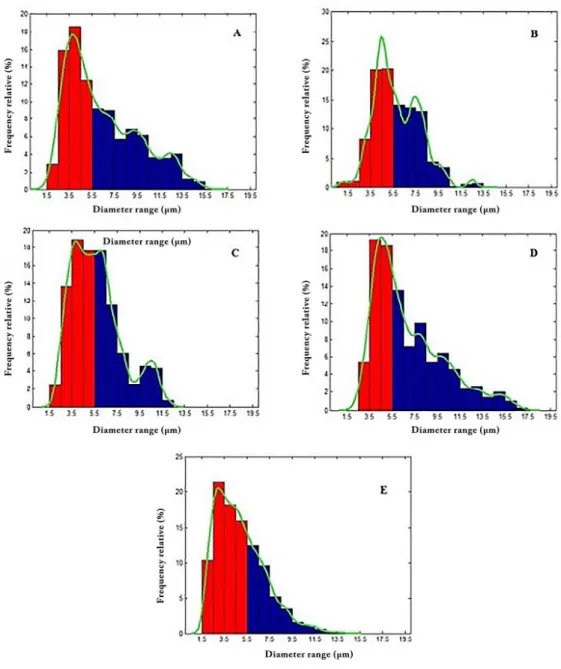
Figure 4 shows the histograms of relative frequency of the droplets in relation to the diameter range. For each of the nebulizers tested, we considered 400 images taken during 2.0s. The highlighted line (green) is the Kernel Density Curve (CDK). In statistics, the estimate of the Kernel Density Curve is a non-parametric way to estimate the probability of a random variable density function. This is a fundamental tool in data smoothing that infers on the population surveyed based on a inite data sample (Chen, 2015; Wolters, 2012).
Column (a) of Table 1 shows the MMAD reference number informed by each nebulizer manufacturers on their respective instruction manual. No additional information on the method or technique used in determining MMAD values were provided. The nebulizer E in the same column only informs the diameter range (0.5 to 10 µm), without specifying technique or the parameter used to obtain the measure. Column (b) shows relative frequencies of droplets whose diameters are within the ideal range, i.e., between 0.5 and 5.5 µm. Column (c) shows median diameters of droplets for each nebulizer with the CMAD parameter. The CMAD parameter is the median of the droplets, i.e., it characterizes the amount of 50% of droplets being above average and 50% of the droplets being below the average. It does not take into account the mass of the droplet, because the measure is directly performed from the images using purely geometric parameters.
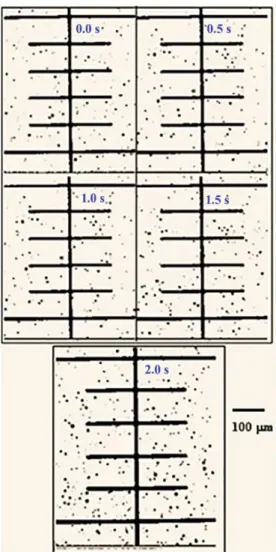
Figure 5 shows the time proile of the aerodynamic diameter of the droplets generated by nebulizer E. It is noted that there is no perceptible change in droplet size
Figure 3. Image of the micro-droplets obtained during the data
acquisition process using the nebulizer E, with an increase of 200X,
and an acquisition rate of 200 fps. The droplet diameter measurement
Figure 4. Relative frequency histogram of droplets in relation to the diameter produced by nebulizers A, B, C, D and E. The columns in red indicate
the optimum range of diameters (0.5-5.5 μm). The highlighted line (green) is the Kernel density curve (CDK).
Table 1. (a) Information provided by instruction the data sheets of the nebulizers investigated, and the MMAD parameter (Mass Median Aerodynamic Diameter) as a reference – no additional information on the method or technique used to determine the values was provided; (b) The relative
frequencies of droplets whose diameters are within the ideal range (0.5-5.5μm); (c) Median diameters of droplets for each nebulizer with the CMAD
parameter (Count Median Aerodynamic Diameter) as a reference associated with the measurement technique DLI.
Nebulize (a) Manual Information MMAD (μm) (b) Percentage of droplets in the ideal range (%)
(c) CMAD (μm) DLI
technique
Nebulizer A (JN) 4.9 52.2 5.4
Nebulizer A (JN) 3.8 49.8 5.5
Nebulizer A (JN) 4.0 50.2 5.5
Nebulizer A (JN) < 5.0 41.9 5.9
Nebulizer A (JN) *0.5 to 10.0 65.8 4.5
over the 2.0s time interval for the same temperature, pressure and solute concentration. The CMAD parameter value is not signiicantly altered during this interval, as shown in Table 2. This demonstrates that the droplets maintain the physical and morphological features almost unchanged.
Table 3 shows the characterization of the diameter of droplets using PDA (Aerometrics), TOF (Aerolizer), LD Spraytec (Malvern Instruments), by means of MMAD (Mitchell and Nagel, 2004).
Discussion
Boer et al. (2002) presented a critical review about the techniques of Cascade Impactor (CI) and Laser Diffraction (LD), showing the pros and cons of the two techniques in theoretical and practical points of view. The authors report that, among the advantages of Laser Diffraction technique over Cascade Impactor, are the method used for data acquisition of different classes of droplets sizes, the relevant drug fraction for lung deposition, the short measurement time, the size distribution measurement as function of inhalation time and the automatic data recording. In spite of this, microscopy is the only method in which the individual particles are observed and measured (Coates and Sharon, 1998) – hence, considered an absolute method of analysis of the size of particles. In fact, as already mentioned, tests of devices using Cascade Impactor (CI) and Laser Diffraction (LD) are irst calibrated using optical microscopes (Mitchell and Nagel, 2004). Therefore, it could be concluded at irst glance that digital processing of microscopy images of the aerosol produced by nebulizers would give unquestionable result. Optical microscopy results, however, are best suited for the size range between 0.8 and 150.0µm, depending on the wavelength of the light source. A practical lower limit of 3.0µm is often quoted. Based on this, we tried to develop an alternative measurement technique using microscopy as a direct source of measurement, were the digital image processing is associated to Direct Laminar Incidence (DLI). Analyzes of the experimental results show:
1. The performance of nebulizers in relation to the delivery of droplets in the ideal range of diameters using the DLI technique associated with CMAD parameter varies among devices (Table 1). Each nebulizer afforded the delivery of more than 40% of the droplets; in the optimal range reaching 65.8% (E nebulizer). The data presented in the irst column of Table 1 represents the MMAD values of each nebulizer supplied by the instruction manuals, without any information about the methodology or technique used in obtaining the measures. Assuming that the population of Figure 5. Time proile of the aerodynamic diameter of the droplets
generated by nebulizer E. The images were taken at intervals of 0.5s.
Table 2. Proile for the evolution of the droplets diameter in the time
interval 0-2.0s. CMAD does not undergo signiicant change during this
time interval, which demonstrates that the droplets remain with physical and morphological features almost constant.
Time (s) CMAD (μm)
0.0 4.5
0.5 4.7
1.0 4.3
1.0 4.4
2.0 4.9
Table 3. Characterization of droplet aerodynamic suspensions using PDA (Aerometrics), TOF (Aerolizer), LD Spraytec (Malvern Instruments) – measuring parameter: MMAD (adapted from Mitchell and Nagel (2004) – Particle size of aerosols from medical inhalers).
Measuring technique MMAD (μm)Nebulizer 1 MMAD (μm)Nebulizer 2
PDA (Aerometrics) 4.9 3.7 TOF (Aerolizer) 6.4 5.4
LD Spraytec
droplets generated by the nebulization process has a high degree of polydispersity, it can be concluded that the performance of the investigated nebulizers approaches, as promised, the numbers indicated in the manuals;
2. Histograms of frequency drops relative to the diameter produced by each of the investigated nebulizers, provides a richer characterization of the population of aero-dispersed droplets. The characterization is performed by droplet diameter ranges highlighting the ideal region (red columns in Figure 4), i.e., the population of droplets with diameters between 0.5 and 5.5µm, as shown in the third column of Table 1; 3. Combining the data presented in the histograms
to the information shown in the third column of Table 1, enables the observation that each nebulizer has a different behavior regarding the delivery of droplets in the ideal range, besides having different parameter values CMAD. This may be associated with the design of each project-studied equipment;
4. Time proile of the aerodynamic diameter of the droplets generated by nebulizer E shows no perceptible visual change comparing the morphology and size of the droplets (Figure 5). The calculation of the instantaneous CMAD for each picture corroborates the statement (see Table 2) and the percentage of rated measurement error was around 4.3%;
5. It should be noted that all measures of the diameter of the droplets found using the DLI technique has an intrinsic error of ± 9.3%. This is most probably due to the depth of the focal length of the objective lens. Besides, it is possible that, during the process of image acquisition, some droplets appear in more than one image due to superposition. However, since the quantitative analyses were implemented over a set of 400 images, with a considerable quantity of droplets, it is believed that superposition errors have been reduced considerably. Despite this, in order to attenuate the limitations that appear during the process to achieve total reliable results, it is necessary to improve the statistical method; 6. MMAD parameter and CMAD values vary for
each device researched when using the technique of Laminar Direct Impact (DLI), as indicated in Table 3;
7. The average diameter of the droplets generated by the screened nebulizers using the CMAD parameter associated with Direct Laminar Incidence (DLI) (Table 1) reaches values very close to those cited in Table 3, showing the viability of the described technique for quantitative characterization of the diameter of the aero-dispersed droplets;
8. Direct Laminar Incidence (DLI) is viable alternative for the characterization of aero-dispersed droplets since it does not require sophisticated and expensive equipment, which makes it very competitive in relation to other measurement techniques;
9. The histograms presented show that the delivery of droplets in the optimal range varies from nebulizer to nebulizer. This inding indicates that the choice of the speciic equipment may present an advantage over any other in respect of therapeutic response during treatment. As previously presented, the result depends on the proportion of droplets in the ideal range, i.e., between 0.5 to 5.5 μm. This inding may serve as basis to the oficial regulatory organizations develop a more reliable protocol for quality assessment of nebulizers.
As previously mentioned, the use of microscopy to characterize the diameter of the aero-dispersed droplets can play an important role in evaluating the performance of nebulizers in the treatment of respiratory tract disorders. Microscopy is the only technique that can directly measure the diameter of the droplets by means of captured images. In addition, Direct Laminar Incidence (DLI) allows for the characterization of aero-dispersed droplet diameter in time intervals, emphasizing the optimal droplet diameter range, constituting an important parameter to evaluate the dynamic behavior of nebulizers in the generation of droplets, thereby affecting the response of the therapeutic treatment.
Acknowledgements
The authors acknowledge the inancial support of CAPES and thank Prof. Dr. Thomaz Aurélio Paggioro from UTFPR who allowed them to perform part of the experiments in his laboratory.
References
Amirav I, Newhouse MT. Deposition of small particles in the developing lung. Paediatric Respiratory Reviews. 2012; 13(2):73-8. PMid:22475251. http://dx.doi.org/10.1016/j. prrv.2011.05.006.
Boer AH, Gjaltema D, Hagedoorn P, Frinjlink HW. Characterization of inhalation aerosols: a critical evaluation of cascade impactor analysis and laser diffraction technique. International Journal of Pharmaceutics. 2002; 249(1-2):219-31. PMid:12433450.
http://dx.doi.org/10.1016/S0378-5173(02)00526-4.
Chan TL, Lippmann NM. Experimental measurements and
Chen S. Optimal bandwidth selection for kernel density functionals estimation. Journal of Probability and Statistics.
2015; 2015:1-21. http://dx.doi.org/10.1155/2015/242683.
Coates AL, O’Callaghan C. Drug administration by aerosol in children. In: Chernick V, Boat TF, Willmont RW, Bush A. Disorders of the respiratory tract in children. Philadelphia: Saunders-Elsevier; 2006. p. 268-79.
Coates AL, Sharon L. Drug administration by jet nebulization. Pediatric Pulmonology. 1998; 26:412-23.
Greenspan BJ. Ultrasonic and electro hydrodynamic methods for aerosol generation. In: Hickey AJ, editor. Inhalation aerosols: physical and biological basis for therapy. New York: Marcel Decker; 1996. p. 313-35.
Guyton AC, Hall JE. Textbook of medical physiology.
Philadelphia, Pennsylvania: Elsevier Inc.; 2006.
Hardy JG, Newman SP, Knoch M. Lung deposition from four nebulizers. Respiratory Medicine. 1993; 87(6):461-5. PMid:8210617. http://dx.doi.org/10.1016/0954-6111(93)90074-A.
Hess DR. Nebulizers: principles and performance. Respiratory Care. 2000; 45(6):609-22. PMid:10894454.
Kwong JWT, Ho SL, Coates AL. Comparison of nebulized particle size distribution with Malvern Laser Diffraction analyzer versus Andersen Cascade Impactor and Low-Flow Marple Personal Cascade Impactor. Journal of Aerosol Medicine. 2000; 13(4):303-14. PMid:11262437. http://dx.doi. org/10.1089/jam.2000.13.303.
Mitchell JP, Nagel MW. Particle size analysis of aerosols from medicinal inhalers. Kona Powder and Particle Journal. 2004; 22:32-65. http://dx.doi.org/10.14356/kona.2004010. Nichols SC, Brown DR, Smurthwaite M. New concept for the variable flow rate Andersen Cascade Impactor and calibration data. Journal of Aerosol Medicine. 1998; 11(Suppl 1):S133-8. PMid:10180726.
O’Callaghan C, Barry PW. The science of nebulized drug
delivery. Thorax. 1997; 52(Suppl 2):S31-44. PMid:9155849.
http://dx.doi.org/10.1136/thx.52.2008.S31.
Patton JS, Byron PR. Inhaling medicines: delivering drugs to the body through the lungs. Nature Reviews. Drug Discovery. 2007; 6(1):67-4. PMid:17195033. http://dx.doi.org/10.1038/ nrd2153.
Siekmeier R, Scheuch G. Systemic treatment by inhalation of
macromolecules – principles, problems, and examples. Journal
of Physiology and Pharmacology. 2008; 59(Suppl 6):53-79. PMid:19218633.
Terzano C, Allegra L. Importance of drug delivery system in steroid aerosol therapy via nebulizer. Pulmonary Pharmacology & Therapeutics. 2002; 15(5):449-54. PMid:12406667. http://
dx.doi.org/10.1006/pupt.2002.0386.
Wolters M. Methods for shape-constrained Kernel density
estimation [dissertation]. London, Ontario, Canada: The
University of Western Ontario; 2012.