ISSN 0104-6632 Printed in Brazil
www.abeq.org.br/bjche
Vol. 33, No. 01, pp. 73 - 90, January - March, 2016 dx.doi.org/10.1590/0104-6632.20160331s20140016
*To whom correspondence should be addressed
Brazilian Journal
of Chemical
Engineering
THE EFFECT OF SYSTEM TEMPERATURE
AND PRESSURE ON THE FLUID-DYNAMIC
BEHAVIOR OF THE SUPERCRITICAL
ANTISOLVENT MICRONIZATION PROCESS:
A NUMERICAL APPROACH
R. A. Almeida
1*, R. V. P. Rezende
2, V. F. Cabral
1, D. Noriler
3, H. F. Meier
3,
L. Cardozo-Filho
1and F. A. R. Cardoso
41
Department of Chemical and Food Engineering, State University of Maringa, 87020-900, Maringá - PR, Brazil. Phone: + 55 (44) 30253034; + 55 (44) 98897070
E-mail: [email protected] 2
Department of Chemical and Food Engineering, Federal University of Santa Catarina, 88040-970, Florianópolis - SC, Brazil.
3Department of Chemical Engineering, Regional University of Blumenau, 89030-000, Blumenau - SC, Brazil.
4
Department of Mathematics, Federal Technological University of Paraná, 87301-005, Campo Mourão - PR, Brazil.
(Submitted: August 25, 2014 ; Revised: February 25, 2015 ; Accepted: March 19, 2015)
Abstract - The Supercritical Antisolvent (SAS) technique allows for the precipitation of drugs and biopolymers in nanometer size in a wide range of industrial applications, while guaranteeing the physical and chemical integrity of such materials. However, a suitable combination of operating parameters is needed for each type of solute. The knowledge of fluid dynamics behavior plays a key role in the search for such parameter combinations. This work presents a numerical study concerning the impact of operating temperature and pressure upon the physical properties and mixture dynamics within the SAS process, because in supercritical conditions the radius of the droplets formed exhibits great sensitivity to these variables. For the conditions analyzed, to account for the heat of mixture in the energy balance, subtle variations in the temperature fields were observed, with almost negligible pressure drop. From analyses of the intensity of segregation, there is an enhancement of the mixture on the molecular scale when the system is operated at higher pressure. This corroborates experimental observations from the literature, related to smaller diameters of particles under higher pressures. Hence, the model resulted in a versatile tool for selecting conditions that may promote a better control over the performance of the SAS process.
Keywords: Supercritical Antisolvent; Nanoparticles; Mathematical modeling; Intensity of segregation; CFD.
INTRODUCTION
The supercritical state of a mixture is obtained when its temperature and pressure are above their
74 R. A. Almeida, R. V. P. Rezende, V. F. Cabral, D. Noriler, H. F. Meier, L. Cardozo-Filho and F. A. R. Cardoso
Brazilian Journal of Chemical Engineering cosmetics, and food industries as alternatives to
tra-ditional fine powder production.
Among such techniques, one can highlight: the RESS - Rapid Expansion of Supercritical Solutions technique and its variants such as RESOLV, RESSAS (Türk and Bolten, 2010), and the SAS technique (Supercritical Antisolvent) and some variants such as SEDS, GAS and PCA (Bałdyga et al., 2010; Jerzy et al., 2004; Martín et al., 2007).
In the RESS techniques, the solute must be solu-ble in the supercritical fluid (SCF). They are charac-terized by a pre-expansion chamber where the mix-ture of solute and the SCF are pressurized and then expanded through a convergent-divergent nozzle causing a sudden pressure drop and the precipitation of the solute.
The SAS technique, which is the object of this study, is used as an alternative when the solute of interest is not soluble in the SCF and such technique requires that the organic solvent possess a greater affinity for the antisolvent than for the solute. This technique generally makes use of CO2 and allows the processing of a large variety of high quality indus-trial products (Martín et al., 2007; Sanguansri and Augustin, 2006). An organic solution of solvent/solute and the CO2 enter continuously through a coaxial capillary into a pressurized precipitation chamber pre-charged with antisolvent (CO2). The solution interacts with the antisolvent, increasing the diffu-sion in the organic antisolvent mixture and causing the precipitation of the solute.
Among its applications, we highlight the develop-ment of biomedical materials based on prolonged liberation mechanisms, such as nanoencapsulation applied to vaccine production, allergy and even can-cer treatment, e.g. (Balcão et al., 2013; Cushen et al., 2012).
In a supercritical mixture, physical properties such as density, and thermodynamic parameters such as solubility may be adjusted within a wide range of processing conditions through varying pressures, flow rate, and temperatures. The rapid transfer of mass that occurs upon injecting a solution into a fluid such as CO2 under supercritical conditions is characterized by an elevated diffusivity and low vis-cosity. Such characteristics are considered beneficial to precipitating tiny spherical particles from the so-lute (on a nanometric scale) and necessary for their industrial application.
There are several key operational SAS parameters such as: solution and antisolvent flow rates; injection capillary length and diameter; chamber geometry;
operational pressure and temperature (T0 and P0); these last two have been reported in the literature as being of special importance. More specifically, near the critical point of the mixture, the droplets formed exhibit high sensitivity to the thermodynamic coordi-nates T0 and P0, which have great influence on the morphological changes of the precipitated substances (Reverchon et al., 2008; Werling and Debenedetti, 2000).
With respect to the variation of particle size, con-tradictory behavior can be found in the relevant liter-ature. For example, increased operational pressure of the system may result in gains (Franceschi, 2009), losses (Miguel et al., 2006), or in practically no no-ticeable impact upon the precipitated particles (Chang et al., 2008). As to increases in operational temperature, some solutes diminish in size while others expand. These discrepancies among results depend on the physical nature of the solute and re-quire further and more profound study (Erriguible et al., 2013b).
Modulation of the operating pressure and tem-perature directly influences the variation of density. In turn, this influences the dimensions or the sizes of the precipitated particles, which thus depend upon the differences in density between regions rich in organic solvent and CO2-rich regions.
Concerning density differences, Werling and Debenedetti (2000) utilized toluene as an organic solvent and CO2 as an antisolvent and reported an increase in size of the particles when the solvent is denser than the antisolvent; otherwise, the particles decrease in size. This indicates a faster mass transfer from the solution to the surrounding CO2.
The Effect of System Temperature and Pressure on the Fluid-Dynamic Behavior of the Supercritical Antisolvent Micronization Process 75
Brazilian Journal of Chemical Engineering Vol. 33, No. 01, pp. 73 - 90, January - March, 2016 numbers of very small particles that accompany flow
in the precipitation chamber (Jerzy et al., 2004). This changes the way in which light passes through the flow, since the density variation may interfere with refractive indices and cause delay associated with non-homogeneity in the mid-section (Raffel et al., 1998).
Experimentally, with respect to the influence of T0 and P0 upon the size and formation of particles, one knows that: increased temperature keeping all other variables constant (solvent and CO2 flows, pressure, and chamber geometry) increases the ten-dency to agglomerate; irregular particles (Boschetto, 2013), expanded microparticles and fibers, as well as increased particle size prevail (Reverchon and De Marco, 2011). It has also been shown that pressure increases favor obtaining smaller sized particles and a narrower distribution of sizes, given that, with in-creased pressure, the intermolecular distances dimin-ish, in turn augmenting CO2 density (viz. Table 1). The difference in density between pure ethanol and pure CO2 decreases which results in a better mixture between the solution and the SCF, forming smaller particles (Boschetto, 2013; Franceschi et al., 2008; Reverchon et al., 2007). Contradictorily, according to Franceschi (2009) the increased pressure can re-sult in larger particles when low levels of solvent and CO2 flow rate are considered, as well as low initial concentration of solute in the organic solvent.
Thus, given the experimental complexity, the use the numerical simulation arises as a suitable alterna-tive to determine the influence of operational pa-rameters in the fluid dynamic behavior of flows within the SAS process, increasing its performance. This is an innovative approach concerning the FSC precipitation process, and it demands low cost and has the advantage of obtaining satisfactory results over a short time period (Bałdyga et al., 2010; Martín and Cocero, 2004; Sierra-Pallares et al., 2012; Werling and Debenedetti, 2000).
The numerical studies employing Computational Fluid Dynamics (CFD) seek to find appropriate con-ditions for spherical particle precipitation on a nano-metric scale (Bałdyga et al., 2010; Cardoso et al., 2008; Erriguible et al., 2013b). However, within this scope there remains a lack of specific publications referring to the influence of operational temperature and pressure parameters upon the dynamics of the supercritical mixture. Some authors do consider the SAS process in the isothermal regime (Cardoso et al., 2008; Erriguible et al., 2013a; Martín and Cocero, 2004), while others have emphasized the
influence of temperature variation (Jerzy et al., 2004; Sierra-Pallares et al., 2012).
In this sense, Martín and Cocero (2004) describe the SAS process according to a two-dimensional isothermal regime approach, modeling it as a turbu-lent mixture employing the standard k-ε turbulence model of completely miscible fluids, coupled to a model that predicts particle growth. In so doing, they evidenced that the flow rates and the mixture dynam-ics strongly influence the precipitation that occurs in an environment of great compositional variance.
Sierra-Pallares et al. (2012) also proposed a two-dimensional and non-isothermal mathematical model coupled with a populational balance equation (PBE) associated with a closure model for the micromixing to describe particle sizes of β-carotene and con-cluded that temperature is quickly homogenized upon capillary exit. In that region there is approxi-mately 4 K of variation; the flow pattern near the capillary exit is determined by the solution injection velocity; and the vortex generated in this region pro-motes the formation of intense mixture and is responsible for the mixture on macro scales.
Based on a non-isothermal approach coupled with a PBE and comparing with experimental data, Henczka and Shekunov (2005) pointed out the im-portance and better accuracy of models to predict particles sizes that consider the micro-mixing when compared to simulations that do not consider this physical process.
According to Erriguible et al. (2013b) in their study on the influence of pressure in subcritical con-ditions, increasing pressure has moderate impacts upon viscosity and significant impacts upon mixture density. They conjecture that this effect tends to re-main under supercritical conditions. However, there are works in computational simulation which have modeled the SAS process in an incompressible re-gime (Cardoso et al., 2008; Erriguible et al., 2013a). Thus, the compressibility of the mixture in the pro-cess, as well as the impacts of pressure and tempera-ture upon physical properties and flow patterns, has not yet been sufficiently examined and outlined.
76 R. A. Almeida, R. V. P. Rezende, V. F. Cabral, D. Noriler, H. F. Meier, L. Cardozo-Filho and F. A. R. Cardoso
Brazilian Journal of Chemical Engineering influence of these assumptions on the flow dynamics
or the size of the precipitated particles.
In particular, small diameter particle precipitation is directly associated with low viscosity (Bałdyga et al., 2010), and high levels of mixture diffusivity and thermal conductivity is required for proper thermal fields (Yamamoto et al., 2011). Thus, given the lack of relevant literature references concerning this as-pect, it becomes important to investigate the influ-ence of T0 and P0 upon these properties.
Given viscosity, thermal conductivity, and the dif-fusivity coefficient in the region near the Critical Point of the Mixture (CPM) as well as where 1 < Trm
< 1.5 and P > Pcm (as the conditions considered in
this study), pressure exerts an effect on the mixture viscosity, which may diminish with increased tem-peratures. Increases in thermal conductivity in the supercritical mixture also showed themselves to be particularly sensitive to increases in pressure and diminished with temperature increases. The diffusivity coefficient is significantly affected by variations in mixture composition and high pressures with respect to the ideal gas condition (Poling et al., 2004). Thus, in typical supercritical conditions, it is important to investigate if the fluidynamic modeling of the SAS process requires consideration of adequate models in order to describe the mixture's physical properties.
In this work a mathematical model is presented to describe the SAS process fluid dynamics coupled to the turbulence model k-ε. Initially, based on Peng-Robinson's cubic equation solution, this study pre-sents the density dependence of the mixture with respect to incremental pressure and temperature vari-ations around their operational values. Then, based on the model's solution, the influence of values P0 and T0 on transport properties and upon the dynamic of flow of the binary mixture of CO2 and ethanol was analyzed. In such analysis, the process is operated in the region of the phase diagram above CPM. In this region the mixture is found as a single phase. Finally, analysis is provided concerning the sensitivity to T0 and P0 on a molecular level.
METHODOLOGY
The model is represented by the system of Equa-tions (1)-(19) in order to describe the flow from the SAS process in steady state, considering it as com-pressible, non-isothermal, and in the turbulent re-gime because the transition from a laminar jet to a turbulent jet occurs at low Reynolds numbers
(Silveira-Neto, 2002). Under the conditions con-sidered in this study: Re300 for the ethanol inlet and Re1500 for the CO2 inlet. ANSYS FLUENT 13.0 software was used to solve the system of equa-tions. The chamber utilized in this study has cylindri-cal geometry and couples with a capillary tube in the center of the lid in a coaxial system in order to inject the ethanol and CO2. A two-dimensional axis-sym-metric approach was considered due to the geoaxis-sym-metric circumferential symmetry, with a non-uniform carte-sian mesh composed of 115.5 thousand of elements. A preliminary comparison with a three-dimensional approach employing a tetrahedral mesh with ap-proximately 4.2 million elements presented a pro-hibitive computational effort in a serial run due to computational time. In a parallel run, with 5 parti-tions of a cluster, it took almost 90 hours when com-pared with the two-dimensional mesh, which took 16 hours in a serial run on a single Intel [email protected] CPU and 4GB of RAM memory.
Equation of State PVT
The density of the CO2 and ethanol mixture was described by the Peng-Robinson equation of state (PREOS), employing the van der Waals quadratic mixing rule.
( ),m
m m m m
a RT
P
V b V V b b V b
(1)
where P is the absolute pressure, V [m3 mol-1]is the molar volume, T is the temperature, am and bm are the
PREOS mixing parameters calculated using the fol-lowing rule of mixture:
,
,
m i j ij
i j
m i j ij
i j
a y y a
b y y b
(2)where i j,
1, 2 , yi is the mole fraction ofcompo-nent i and the parameters aij and bij are calculated
using the following combination rules:
1 ,
1 , 2
ij i j ij
i j ij
ij
a a a k
b b l
b
The Effect of System Temperature and Pressure on the Fluid-Dynamic Behavior of the Supercritical Antisolvent Micronization Process 77
Brazilian Journal of Chemical Engineering Vol. 33, No. 01, pp. 73 - 90, January - March, 2016
kijand lijare the binary interaction parameters. Here,
the following literature values obtained from (Franceschi, 2009) were used: k12=0.0703 and l12= -0.0262. In the above equations, aiand bi are the
pa-rameters of the pure species. These papa-rameters were determined using:
0.45723553 2 2 ,0.07779607 ,
i i i
i
i i
i
R Tc a T
Pc
Tc b
Pc
(4)
with
22
,
0.37464+1.54226 - 0.26993
1 1
, i
i
i
i i
i
k Tr
T
k
(5)
where Tc and Pc are the critical temperature and pressure of species i, respectively; Tri T Tci is the reduced temperature; and i is the acentric factor of species i.
Viscosity
Each component's viscosity was calculated for each T0 and P0 as displayed in Table 1 based on Chung's rule as described by Chung et al. (1988). Chung's method takes density and high pressures into consideration. The mixing rule given by Equa-tion (6) (Bałdyga et al., 2010) was employed in order to obtain the mixture viscosity.
2
2
, yCO yethanol
m T P CO ethanol
. (6)
Thermal Conductivity
To calculate the thermal conductivity of the
mix-ture, km[W m K1 1] , Chung's method was used (Chung et al., 1988), as it considers density at high pressures and viscosity at low pressures:
0 2 1/22 2
31, 2 1
, ,
m
k T P Ay qBy Tr G
M G
(7)
where M is the molecular weight of the mixture,
0
[Pa s. ]
is the low pressure viscosity; ωm the
acen-tric factor of the mixture and cv is the heat capacity at
constant volume; R is the universal constant for gases; yVc V6 with Vc being the critical volume of the mixture in [cm3 mol-1]. The factors
c Rv, , m, ,T Tc
, q q T M V
c, , c
, G2G y D2
, i
are correction functions described in Chung et al. (1988), and Di are functions dependent on themix-ture's acentric factor, as well as a correction factor for polar substances as described in Poling et al. (2004).
Diffusivity
According to Riazi-Whitson's equation (Riazi and Whitson, 1993), one can determine the diffusivity coefficient. This relationship, which considers vis-cosity of the mixture µmas in Eq. (6), density of the
mixture at low ρ0 and density of the mixture at high pressures ρ, is given by:
0 0
1,2 , 1.07 0 ,
rm
b cP
m
m
D D T P
(8)
where b 0.270.38m and c 0.05 0.1 m ,
1 1 2 2
m
Pc x Pc x Pc and mx1 1 x22. Here x1 and x2 are the mole fractions of ethanol and CO2, respectively. Also, in Eq. (8) Pcm is the critical
pres-sure of the mixture, D0 is the diffusivity coefficient of the mixture at low pressure. For simplicity, the mixture density at high pressures was established using Eq. (1), setting the operational pressure and the temperature to be T0 and P0 for each case of Table 1 and varying the mixture composition. Then, each case was described by a sixth-degree polynomial as a function of the CO2 mole fraction obtained by poly-nomial interpolation.
Governing Transport Equations
With the intent to describe the SAS process, a model based on the mass-weighted Reynolds-aver-aged Navier-Stokes equations (RANS) was proposed. Some fundamental assumptions can be taken into account to correctly describe the fluidynamics of the formed jet and the mass transfer:
the supercritical fluid phase under turbulence conditions can be represented by the mass-weighted Reynolds-averaged Navier-Stokes equations (mass-weighted RANS);
78 R. A. Almeida, R. V. P. Rezende, V. F. Cabral, D. Noriler, H. F. Meier, L. Cardozo-Filho and F. A. R. Cardoso
Brazilian Journal of Chemical Engineering
there is a complete miscibility between the or-ganic solvent and antisolvent;
the eddy viscosity hypothesis is assumed; energy and chemical species balance equa-tions were included;
a Newtonian fluid was considered.
It is convenient for compressible flow, to consider the density-weighted Favre average. Given a ϕ flow
variable, one considers ( )x ( )x
, where
represents the Reynolds temporal average for den-sity. The field variable can be decomposed as the sum of its mean value and its fluctuation
" '
(Wilcox, 1993), Based on the hy-potheses presented above, the conservation equations are given as follows:
Continuity Equation
0, ii
u
x
(9)
where represents the density of the mixture and
i
u are the velocity vector coordinate.
Momentum Balance Equation
'
,
i j ij
j j j
u u P
x x x
(10)
where the term ij represents the Reynolds stress
tensor and 2
3 j i
ij eff ij
j
k
i k
u
u u
x x x
. The
effective viscosity is defined as eff T, where T
is the eddy viscosity given by the turbulence
model; ' 2
3
P P k and P is the static pressure (gauge pressure); it is the difference between of the absolute pressure and operating pressure, Pabs
0 gauge
P P ; k is the turbulent kinetic energy.
Total Energy Balance Equation
i
eff K K h
j j j K
u h T
K h J S
x x x
(11)
where h is the enthalpy of mixture, ,
ref
T
p T
h
c dTwith Tref 273.15K . kT is the turbulent thermal
conductivity with kT cp T PrT and PrT 0.85 is the turbulent Prandtl number, Keff kmkT is the
effective thermal conductivity and Jk is the diffu-sive flux of the species. In this study, the energy vari-ation due to the mixture enthalpy varivari-ation is ac-counted for in Eq. (11) by the source term Sh (Jerzy
et al., 2004):
1
1 1
. m
i
h m
i
Q Y
S u Y Q
Y x
(12)
The dependence of mixture heat Qm with the
con-centration is calculated using the Peng-Robinson equation. Sh is inserted as part of the energy equation
in a subroutine as a user defined function (UDF) (ANSYS, 2010).
Chemical Species Balance Equation
j
eff
i T i, ,j j j
i Y T
u Y D D
x x x T
(13)
where Yi is mass fraction of the iih specie,
1,2 ,
eff T
D D D D1,2 is the molecular diffusivity
coefficient, T T T
D Sc
is the turbulent diffusivity
coefficient, ScT is the turbulent Schmidt number
equal to 0.7. The turbulence model incorporates two differential transport equations into the resulting system of equations, one is for turbulent kinetic en-ergy k and the other is for the dissipation rate of tur-bulent kinetic energy ε (Wilcox, 1993), for the k-ε
turbulence model T k2 . In Eq. (13) DT i, is the thermal (Soret) diffusion coefficient of the iih specie.
Transport equation for the mixture fraction
j
eff
i ,j j j
i
u f D
x x x
f
(14)
The Effect of System Temperature and Pressure on the Fluid-Dynamic Behavior of the Supercritical Antisolvent Micronization Process 79
Brazilian Journal of Chemical Engineering Vol. 33, No. 01, pp. 73 - 90, January - March, 2016
2 2
2
,
, ,
,
CO CO
sol CO
Y
Y Y f
Y
(15)
where Y,CO2 and Y,solare the mass fractions of CO2 in the CO2 inlet and in the solvent inlet, respectively.
Mixture fraction variance, 2, can be understood as the deviation from the locally perfect mixture state, that is, the mixing process can be understood as the dissipation of such variance(Fox, 2003; Jerzy et al., 2004). The transport equations 2 are consid-ered and inserted into the system of equations as user defined scalar –UDS - transport equations (ANSYS, 2010). Such equations are given, respectively, by:
Transport equation for the mixture fraction variance
2
22
2
2 2 .
i
i
e
S j
j f j
f
T
u
D
x x x
f D
x k
(16)
The term Sin Eq. (16) was entered via a subrou-tine as a UDF in the ANSYS FLUENT software.
The k-ε turbulence model transport differential equations based on turbulent viscosity are (Launder and Spalding, 1974):
Turbulent kinetic energy equation k
j
Tk
j j k j
ku k
P
x x x
(17)
and
Dissipation rate of turbulent kinetic energy ε
2
1 2 .
j T
j j j
k
u
x x x
C P C
k k
(18)
In Eqs. (17 and (18) Pk is a production term of
turbulence due to the viscous forces; the constants,
1 1.44, 2 1.92,
C C C 0.09, k 1.0 , and 1.3
are closure constants found based on the correlation of experimental data. All mathematical derivations and the physical basis of the model can be found in detail in Rezende, R. V. d. P. (2008).
Operational Conditions and Boundary Conditions Operational temperature values were considered in the range of 308 - 320 K. Operational pressure P0 was tested at 80 bar and 120 bar per conditions dis-played in Table 1. The values for density calculated using the Peng-Robinson equation employed in Eq. (8) of the diffusivity coefficient and the values calcu-lated for pure component viscosities, using the Chung method for Eq. (6) of the mixture viscosity are also listed in Table 1.
Under all cases, inlet boundary conditions con-sidered were operating temperature T0 and mass flows rate: 1.1x10⁻⁴ kg/s for CO2 and 1.2x10⁻⁵ kg/s for ethanol and the outlet boundary condition was considered to be zero pressure. Turbulence intensity was considered to be 5% (medium intensity) as the inlet and outlet boundary conditions.
Table 1: Operating conditions (T0, P0), density values, and viscosity values for the pure components.
Case T0 [K] P0 [bar] CO2[kg/m3] Ethanol [kg/m
3
] CO2[Pa.s] Ethanol [Pa.s]
1 308.00 80.00 419.44 716.78 3.51x10⁻⁵ 4.68x10⁻⁴
2 308.00 120.00 741.54 718.55 5.35x10⁻⁵ 4.77x10⁻⁴
3 313.00 80.00 291.50 712.98 2.94x10⁻⁵ 4.38x10⁻⁴
4 313.00 120.00 682.66 714.86 4.896x10⁻⁵ 4.45x10⁻⁴
5 315.00 80.00 273.31 711.44 2.86x10⁻⁵ 4.26x10⁻⁴
6 315.00 120.00 657.26 713.36 4.72x10⁻⁵ 4.35x10⁻⁴
7 317.00 80.00 259.40 709.87 2.81x10⁻⁵ 4.15x10⁻⁴
8 317.00 120.00 630.84 711.84 4.56x10⁻⁵ 4.23x10⁻⁴
9 320.00 80.00 243.19 707.49 2.753x10⁻⁵ 3.99x10⁻⁴
80 v ar st to N ca in w T m v u o d F si w IC p at d re n th ta re F in 0
In order to alues was ca ry condition tabilization o o the other te
Numerical M The SAS c al tank 120 m nto considera well as the a The chamber mm long in t ent inlet 0.01 ring 0.1 mm f the bottom iameter.
Figure 1: Vi ional capilla work - with th
Based on t CEM 13.0 so
osed of 115 ted after a m evelopment esolution. Th
ot cause mo he jet shape. ails of the m egion.
Figure 2: Det n the capillar
R. A. Alme
o initialize th alculated bas ns; these init of the system ested initializ
Methodology chamber util mm long and ation the tw axis symmetr is coupled the center of 1 mm in diam m in diameter m of chamber
ew of the g ary tube used
he axis of sym
the geometry oftware, a tw .5x103 hexah mesh refinem region is str hus, given th odifications i In Figure 2 mesh refinem
tail of the he ry region.
eida, R. V. P. Rez
he equation s sed on the CO
tial conditio m of equatio zations condi
y
lized consist d 80 mm in d wo-dimension ry, as outline
with a coax f the lid with meter and a C r. The outlet r and measur
eometry of t d in the sim
mmetry.
y and employ wo-dimensio hedral eleme ment study,
rongly influ hat a greater
in the field 2, one can vi ment in the c
exahedral me
zende, V. F. Cabr
Brazilian Jou system, a set O2 inlet bou ons favored ns with resp itions.
ts of a cylind diameter, tak nal geometry ed in Figure ial capillary h a central s CO2 inlet me is in the cen res 3.45 mm
the two-dim mulations of t
ying the ANS onal mesh co
ents was gen because the enced by m
refinement variables or isualize the capillary out
esh refinemen
al, D. Noriler, H.
urnal of Chemica t of nd-the pect dri-king y as e 1. 20 sol- eas-nter m in men-this SYS om- ner-jet esh did r in de-tput nt to FL sis var to seg pre cri (R clo dif rat Fig gat and ing to tia (A mo cie tiv (m De Di tio
F. Meier, L. Car
al Engineering The finite v solve the sy LUENT 13.0 sted of solvin riable one at non-lineariti gregated solu The SIMPL essure-veloci iteria were im RMS) of less
osure for m fferences bet tes were of th
gure 3: Solu ted solver (A
The solutio d presented g the comple obtain conv ally adding Almeida, 2013 Step 1 - on omentum eq es transport e Step 2 - if c Step 3 - onc vate the equ mixture fractio
RES ensity Depen ifferentials
The Peng-R ons (1)-(5)) w
rdozo-Filho and F
volumes met ystem of Equ 0 software. T
ng the resulti t a time, upda
ies and coup ution scheme LE algorithm
ity coupling mposed, a R s than 10-5 mass balance
tween the in he order of |1
ution schem ANSYS, 201
on proved co instability u ete system of vergence of t equations i 3):
nce converge quations is re equations;
onverged, ac ce these field uations invo
on, mixture f
SULTS AND ndence on Te
Robinson cu was employe
F. A. R. Cardoso
thod was ap uations (1)-( The segregate
ing linear sys ating their co pling among
e is shown in m was used g. Because Root Mean S
for all the e was obse nlet and out 10-11|.
me employed 0)
onvergence t upon simulta f equations. I the solution in the follo
ence of the c eachead, act
ctivate the ene ds present co
lving the o fraction varia
D DISCUSSI Temperature
ubic flow eq ed in order t
pplied in ord (18), using th
ed solver co stems for eac oefficients du variables. Th n Figure 3. d to solve th
convergen Square residu
variables an rved, i.e, th tlet mass flo
by the segr
to be difficu aneously sol It was possib upon seque owing mann
continuity an tivate the sp
ergy equation nvergence, a ther variabl ance). ION and Pressu quation (Equ to predict ho
se v it C d an se re te b ± dP o re ti v fe op The Effec
ensitive the d ariations in ts operationa Considering t T d P
nd the Taylo
P0 dP T, 0
Substitutin econd order esult can be w
P0 dP T, 0
Maintainin emperature v er, the densi ± 30 kg/m3. O
P = ± 7 bar, f ± 8.8 kg/m espectively. A ional temper
ariation thre erential of 7 perational pr
Figure 4 temperatu
ct of System Tem
Brazili density of the
pressure an al values T0 = that: P dP T
r series expa
0 , i dT Y dT ng Eq. (19) i and higher writen as:
0 0dT Y, i ng Y100.1, varies dT = ± ity differentia On the other
, it would pr m3, as shown
As such, 7 K ature (T0 = 3 ee times gre bar, which i ressure (P0 =
4: Variation ure variation
mperature and Pres
ian Journal of Ch e mixture ρ i nd temperatu = 313 K and
, dT
ansion of ρ:
00 0
( , , i )
P
P T Y d
T o T
nto Eq. (20) order terms
0
0 0
(P T Y, , i
, one observ ± 7 K within
al would sub hand, if the roduce a den n in Figure 4 K represents 313 K) and c eater than th itself represe = 120 bar). T
(a) of dρ [kg/m s of ± 7 K. (b
ssure on the Fluid
hemical Engineer is to differen ure surround d P0 = 120 b
(
2 2
, . T dP P dP dT (2 , neglecting in Eq.(20),
)d. (2 ves that, if
the SAS cha bsequently v pressure var nsity differen
4 (a) and (b 2.2% of ope causes a dens he pressure d ents 5.8% of
Thus, given E
m3] for mass b) With incre
d-Dynamic Behav
ring Vol. 33, No. ntial ding bar. 19) 20) the the 21) the am-vary ries ntial b) ), era-sity dif-the Eq. (21 sen tha tio the bar me sity inc tem op tem ter Jet Op tur ial tha sur inj inc ent ite the po pro 20 ho fraction of emental pres
vior of the Superc
01, pp. 73 - 90, 1), knowing nsitive to tem an to compar
This assert ons of Y100
e range of T r). At lower ental contrib
y is still sma cremental co
Thus, if the mined solute
erational pre mperature va rminant of mi
t Dinamics pening Angl In order to v re angle of th l capillary ob at predicted rrounding fl
ected towar creases its m
trainment. T d and, within e chamber b rtion of the obability for 09) due to t mogeneities
f ethanol wit ssure variatio
critical Antisolve
January - March
0 0 0
(P T y, , i)
mperature ch rable alteratio tion remains
0.4 and oper T0 (280 - 325 r operationa bution of pre aller than thr ontribution.
e condition e were T0 < essure requir ariation withi ixture density
le of the Jet: validate and he jet formed btained in th
in literature uid, draggin rds its own mass flux. T The boundary
n this region brings surro chamber in w r particle nu the appearan
.
(b) th Y1= 0.1: ons of ± 7 bar
ent Micronization
h, 2016 , the density hange within ons in pressu s consistent rational con 5 K) and P0 l temperatur essure to the ree times the
for precipita 325 K, eve rement (70 -in the chamb y than pressu
: Model Veri verify the m d at the outle his study was e. A jet inte ng the fluid center and, This process y of the jet be
, the fresh so ounding CO2 which there ucleation (Pe nce of comp
)
(a) With in r.
n Process
is much mo n the chamb ure.
for compos nditions with
(70 bar - 22 res, the incr e mixture de e temperature
ation of a d n with a hig - 220 bar), th ber is more d ure variation.
ification model, the ape
et of the coa s compared racts with th in which it in so doin s is known ecomes delim olvent enterin
n-82
fo g p (2 th F T T p F cr tu p h
In te
2
From entr or turbulent
rees) for cir rofile follow 2013). In the he jet was de Figure 5 and The aperture Table 1 was ap rofile of the Figure 5. Reg reasing press ude of the v erature, there ave been obs
nfluence of erns of the S This study
Figure 5: 2013) and
Figure 6: With highe
R. A. Alme
rainment the jets foresee rcular nozzl ws that desc e cases consi
efined based the aperture angle obtai pproximately e jet was al garding the v sure there w velocity and, e was an incr served by (Re
Pressure a Solvent Jet y found that
Comparison d that obtaine
Influence o er pressure th
eida, R. V. P. Rez
ory, the ana s an apertur les. The Gau cribed by C
dered here, t d on the velo e angle was ined for eac y 12o. The Ga lso observed velocity of t was a decreas , with the in rease in veloc eitz Cardoso
and Temper
there is a g
n between th ed though thi
(a)
f pressure on here is a mor
zende, V. F. Cabr
Brazilian Jou alytical solut re of 11.8o ( ussian veloc Cushman-Roi the boundary ocity profiles then obtain ch condition aussian veloc d, as shown the jet, with
e in the mag ncrease of te city. These fa et al., 2013)
ature the P
gradual incre
he solution j is study at 80
n the solven re deep pene
al, D. Noriler, H.
urnal of Chemica tion
(de-city isin y of s in ned. n in
city n in
in- gni- em-acts
.
Pat-ease
in i.e of tio len sur
Te
int thr the em tio in ser 80 the as
et aperture a 0 bar and 313
nt jet length tration of the
F. Meier, L. Car
al Engineering the length a ., a small in
the capillary onal pressure
ngth of the je re of 120 bar
emperature V Variations o to considera rough the mi e energy equ mployed, the on of approxi all the simu rted into the
bar, there w e chamber im
can be seen
as described 3 K.
at T0 = 320 e fluid stream
rdozo-Filho and F
and in the w crease amou y tube with e (Figure 6)
et of solvent r) was obtain
Variations of energy in t ation during
ixture heat so uation balanc
chamber tem imately 1.4 K ulated cases
energy equa was an averag
mmediately a in Figure 7 a
in the litera
(b)
K. (a) P0=8 m into the ch
F. A. R. Cardoso
width of the j unt of ethano an increase ); the greate t (observed u ned with T0 =
the form of h the precipit ource term a ce. When this mperature su
K at the capi . When this ation under p
ge reduction after the capil and Figure 8
ature (Cushm
0 bar; (b) P hamber.
jet of ethano ol in the outl
of the oper est increase under the pre = 320 K.
heat were take tation proce associated wi s term was n uffered a vari illary tube ex
term was i pressure at P0 in T of 5 K llary tube ex
(a).
man-Roisin,
P0=120 bar. ol, let
ra-in
es-en ess ith not ia-xit in-0 =
th ab ex se
op af a se m T sm
The Effec
Figure 7: capillary X
Figure 8: 120 bar.
When the here is a tem bove T0 imm xit, with a su een in Figure
Thus, ther perating the fter the mixt homogeniz erved, which mately T0 valu These tempe mall, may s
ct of System Tem
Brazili Temperature X/L ~ 0.15).
Temperature
pressure is s mperature inc
mediately fo ubsequent 1 e 8 and Figur re is greater t process at lo ture region l zation of the
h remains con ue within the erature vari significantly
mperature and Pres
ian Journal of Ch e variation t
(a)
e variation a
set to P0 = 1 rease of app ollowing the K fall below re 9 (b). temperature ower pressure
ocated at the e temperatur nstant at a le e remainder iations, tho interfere w
ssure on the Fluid
hemical Engineer hrough the c
t the end of t
20 bar, initia proximately 1 e capillary tu w T0, as can
variation wh e. In both cas e capillary e re field is evel of appro
of the chamb ough relativ with the dens
d-Dynamic Behav
ring Vol. 33, No. central axial
the capillary
ally 1 K ube n be
hen ses, exit, ob- oxi-ber. vely sity
fie int var CO nu abl
tio for of the nu nu
vior of the Superc
01, pp. 73 - 90, line of the c
y: (a) T0 = 308
eld, as obser teferer in the
riations occu O2 in the so ucleation regi
les that gover Figures 8 (a ons at the en
r the two pre cooling out e border of th ucleation rate ucleation.
critical Antisolve
January - March chamber at P
(b)
8 K P0 = 80 b
rved in the p e precipitatio ur within the lvent jet, wh ion and temp rn the rate of a) and (b) sh nd of the cap essures condi of the center he jet. Accor e is inversely
ent Micronization
h, 2016
P0 = 80 bar (
bar; (b) T0 =
previous sect on mechanis e entraining hich is the m perature is o f nucleation (M how the temp pillary tube. itions tested t r line of the rding to Mul y proportiona
n Process
(end of the
308 K P0 =
tion, and ma sms, since th region of th most probab
ne of the var Mullin, 2001 perature vari In this regio there are are
chamber, ne llin (2001), th al to the rate
83
ay he he ble
ri-). ia-on
84
P
si p la ca th
tu cu P b ti
F w
4
Pressure Var Under bot idered, P0 = ressure was ated. This v apillary, as s he chamber, The greate ube under bo urred at the Pressure varia
een well stud ion and grow
Figure 9: Pr within the cha
Figure 10 operating t
R. A. Alme
riations th operationa
80 bar and P approximate variation occ shown in Fig
no pressure v est presure v
oth operation lower tempe ations within died or relat wth of particle
ressure decr amber at P0 =
0: Density di temperature
eida, R. V. P. Rez
al pressure c P0 = 120 bar, ely 0.9 bar in
curred insid gure 9. Within
variations w variation insid
nal pressure erature studie n the SAS ca ed to the pro es in the liter
reases on th = 120 bar.
istribution in of 308 K.
zende, V. F. Cabr
Brazilian Jou conditions c
the decrease n all cases sim
e the inject n the interior ere recorded de the capill conditions ed, T0 = 308 amera have ocess of nucl
rature.
he central a
n the capillar
al, D. Noriler, H.
urnal of Chemica
on-e in mu-tion
r of d.
lary K. not
lea-axis
De
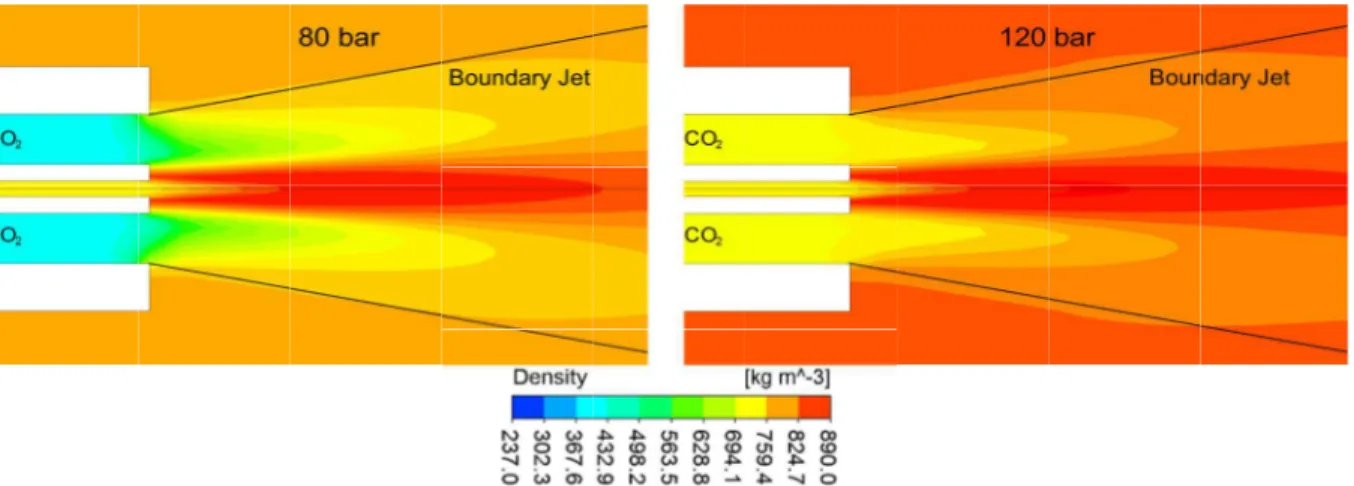
vo per ron Wh im den mo sur
sho lar ven nu Sh pu tim mu 20 gio cha (w the 10 thi ob del wi bil cho
ry exit for th
F. Meier, L. Car
al Engineering
ensity Varia Precipitatio lves a therm rcritical state nment with hen a solutio mmersed wit
nsity of the olecule of so
rrounding CO For lower p own in Figu ry); this decr nt resulting ucleation and hing, 2008). ure solvent an me of a drop
um droplet 00). For the on with the amber occur which are obs
e capillary ex for P0=80 is region the
served, as s limited the b th black line lity of nuclea on, 2011; Le
he two consi
rdozo-Filho and F
ation on employin modynamic eq
e mixture is regions of on containin thin this en e solvent wi
olute differs O2 (Braeuer e pressure, the ure 10 in the
reases the so in slower m d hence la If the diffe nd pure CO2 plet is short a
radius (W e conditions smallest den rred at P0=12 served appro xit) as shown bar and P0=
greatest tem shown in F boundary of es), where th ation occurre
ngsfeld et al
idered opera
F. A. R. Cardoso
ng supercriti quilibrium p a non-homo high and l g a solute an nvironment, ithin the reg s from the d et al., 2011). e CO2 densit external par olubility in th mass transfer, rger particle erence in de
2 is small, the and there is Werling and
under study nsity differen 20 bar at the oximately 6 n the compar =120 bar (no mperature vari Figure 8). F the jet (regio here is the g
nce (De Mar ., 2000).
ating pressur
ical fluid i problem. A s ogeneous env
low densitie nd a solvent the averag gion around density of th .
ty is lower ( rt of the cap he organic so
, slow rates es (Kim an nsity betwee e average lif
a small max Debenedet y here, the r nce within th e capillary ex mm ahead rison in Figu ote that with iation was al igure 10 al on highlighte greatest prob
rco and Reve
res and the
in- u- vi-es.
is ge a he
(as il- ol-of nd en fe- xi-tti,
re-he xit of ure hin so so ed
er-d in in th cr
P it
co T th
The Effec
With an in ensity reduc ndicated in g n Figure 11. he density o
reased T0.
Physical Prop ty and Diffu
Viscosity, oefficient of These three pr
he small regio
Figure 11
Figure 12 120 bar.
ct of System Tem
Brazili ncrease in t ces in the in graphs at the
In this case of the mixtu
perties: Visc sivity thermal cond the supercrit roperties pre on of the cap
1: Density of
: Viscosity o
mperature and Pres
ian Journal of Ch emperature nterior of th e center line
e, when P0 w ure was high
cosity, Therm
ductivity, and tical mixture
sented variat pillary injectio
f the mixture
of the mixtur
ssure on the Fluid
hemical Engineer
T0, the mixt he chamber, of the cham was at 120 b hest due to
mal Conduct
d the diffusiv were evaluat tion, but only on exit (1.5 m
e through the
re through th
d-Dynamic Behav
ring Vol. 33, No. ture
as mber
bar,
in-
tiv-vity ted. y in mm
len rem
Vi
var the bar Fig cap at ma res
e center line o
he central lin
vior of the Superc
01, pp. 73 - 90, ngth), remain mainder of th
scosity According riation, throu e temperatur
r and P0 = gure 12. The pillary tip (lo
X/L = 0.21 ainder of the sults in dimin
of the chamb
ne of the SA
critical Antisolve
January - March ning practical he interior of
to Chung's ugh the centr res T0 analyz 120 bar can ere is an abru ocated at X/
and stays co e length of th nished viscos
ber, at P0 = 8
AS chamber a
ent Micronization
h, 2016 lly constant t
the precipita
rule, molec ral line of th zed and pres n be seen in upt drop in v L = 0.15) w onstant throu he chamber. sity levels.
0 bar and P0
at P0 = 80 ba
n Process
throughout th ation chambe
cular viscosi he chamber f ssures P0 = 8 n the graph viscosity at th
hich stabiliz ughout the r Increasing
=120 bar.
ar and P0 =
85
he r.
ity for 80 in he zes
86 b w in v m ca re si D W te o tu ca su ti T p in b W It W u th d T in ob A th ra b i. re th p n ti ch je 6 From Figu ar, the visco with P0 = 120
n the density ariation of P made by Erri
al condition esults in m ignificant im
Diffusivity C The diffus Whitson's eq
emperature. I f the chamb ure can be s ases simulate ure from 80 ion in the ma
Thermal Con Thermal c resented littl nside the cha ar. At the pre
occur in W/K.m at T0 =
t suffered an W/K.m just i
nder all tem hroughout th
etailed in Fig
Turbulent Pr The k-ε tu nto account
btained with Analyses of
hermal cond atio, were pe
etween the e., DT D1,2 esults showe he condition
roperties con ear the cham ivity, for wh
hamber is al et boundary,
R. A. Alme
ure 12 under sity showed 0 bar. From y of the mix P0. These fa
guible et al. ns, increasin moderate imp mpacts upon m
Coefficient sivity coeffi quation, incre
Its variation ber interior d seen in the g ed, upon incr to 120 bar, t agnitude of th
nductivity conductivity,
le variation w amber for an
essure of P0 the injectio = 320 K and n abrupt decr in front of mperature co he remainder
gure 14.
roperties of urbulence mo
the effects o h the mathe
field variab ductivity rati erformed. Th turbulent an T m , ed that, for t s analyzed i ntributions ar mber walls, e hich the mo lso dominant
as shown i
eida, R. V. P. Rez
the operating a small decr Figure 11 a xture is obs acts confirm
(2013b) tha ng the oper pacts upon mixture dens
icient, accor eases with t
along the ce due to opera graph of Fig reasing the o there is a ve he diffusivity
according to with respect n operational
= 120 bar, g on capillary d 1.22 W/K.m
rease of appr the injection onditions and r of the cham
the Mixture odel was em of turbulence ematical mo bles: eddy v o and diffus hese variable nd molecular
T m
k k res
the cases of in this study re important except the th olecular cont
t in the initia in Figure 15
zende, V. F. Cabr
Brazilian Jou g pressure of rease compa large variat served with the conject at, in supercr rating press viscosity a sity.
rding to Ria the operatio entral axial l ational tempe gure 13. For operational pr ery small red
y coefficient.
o Chung's ru to temperat l pressure of greater values y, namely 1
m at T0 = 308 roximately 0 n capillary e d was const mber interior,
e
mployed to ta e on the resu odel present
viscosity ra sion coeffici es are the ra r contributio spectively. T
f Table 1 un y, the molecu t only on reg hermal cond tribution in al region of 5. Thus, for
al, D. Noriler, H.
urnal of Chemica f 80 ared tion the ture riti-sure and azi-onal line era-all res- duc-. ule, ture f 80 s of .02 8 K. 0.22 exit tant , as ake ults ted. atio, ient atio ons, The nder ular gion duc-the the the reg cap con cie ma Fig thr P0 Fig axi tip Fig rat for
F. Meier, L. Car
al Engineering gion of inter
pillary tube ntributions o ent of molec ass transport
gure 13: D rough the cen
= 120 bar (e
gure 14: Th ial line of th p X/L ~ 0.15)
gure 15: C tio in outlet r T0=313 K a
rdozo-Filho and F
rest for preci and on th of molecular cular diffusiv is due to tur
Diffusivity co ntral axial li end of X/L ~
hermal cond he chamber ).
ontours for of the capila and P0=120 b
F. A. R. Cardoso
ipitation (at t he border of r viscosity a vity are negl rbulence.
oefficient of ine of the SA
0.15).
ductivity alon at P0 = 120
the thermal ar region wh bar.
the exit of th f the jet) th and the coeff
ligible and th
f the mixtu AS chamber
ng the centr bar (capilla
l conductivi herekT km
tu p an T m so qu ti g g I el an m w A f f f in ca th in p fl p tu te ze ob se fo p m ro tu ar R The Effec However, urbulence an roperties (µm
nd P can be T0, P0 and of t
FLO In supercr mogenous mi olvent at a uestion to be ion and appr
rowth (Fox, iven by:
2 1 sI f
In Eq. (22 lements are nd is equal mixture is pe work, Is is ca
ANSYS CFD
f are known f 0.9999,
f
0, 1 . ntensity of sally on the he capillary n the magnit
lace where luids are no oor). After t ure is perfect Given the ensity of seg ero. Howeve bserved for een in Figur or the best m ressure. Hen molecular sca
oborating the ure that, unde re observed Reverchon an
ct of System Tem
Brazili other studie nd sensitivity
m, D1,2 and k
made in orde turbulence o OW DYNAM itical conditi ixture betwe molecular le e determined oximately sp 2003). The
, f 2), Is is equ
not mixed l to zero w erfect (Henc alculated in t
D-Post 13.0, n, assuming
because Is
For all s
segregation entire interio tube exit is tude of this
the mixing ot yet well this region, o t on a molecu pressure co gregation va er, they are
the pressur re 16. This mixture is obs
nce, there is m ale for high e experiment er higher pre d (Boschetto nd De Marco
mperature and Pres
ian Journal of Ch s using diffe y analyses of km) with inc
er to reevalu n the SAS pr
MICS: MIXT ions, the form en the solven evel is the m d in order to a
pherical nano intensity of
ual to unity well on a m when the m czka et al., the post-proc
when the va g a clip rang
s become s
imulated c
approaches or of the ch there a sign variable, be process beg mixed and one can affirm
ular scale. ndition P0 = alues also re
slightly hig e P0 = 120 indicates tha served at hig more efficien
er operating tal observatio essure, small
, 2013; Fra , 2011).
ssure on the Fluid
hemical Engineer erent models f the molecu crementals o
ate the effect rocess.
TURE mation of a nt and the an most import acheive nucl ometric parti f segregation
(2
when the fl molecular sc molecular sc 2005). In t cessing stage
ariables 2a ge of 0.000
singular wh
onditions,
zero in pra amber. Only nificant incre
ecause it is gins (where the mixture m that the m
80 bar, the emains close gher than th bar, as can at the tenden gher operatio
nt mixing at g pressure, c on of the lite er particle si anceschi, 20
d-Dynamic Behav
ring Vol. 33, No. s of
ular f T t of ho- nti-tant lea-icle n is 22) luid cale cale this e in and 1 hen the cti-y at ease the the e is mix- in-e to ose be ncy onal the cor- era-izes 009; Fig inj (b) ser the in ma of on tiv pre op in wi tio cha the era exc com
vior of the Superc
01, pp. 73 - 90,
gure 16: Int ection exit r ) At P0=120
rved.
In this stud e flow of a s non-isotherm anent regime
operating te n the properti vity and diff esents the ef erating press the SAS pro
There is an thin the pre on is restricte
anges influen e respective t ation of mix clusively up mposition is
critical Antisolve
January - March (a
(b
tensity of se region at T0=
bar, in whic
CONCL dy, a mathem
supercritical mal, compre e was emplo emperature a ies: density, fusivity. In ffect of oper sure upon th ocess.
n almost co cipitation ch ed to the inj nce much les temperature xture density
pon tempera s a good nu
ent Micronization
h, 2016 a)
b)
egregation at =308 K. (a) ch higher Is
LUSION matical mod
CO2 and et essible turbu oyed to evalu and the oper
viscosity, the so doing, th rating tempe he dynamics
onstant pres hamber, nam
jection capil ss the mixtur variations. T formulation ature and of umerical stra
n Process
t the capilla At P0=80 ba
values are o
del to describ thanol mixtu ulent and pe uate the effe rating pressu ermal condu his study al rature and th of the mixtu
sure variatio mely, its vari
88 R. A. Almeida, R. V. P. Rezende, V. F. Cabral, D. Noriler, H. F. Meier, L. Cardozo-Filho and F. A. R. Cardoso
Brazilian Journal of Chemical Engineering more effective SAS chamber modeling, deminishing
both computational time and computational effort. Regarding the jet boundary, the results were corroborated with analytical outputs comparing with the opening angle and the gaussian velocity profile given in the relevant literature. In all, these indicate the appropriate formulation of the proposed model.
When the heat of mixture term is added in the energy equation, the temperature distribution under-goes a greater variation (about 5 K) when the lowest operational pressure is considered. The greatest vari-ations of composition, temperature, and physical properties under consideration occurred within a small region that begins at the capillary exit.
The physical properties μm, km, and D1,2,
depend-ent upon T, P, and Yi, were considered. Turbulent
properties dominate the molecular properties in the process. With the turbulence model employed under the conditions considered, it was concluded that, in this case, it is possible to use less complex equations than Equations (7), (8) and (9) in the model, reducing the computational time, except for the thermal conduc-tivity under an operating pressure of 120 bar. Within the SAS chamber, based on the variable intensity of segregation, a good molecular scale mixture was observed for all conditions simulated, mainly at the higher operating pressure.
The model presented herein offers ease and speed in obtaining results using only a desktop computer, reducing the time and cost of laboratory experiments. The next steps of this work will be to apply the 3D approach, as well as a study on a larger scale of oper-ational conditions with variation of the inlet flow rate of CO2 and the inlet flow rate of solvent, and im-prove understanding of the effects of turbulence on the mixture process, as well as coupling with a model to predict the dynamics of particle growth. In so doing, greater understanding is to be gained concern-ing the precipitation mechanisms, experimental costs will significantly reduced, and the SAS process be-come more efficient.
ACKNOWLEDGEMENTS
The authors would like to thank the Coordination for Improvement of Higher Education Personnel-CAPES (www.capes.gov.br) for granting financial support to the first author, enabling the development of this work.
NOMENCLATURE cv Heat capacity at constant volume
[J mol-1K-1]
D1,2 Molecular diffusion coefficient of the mixture [m2/s]
D0 Diffusion coefficient at low pressure [cm2/s]
m
k Thermal conductivity of the mixture [W m K1 1]
k Turbulent kinetic energy [m2 s-2]
M Molecular weight of the mixture [kg/mol]
2
CO
m Mass flow rate of CO2 [kg s-1]
sol
m Mass flow rate of Solvent [kg s-1] P Pressure [bar]
P0 Operational Pressure [bar] Pcm Critical Pressure of the mixture [bar]
Pci Critical Pressure of component i [bar]
Pcm Critical mixture Pressure [bar]
R Universal constant for gases [J mol-1.K-1]
Re Reynolds number
T Temperature [K]
Tcm Critical Temperature of the mixture [K]
Tci Critical Temperature of component i [K]
T0 Operational Temperature [K] Tri Reference Temperature of component i Trm Reduced Temperature of the mixture
V Molar volume [m3 mol-1]
Vcm Critical volume of the mixture [cm3 mol-1]
Greek Symbols
ε Turbulent kinetic energy rate of dissipation [m2s-3]
µm Dynamic viscosity of the mixture [Pa.s]
ρ Mixutre density [kg m-3] ωm Acentric factor of the mixture
REFERENCES
Almeida, R. A., Study of turbulent flow in capillary supercritical fluid applied to the production of nanoparticles. (PhD thesis), State University of Maringa, Brazil (2013).
ANSYS, F. ANSYS Fluent, Inc. User Guide. Re-trieved from http://www.ansys.com (2010). Balcão, V. M., Costa, C. I., Matos, C. M., Moutinho,