Cop
yright
© ABE&M t
odos os dir
eit
os r
eser
vados
.
Iodine nutrition in elementary state
schools of Queretaro, Mexico:
correlations between urinary iodine
concentration with global nutrition
status and social gap index
Consumo de iodo em escolas de ensino fundamental de Querétaro, México: correlação entre a concentração urinária de iodo, o
estado nutricional geral e o índice de desigualdade social
Pablo García-Solís1, Juan Carlos Solís-S1, Ana Cristina
García-Gaytán1, Vanessa A. Reyes-Mendoza1, Ludivina Robles-Osorio1, Enrique
Villarreal-Ríos2, Luisa Leal-García3, Hebert Luis Hernández-Montiel1
ABSTRACT
Objective and methods: To estimate median urinary iodine concentration (UIC), and to correlate it with global nutrition indicators and social gap index (SGI) in 50 elementary state schools from 10 municipalities in the State of Queretaro, Mexico. Results: 1,544 students were enrolled and an above of requirements of iodine intake was found (median UIC of 297 μg/L). Iodine status was found as de-icient, adequate, more than adequate and excessive in 2, 4, 19 and 25 schools, respectively. Seventy seven percent of table salt samples showed adequate iodine content (20-40 ppm), while 9.6% of the samples had low iodine content (< 15 ppm). Medians of UIC per school were positively correlated with medians of body mass index (BMI) by using the standard deviation score (SDS) (r = 0.47; p < 0.005), height SDS (r = 0.41; p < 0.05), and overweight and obesity prevalence (r = 0.41; p < 0.05). Medians of UIC per school were negatively correlated with stunting prevalence (r = -0.39; p = 005) and social gap index (r = -0.36; p < 0.05). Best multiple regression models showed that BMI SDS and height were sig-niicantly related with UIC (p < 0.05). Conclusions: There is coexistence between the two extremes of iodine intake (insuficient and excessive). To our knowledge, the observed positive correlation between UIC and overweight and obesity has not been described before, and could be explained by the availa-bility and consumption of snack food rich in energy and iodized salt. Arq Bras Endocrinol Metab. 2013;57(6):473-82
Keywords
Iodine nutrition; obesity; urinary iodine concentration; schoolchildren; stunting; social gap index
RESUMO
Objetivo e métodos: Estimar a concentração de iodo urinário (CIU) mediana e correlacioná-la com os indicadores de nutrição geral e com o índice de desigualdade social (IDS) de 50 escolas estaduais de ensino fundamental de 10 municípios do estado de Querétaro, no México. Resultados: Utilizou-se um total de 1.544 crianças e encontrou-se uma ingestão acima das necessidades de iodo (CIU mediana de 297 μg/L). O nível de iodo determinado foi deiciente, adequado, mais do que adequado e excessivo em 2, 4, 19 e 25 escolas, respectivamente. Setenta e sete por cento de amostras de sal de mesa mos-traram uma quantidade de iodo adequada (20-40 ppm), enquanto 9,6% das amostras tinham um teor de iodo baixo (< 15 ppm). As medianas de CIU por escola foram correlacionadas positivamente com as medianas do índice de massa corporal (IMC) usando o desvio-padrão da contagem (DP) (r = 0,47; p < 0.005), o DP da altura (r = 0,41; p < 0.05) e a prevalência de sobrepeso e de obesidade (r = 0,41; p < 0,05). As medianas de CUI por escola foram correlacionadas negativamente com a prevalência de desnutrição (r = -0.39; p = 005) e com o índice de desigualdade social (r = -0.36; p < 0,05). Os melhores modelos de regressão múltipla mostraram que a DP do IMC e a altura foram relacionados signiicati-vamente com a CIU (p < 0,05). Conclusão: Existe uma convivência entre os dois extremos de ingestão de iodo (insuiciente e excessiva). Em nosso conhecimento, a correlação positiva entre a CIU, o excesso de peso e a obesidade não foi descrita anteriormente e poderia ser explicada pela disponibilidade e consumo de alimentos ou refeições ricos(as) em energia e sal iodado. Arq Bras Endocrinol Metab. 2013;57(6):473-82
Descritores
Nutrição com iodo; obesidade; concentração urinária de iodo; crianças em idade escolar; desnutrição; índice de desigualdade social
1 Departamento de Investigación
Biomédica, Facultad de Medicina, Universidad Autónoma de Querétaro, México
2 Unidad de Investigación
Epidemiológica y en Servicios de Salud, Instituto Mexicano del Seguro Social, Querétaro, México
3 Facultad de Contaduría y
Administración, Universidad Autónoma de Querétaro, México
Correspondence to:
Pablo García-Solís
Laboratorio de Endocrinología y Nutrición, Departamento de Investigación Biomédica, Facultad de Medicina, Universidad Autónoma de Querétaro Clavel, 200. Fracc. Prados de la Capilla, Querétaro, Querétaro. C.P. 76176. México
Cop
yright
© ABE&M t
odos os dir
eit
os r
eser
vados
.
INTRODUCTION
I
odine deiciency is still one of the most important nutritional deiciencies worldwide (1). According to the World Health Organization (WHO), the United Nations Children Fund (Unicef), and the Internatio-nal Council for Control of Iodine Deiciency Disorders (ICCIDD), iodine deiciency is the main cause of pre-ventable brain damage (2). Two of the main strategies to eradicate iodine deiciency are to establish a manda-tory universal salt iodization (USI) program and the permanent monitoring of iodine intake by means of the assessment of urinary iodine concentration (UIC) in vulnerable population, such as schoolchildren and both pregnant and lactating women (2). A median value of UIC below 100 μg/L in schoolchildren indicates io-dine deiciency, and the monitoring of UIC is recom-mended at least every three years in a representative national sample (2). In Mexico, the last two national studies regarding iodine nutrition were performed be-tween 1998 and 1999, the National Nutrition Survey (NNS-1999) (a probabilistic survey) and the Thyro-mobile program (with 23 sentinel sites), reported a median UIC of 235 and 176 μg/L, respectively (3-5). According to the USI program in Mexico, it is esti-mated that 94% table salt available in the market has more than 15 ppm of iodine (6); however, there are regions with still insuficient iodine content in table salt (7). In these regions, the sources of table salt are local and from artisanal producers that do not guaran-tee adequate iodine content (7). There are no recent national surveys about iodine content in table salt in households of Mexico, and the consumption pattern of iodized salt is poorly understood. Moreover, Mexico is considered a nutrition transition country with serious problems of overweight and obesity and a reduction of infectious diseases and nutritional deiciencies (8). The NNS-1999 reported a prevalence of overweight and obesity in schoolchildren (5 to 11 years of age) of 18.4%; seven years later, the National Health and Nu-trition Survey-2006 reported a prevalence of overwei-ght and obesity of 26.2% (3,9). On the other hand, the control of chronic undernutrition has been notably improved in the last years. In this regard, stunting pre-valence in schoolchildren in 1999 was 16.1%, whereas in 2006 it was 9.9% (3,9). However, other nutritional deiciencies, such as anemia in schoolchildren have not improved signiicantly; in 1999, anemia prevalence was 19.5%, whereas in 2006 it was 16.6% (3,9). Thisnu-tritional context makes it mandatory to describe the current situation of iodine nutrition in Mexico. In this cross-sectional study, we describe iodine nutrition sta-tus in Mexican children from elementary state schools in municipalities considered vulnerable to iodine dei-ciency and its relationship with the global nutrition sta-tus and the social gap index, a socioeconomic indicator.
SUBJECTS AND METHODS
Setting and subjects
This cross-sectional study was performed in 10 munici-palities from the state of Queretaro, Mexico. The mu-nicipalities studied were Amealco, Colon, El Marques, Huimilpan, Jalpan de Serra, Landa de Matamoros, Pe-dro Escobedo, Pinal de Amoles, San Joaquin, and Toli-man. The state of Queretaro is located at the center of the country (20° 40’-20º 1’ N, 99° 2’- 100º 36’ W) (10), approximately 270 km to the northwest of Me-xico City. According to the 2010 national census, the state of Queretaro has 1,827, 937 inhabitants, with the total population of the 10 municipalities studied repre-senting 24.2% of the total population of the state (10). Table 1 shows major geographic and sociodemographic characteristics, such as total population (10), school-children population (11), extreme poverty (12), social gap index (SGI) (12), prevalence of stunting (13), and range of altitude (14) of each municipality studied. Be-cause of the lack of recent information on UIC in the Queretaro state, we selected 10 municipalities conside-red more vulnerable to iodine deiciency according to the criteria described below.
Amo-Cop
yright
© ABE&M t
odos os dir
eit
os r
eser
vados
.
les, San Joaquin, and Toliman (Table 1) (13). Finally, high rates of congenital hypothyroidism were used as a third criterion of selection. High rate of congenital hypothyroidism was considered as a rate > 4.2/10,000 live births; which is more than the average of the na-tional prevalence (20,21). For this selection we used data from 2007, and the municipalities selected based on this criterion were Colon, El Marques, Huimilpan, and Pedro Escobedo (22,23).
We studied iodine nutrition in children from 50 randomly selected localities (76% rural and 24% urban) (14), 5 from each municipality. From each locality, one state elementary school was selected as the survey site. Only schools with more than 30 children between 6 to 12 years of age were included in this study (11). The Principal from each school was asked to randomly select 30-35 children of both genders to participate in the study. In general, it is accepted that 30 urine sam-ples are enough to calculate the median of UIC (2). However, in 7 cases, the number of children that took part in the day of data collection was less than 30, and in some cases, age range was between 5 to 16 years old. Because of the dificulties to return to these locations, we decided to include all the children available on the day of the data collection. Only 1.2% of children stud-ied were younger than 6 years old, and only 2.5% were older than 12 years old. The range of subjects sampled from each school was 23 to 36 children, and all data were collected from May 2010 to July 2011.
This study was approved by the Bioethical Commit-tee of the School of Medicine of the Autonomous Uni-versity of Queretaro. All participants voluntarily took
part in the study and written consent was obtained from at least one parent or guardian.
LABORATORy ANALySIS
We asked the children to bring a sample of ≈ 40 g of table salt from their homes. All table salt samples were analyzed qualitatively to identify the presence of iodate using a kit (Bioteccsa Laboratorios, Sonora, Mexico). A representa-tive subsample of table salt samples (between 10.9 and 24.6%), from each municipality was randomly selected to quantitatively determine iodine concentration. Quan-titative iodine analyses of table salt were performed using the sodium thiosulfate titration method (2).
On the other hand, spot urine samples were ob-tained from schoolchildren in 40-mL sterile plastic urine sample containers. Samples were placed in poly-ethylene tubes and kept at 4-10°C until arriving to the laboratory, where they were stored at -20°C until further analysis. UIC determinations were performed by the Sandell-Kolthoff method after sample digestion with ammonium persulfate, according to Pino and cols. (24). Intra- and interassay coeficients of variation were 6% and 8%, respectively. Median UIC was expressed in micrograms per liter (µg/L). External quality control assessment of the analytical procedure of UIC was car-ried out by the Laboratory of Micronutrients (LM) of the Cayetano Heredia Peruvian University. The Labo-ratory of Micrutrients is included in the Ensuring the Quality of Iodine Procedures of the Centers for Dis-ease Control and Prevention, and is a member of the Regional Resource Laboratory for the International Resource Laboratories for Iodine Network.
Table 1. Socio-demographic and geographic characteristics of the studied municipalities
Municipality Total population* Schoolchildren population**
Extreme poverty***, %
Social gap index ***
Schoolchildren stunting prevalence+, %
Altitude range++, m
Amealco 62,197 10,216 25.4 0.52864 14.7 2,356 - 2,770
Colon 58,171 8,904 11.4 -0.22066 9.7 1,751 - 2,573
El Marques 116,458 15,580 8.8 -0.72830 7.9 1,859 - 2,206
Huimilpan 35,554 5,738 12.4 -0.23528 7.5 1,933 - 2,431
Jalpan de Serra 25,550 3,983 18.2 -0.45104 9.6 756 - 1,503
Landa de Matamoros 19,929 3,464 24.2 -0.00523 12.1 1,033 - 1,612
Pedro Escobedo 63,966 8,873 7.2 -0.72304 5.5 1,915 - 2,200
Pinal de Amoles 27,093 5,278 34.9 0.68236 19.7 1,661 - 2,337
San Joaquin 8,865 1,365 25.3 0.34660 15.6 1,597 - 2,450
Toliman 26,372 3,932 17.3 0.30120 12.5 1,468 - 1,937
Cop
yright
© ABE&M t
odos os dir
eit
os r
eser
vados
.
The iodine nutrition status in children was deter-mined according to the recommended WHO/Unicef/ ICCIDD criteria (2), as follows: insuficient iodine in-take was deined as a population median UIC < 100 µg/L; adequate intake of iodine as UIC 100-199 µg/L; iodine intake above the requirements as UIC 200-299 µg/L; and excessive intake of iodine as UIC ≥ 300 µg/L.
Anthropometric measurements and global nutrition status indicators
The weight and height of the children were determined by standard anthropometric procedures (25). For the anthropometric measurements, shoes of the subjects were removed, their pockets emptied, and they wore light indoor clothing. Weight was recorded to the nea-rest 100 g and height to the neanea-rest centimeter. Body mass index (BMI) was estimated for each subject. For homogeneity reasons, height and BMI were expressed as standard deviation standards (SDS). SDS were calcu-lated according to Cacciari and cols. (26). Overweight and obesity prevalence were determined by using the BMI-for-age WHO 2007 criteria (27). A stunted child was deined as ≤ -2 SD, according to the height-for-age WHO standard (27,28).
Social gap index (SGI)
SGI was created by the National Council for Eva-luation of Social Development Policy (CONEVAL) that, according to the Mexican law, represents the authority and has the responsibility to establish these guidelines and criteria for the deinition, identiica-tion, and measurement of poverty (12). The SGI is a measurement obtained by means of a principal com-ponent analysis that summarizes 11 indicators cate-gorized in four dimensions: a) education (3 indica-tors), b) access to health care (1 indicator), c) access to basic services (3 indicators), and d) housing qua-lity and spaces and home assets (4 indicators). High SGI values indicate poor social development. Data used by CONEVAL to calculate the SGI were ob-tained from the National Census 2010, and provide information at three different levels: state, municipa-lity and locamunicipa-lity. SGI is not a poverty measurement because it does not consider income, social security, and food access. SGI data for each locality was obtai-ned from a public database at the internet homepage of the CONEVAL (12).
Statistical analysis
We used Microsoft Excel 2007 (Microsoft Corpora-tion, Redmond, WA), SPSS 16.0 (SPSS Inc. Chicago, IL), and GraphPad Prism 5 (GraphPad Sofware, Inc. La Jolla, CA) to perform the statistical analyses.Values shown are means ± standard deviation, or as medians and ranges in cases of individual UIC, BMI SDS, hei-ght SDS data of each child that are not normally dis-tributed. To analyze if data show Gaussian (normal) distributed we used D’Angostino and Person omni-bus normality test. Non-parametric Mann-Withney U and Kruskal-Wallis tests were used for comparisons of unpaired groups of UIC. Spearman correlation tests were performed to correlate median UIC with the prevalence of overweight, obesity and stunting becau-se thebecau-se variables did not show a normal distribution. Because medians had a Gaussian distribution, Pearson correlation tests were performed to relate median UIC with medians of BMI SDS and height SDS and SGI. We grouped data according to three geo-political le-vels: locality, municipality, and state. Multiple linear regression analyses were performed using the median of UIC from each school as a dependent variable, and altitude, iodine content in table salt, BMI SDS or hei-ght SDS and SGI as independent variables (Table 5). The best models obtained during the exploration analysis are reported (Model 1 and Model 2). P values < 0.05 were considered statistically signiicant.
RESULTS
In this study, 1,544 children from 50 localities (10 mu-nicipalities) of the state of Queretaro, Mexico, were in-cluded, with a male/female ratio of 1.07, and a mean of 9.3 ± 2.1 years of age. Table 2 shows the median height SDS and BMI SDS. As it may be observed, the muni-cipalities of Jalpan de Serra and Pinal de Amoles had the lowest height. In addition, Jalpan de Serra had the lowest BMI. Table 2 also shows the prevalence of stun-ting, overweight, and obesity. The highest prevalence of stunting was found in Pinal de Amoles (12.3%), and the highest prevalence of overweight and obesity was found in Pedro Escobedo (36%).
Cop
yright
© ABE&M t
odos os dir
eit
os r
eser
vados
.
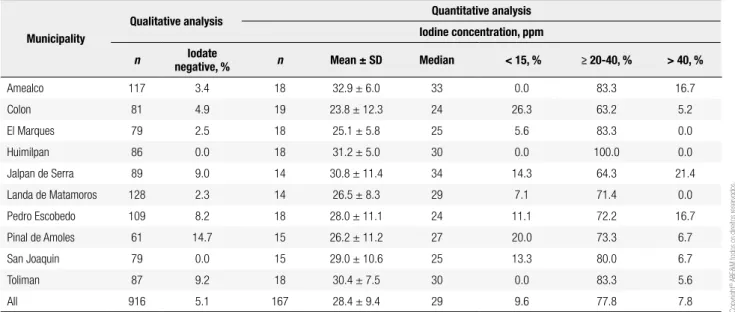
de Amoles (14.7%). These data are in agreement with the quantitative analysis of iodine content in the sub-sample of table salt (Table 3). A total of 77.8% table salt samples had iodine content between 20-40 ppm, and 9.6% of the samples had iodine content < 15 ppm. The municipalities with the greatest percentage of table salt samples with insuficient iodine content (< 15 ppm) were Colon and Pinal de Amoles with 26.3 and 20%, respectively.
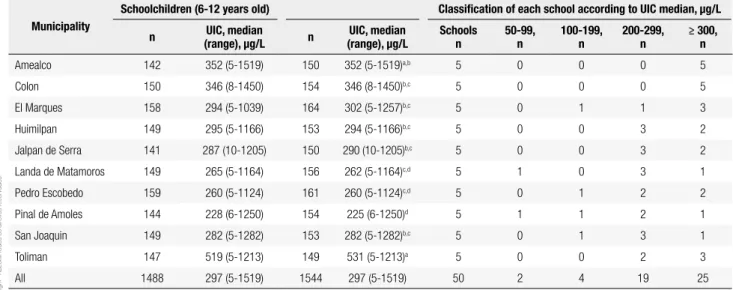
Table 4 shows detailed UIC results for each munici-pality, including the frequencies of UIC median values obtained in the 50 survey sites. Due to the wide age range (5 to 16 years) we analyzed separately the 6-12 years group and found no differences in the UIC
com-pared with the whole sample. In all municipalities, UIC medians were above 200 µg/L, and range was from 225 μg/L to 531 μg/L. These values indicate more than adequate iodine intake (median UIC of 200-299 μg/L) in 6 municipalities, and excessive iodine intake in 4 municipalities (≥ 300 μg/L). In spite of this, we found two localities, from the 50 studied, with insuf-icient iodine intake (50-100 μg/L), one in Landa de Matamoros and the other in Pinal de Amoles. On the other hand, because UIC values obtained from spot urine samples are not useful to estimate individual io-dine intake, we used UIC median values from each school to perform a population analysis instead of indi-vidual analysis.
Table 2. General characteristics of the locations and scholars by municipality
Municipality n Age (years)* Height SDS (median)
BMI SDS (median)
Stunting Overweight and obesity
% 95% CI % 95% CI
Amealco 150 9.4 ± 2.1 -0.261a,b 0.323a,b 5.3 1.7-8.9 21.3 14.8-27.9
Colon 154 9.2 ± 2.0 -0.300a,b 0.249a,b 1.9 -0.3-4.1 26.0 19.1-32.9
El Marques 164 9.3 ± 2.0 -0.256a,b 0.485a,b 1.8 -0.2-3.8 34.7 27.4-42.0
Huimilpan 153 8.9 ± 2.2 -0.193a 0.326a,b 7.2 3.1-11.3 20.3 13.9-26.7
Jalpan de Serra 150 9.5 ± 2.1 -0.606b -0.268c 10.0 5.2-14.8 17.3 11.3-23.5
Landa de Matamoros 156 9.5 ± 2.1 -0.412a,b 0.099a,b,c 7.7 3.5-11.9 15.7 10.0-21.4
Pedro Escobedo 161 9.4 ± 1.9 -0.228a 0.532a,b 1.9 -0.2-4.0 36.0 28.6-43.4
Pinal de Amoles 154 9.2 ± 2.2 -0.632b 0.038b,c 12.3 7.1-17.5 11.7 6.6-16.8
San Joaquin 153 9.6 ± 2.0 -0.442a,b -0.005b,c 8.5 4.1-12.9 20.9 14.5-27.3
Toliman 149 9.1 ± 1.9 -0.254a,b 0.508a 4.7 1.3-8.1 31.5 24.0-39.0
All 1,544 9.3 ± 2.1 -0.360 0.248 6.1 4.9-7.3 24.7 22.5-26.9
* Mean ± standard deviation. BMI: body mass index; F: female; M: male. SDS: standard deviation score. a, b, c Different letters indicate statistically signiicant differences (p < 0.05), according to
median value and multiple median comparison tests (Kruskal-Wallis and Dunn’s tests). 95% CI: 95% Conidence interval.
Table 3. Qualitative and quantitative analysis of iodine content in table salt samples by municipality
Municipality
Qualitative analysis Quantitative analysis Iodine concentration, ppm
n Iodate
negative, % n Mean ± SD Median < 15, % ≥ 20-40, % > 40, %
Amealco 117 3.4 18 32.9 ± 6.0 33 0.0 83.3 16.7
Colon 81 4.9 19 23.8 ± 12.3 24 26.3 63.2 5.2
El Marques 79 2.5 18 25.1 ± 5.8 25 5.6 83.3 0.0
Huimilpan 86 0.0 18 31.2 ± 5.0 30 0.0 100.0 0.0
Jalpan de Serra 89 9.0 14 30.8 ± 11.4 34 14.3 64.3 21.4
Landa de Matamoros 128 2.3 14 26.5 ± 8.3 29 7.1 71.4 0.0
Pedro Escobedo 109 8.2 18 28.0 ± 11.1 24 11.1 72.2 16.7
Pinal de Amoles 61 14.7 15 26.2 ± 11.2 27 20.0 73.3 6.7
San Joaquin 79 0.0 15 29.0 ± 10.6 25 13.3 80.0 6.7
Toliman 87 9.2 18 30.4 ± 7.5 30 0.0 83.3 5.6
Cop
yright
© ABE&M t
odos os dir
eit
os r
eser
vados
.
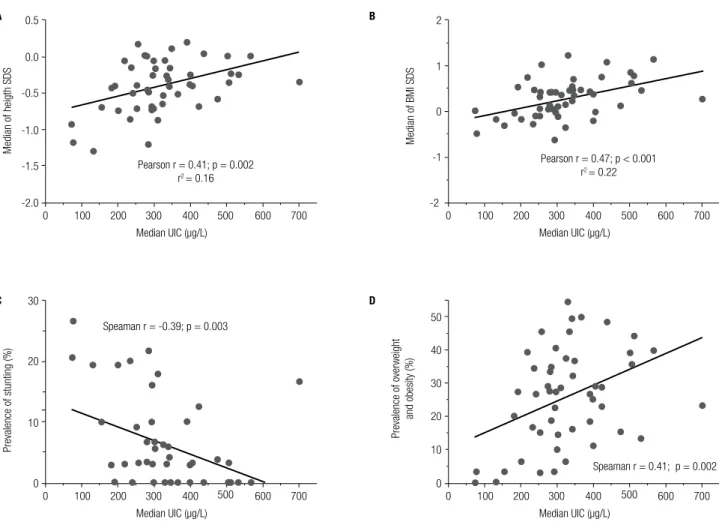
Figure 1A shows a typical non-Gaussian distri-bution of individual UIC values obtained from spot urine samples. Figure 1B shows the Gaussian distribu-tion of UIC median values obtained in each school. Correlation analyses between UIC and global nutrition status indicators and SGI using data from the 50 schools are shown in Figures 2 and 3. Figures 2A and B show a positive and signiicant correlation between the median UIC and the median Height SDS (Pearson r = 0.41; p = 0.002), and the median BMI SDS (Pearson r = 0.47; p < 0.001) in each locality. Furthermore, Figure 2C shows a negative and signiicant correlation coeficient between UIC and stunting prevalence (Spearman r = -0.39; p = 0.003). In contrast, igure 2D shows a positive and signiicant correlation coeficient between UIC and overweight and obesity prevalence (Spearman r = 0.41; p = 0.002). Correlation coeficients between UIC and overweight prevalence and obesity prevalence yielded Spearman values of r = 0.37 (p = 0.008) and r = 0.30 (p = 0.03), respectively (data not shown). On the other hand, the correlation coeficient between UIC with SGI was negative (Pearson r = -0.36; p = 0.005) (Figure 2).
Table 5 shows a multiple linear regression analysis with UIC as the independent variable and SGI, iodine content in table salt, and BMI SDS as dependent variables (Model 1). Similarly, an instead of BMI SDS, height SDS was included as a dependent variable in Model 2. In both cases BMI SDS (β = 111.36 < 0.05) and height SDS (β
= 99.94 < 0.05) were signiicantly correlated with UIC. When we explored other dependent variables, we did not ind any signiicant effect of altitude.
Table 4. Urinary iodine concentrations by municipality and school
Municipality
Schoolchildren (6-12 years old) Classiication of each school according to UIC median, µg/L
n UIC, median (range), µg/L n
UIC, median (range), µg/L
Schools n
50-99, n
100-199, n
200-299, n
≥ 300, n
Amealco 142 352 (5-1519) 150 352 (5-1519)a,b 5 0 0 0 5
Colon 150 346 (8-1450) 154 346 (8-1450)b,c 5 0 0 0 5
El Marques 158 294 (5-1039) 164 302 (5-1257)b,c 5 0 1 1 3
Huimilpan 149 295 (5-1166) 153 294 (5-1166)b,c 5 0 0 3 2
Jalpan de Serra 141 287 (10-1205) 150 290 (10-1205)b,c 5 0 0 3 2
Landa de Matamoros 149 265 (5-1164) 156 262 (5-1164)c,d 5 1 0 3 1
Pedro Escobedo 159 260 (5-1124) 161 260 (5-1124)c,d 5 0 1 2 2
Pinal de Amoles 144 228 (6-1250) 154 225 (6-1250)d 5 1 1 2 1
San Joaquin 149 282 (5-1282) 153 282 (5-1282)b,c 5 0 1 3 1
Toliman 147 519 (5-1213) 149 531 (5-1213)a 5 0 0 2 3
All 1488 297 (5-1519) 1544 297 (5-1519) 50 2 4 19 25
a, b, c, d Different letters indicate statistically signiicant differences (p < 0.05), according to median value and multiple median comparison tests (Kruskal-Wallis and Dunn’s tests).
Figure 1. Histograms of urinary iodine concentration (UIC) from 1,544
Mexican schoolchildren (A) and from median values of 50 elementary
state schools (B). UIC median values obtained from each school were
normally distributed (K2 = 5.198; p = 0.07). 300
Frequenc
y
Frequenc
y
200
100
0
0 200 400 600 800 1000 1200 1400 1600
12
8
4
0
0 100 200 300
UIC (µg/L) UIC (µg/L)
400 500 600 700 A
Cop
yright
© ABE&M t
odos os dir
eit
os r
eser
vados
.
0.5
0.0
Median of heigth SDS
-0.5
-1.0
-1.5
-2.0
0 100 200 300 Median UIC (µg/L)
400 500 500
500 500
Pearson r = 0.41; p = 0.002 r2 = 0.16
600 700
30
Prevalence of stunting (%)
Prevalence of overweight
and obesity (%)
20
10
0
0 100 200 300 Median UIC (µg/L)
400 Speaman r = -0.39; p = 0.003
600 700
50
40
30
20
10
0
0 100 200 300 Median UIC (µg/L)
400
Speaman r = 0.41; p = 0.002
600 700 2
1
0
Median of BMI SDS
-1
-2
0 100 200 300 Median UIC (µg/L)
400
Pearson r = 0.47; p < 0.001 r2 = 0.22
600 700
Figure 2. Correlations between median urinary iodine concentration (UIC) and median height standard deviation scores (SDS) (A), body mass (BMI) SDS
(B), prevalence of stunting (C), and prevalence of overweight and obesity (D). Each dot represents one elementary school (n = 50), the straight-line
represents the best-it line obtained by linear regression analysis.
A B
C D
Figure 3. Correlation between median urinary iodine concentration (UIC) and social gap index. Each dot represents one elementary school (n = 50), the straight-line represents the best-it line obtained by linear regression analysis.
Social gap index
1.5
1.0
0.5
0.0
-0.5
-1.0
-1.5
0 100 200 300 Median UIC (µg/L)
400 500 Pearson r=0.36; p=0.005
r2= 0.13
600 700
DISCUSSION
The results of this study are consistent with previous national data that indicate a sustained elimination of
iodine deiciency disorders (IDD) in Mexico (3-5); ne-vertheless, those studies were performed 14 years ago, and in this lapse of time several and dramatic changes
Table 5. Best multiple linear regression models between global nutrition indicators, social gap index, and iodine content in table salt as independent variables and UIC as dependent variable
Model 1 Model 2
β SE p β SE p
Independent variable
Social gap index -47.19 31.4 0.07 -46.98 35.63 0.10
Iodine in table salt, ppm
1.52 1.81 0.20 1.31 1.88 0.25
BMI SDS 111.37 41.14 0.004 - -
-Height SDS - - - 99.95 54.01 0.04
Constant 219.06 65.35 0.001 295.12 75.10 0.000
R square 0.26 0.001 0.20 0.009
Cop
yright
© ABE&M t
odos os dir
eit
os r
eser
vados
.
in nutrition have occurred at a national level (8,29). Currently, Mexico is considered a nutrition transition country, with an increase in prevalence of overweight and obesity and a reduction of nutritional deiciencies (8,29). IDD control in Mexico is based almost exclusi-vely in an USI program that guarantees that more than 90% the marketed table salt samples have > 15 ppm of iodine (6), and this is in agreement with our indin-gs. However, we showed that 2 of 50 (4%) elementary schools had insuficient iodine intake (median UIC 50-99 µg/L). This insuficient intake could be explained because there are places where ≥ 20% table salt sam-ples analyzed had insuficient iodine content. This is particularly relevant in places such as Pinal de Amoles, which had the lowest median UIC and the highest SGI and stunting prevalence. This inding is in accordan-ce with previous reports, such as those from Indonesia (19) and India (30). In these studies, iodine deiciency was associated with height SDS and intelligence quo-tient, and undernutrition and poverty, respectively. The geography and altitude have been traditionally descri-bed as important factors regarding iodine availability in soil. However, we did not ind a signiicant associa-tion for the altitude on UIC, which is in accordance to the results obtained by Aghini-Lombardi and cols. in a study performed in the south of Italy (31). This apparent discrepancy could be related to the improve-ment, in recent decades, of the public infrastructure, including road construction and commercial trading, which increases the availability of processed food in re-mote areas.
As stated above, we found that the presence of insuf-iciently iodized table salt is higher in localities with ele-vated SGI and undernutrition. This inding supports the notion that there are localities that depend on the intake of high quality iodized table salt to guarantee adequate iodine nutrition. Other places, such as Colon, with low-er stunting prevalence and lowlow-er SGI, had excessive io-dine intake, although 26% of table salt samples analyzed had insuficient iodine content. This seemingly contra-diction could be explained by the access to other dietary sources of iodine, such as processed food, considering the lower SGI and the subsequent higher social devel-opment. As mentioned, we identiied table salt samples without iodine. Nevertheless, in this study, we did not question socio-cultural and economic factors that could inluence iodized salt acquisition and/or consumption. In addition, a potential limitation to this study is that the sample size employed to calculate the median UIC
was less than 30 subjects in a few locations, which could prevent an accurate assessment of iodine status.
On the other hand, we describe here a positive and signiicant correlation between BMI SDS, height SDS, overweight and obesity with UIC. To our knowledge, it is the irst time that excessive iodine intake was as-sociated with unhealthy weight. We hypothesized that this association could be explained by the dramatic changes in dietary patterns in the Mexican population (8,29,32,33). At a national level, it is estimated that, from 1989 to 2006, the consumption of industrialized foods increased 6.3%, whereas fruit and vegetable con-sumption dropped 29% (29). Moreover, in rural areas, over a period of 15 years (from 1989 to 2004), the availability of industrialized food products increased 533% (32). Besides, inside or near most Mexican el-ementary schools, there are small stores that sell snack foods rich in energy, carbohydrates, fat, and iodized salt (33). In Mexico, it is compulsory for the food industry to employ iodized salt in their products. Therefore, we assume that snack foods are iodine rich, too. Unfortu-nately, we did not quantify the acquisition and/or con-sumption of industrialized food in the studied schools. However, the positive and signiicant association with BMI SDS, height SDS, overweight and obesity and SGI support this hypothesis. Moreover, in Brazil, excessive iodine intake, median UIC 360 µg/L, was related with an excess of iodine content in table salt, where 47% of table salt samples had more than 50 ppm of iodine (5). In our case only 7.8% of table salt samples were above 40 ppm of iodine. More recent data from other Latin American countries, Peru and Venezuela, obtained in a comprehensive USI program, showed median UIC of 262 and 166 µg/L, respectively (34,35).
Cop
yright
© ABE&M t
odos os dir
eit
os r
eser
vados
.
We consider that it is very important to characterize the dietary patterns to identify salt and iodine sources in schoolchildren, because both obesity and excessive in-take of iodine could have deleterious effects on thyroid function. On one hand, obesity has been related with an increase of thyroid-stimulating hormone (TSH) le-vels and thyroid structure alterations (39,40). On the other hand, excessive iodine intake has been related with increase in cumulative subclinical hypothyroidism and autoimmune thyroiditis (41). Further studies are needed to document the impact of both obesity and iodine excess in children thyroid function.
We can conclude that the observed correlation be-tween UIC and unhealthy weight can be explained by the availability and consumption of snack food rich in energy and iodized salt. Moreover, there is coexistence between the two extremes of iodine intake (insuficient and excessive). Because of this, we consider that the generation of a national program for monitoring urinary iodine excretion to reach and keep adequate iodine nu-trition by means of an USI program is a priority. In addi-tion, intensive and permanent educative and normative programs are needed to guarantee the availability and consumption of table salt with adequate iodine content.
Acknowledgments: we would like to thank Dr. Eduardo Pretell and Dr. Ana Colarossi, from the Cayetano Heredia Peruvian Uni-versity, for their technical advice and training in urinary iodine determination and Dr. Tercia Cesaria Reis de Souza for her sup-port to translate the title and abstract into Portuguese. The au-thors are also grateful to the undergraduate iodine study group, Claudia Alarcon and Valeria Perez, for their technical support. This study was supported by the National Council on Science and Technology-Mixed Funds (grant number FOMIX QRO--CONACYT-2009-117897).
Disclosure: no potential conlict of interest relevant to this article was reported.
REFERENCES
1. De Benoist B, McLean E, Andersson M, Rogers L. Iodine de-iciency in 2007: global progress since 2003. Food Nutr Bull. 2008;29:195-202.
2. World Health Organization/UNICEF/International Council for Control of Iodine Deiciency Disorders. Assessment of iodine de-iciency disorders and monitoring their elimination: a guide for programme managers. 3th ed. Geneva: WHO; 2007.
3. Rivera J, Shamah T, Villalpando S, González de Cosío T, Hernández B, Sepúlveda J. Encuesta Nacional de Nutrición 1999 Estado Nu-tricio de niños y mujeres en México. Cuernavaca (México): Insti-tuto Nacional de Salud Pública; 2001.
4. De Benoist B, Andersson M, Egli I, Takkouche B, Allen H. Iodine status worldwide: WHO global database on iodine deiciency. Ge-neva: WHO; 2004.
5. Pretell EA, Delange F, Hostalek U, Corigliano S, Barreda L, Higa AM, et al. Iodine nutrition improves in Latin America. Thyroid. 2004;14:590-9.
6. Comisión Federal para la Protección contra Riesgos Sanitarios, Secretaria de Salud México: Programa: alimentos. Proyecto: sal yodada y luorada. 2011 [cited November 2011] Available from: http://www.cofepris.gob.mx/Paginas/Temas%20Interes/Progra-mas%20y%20Proyectos/Alimentos/SalYodadaFluorurada.aspx 7. Pineda-Lucatero A, Avila-Jiménez L, Ramos-Hernández RI, Magos
C, Martínez H. Iodine deiciency and its association with intelli-gence quotient in schoolchildren from Colima, Mexico. Public Health Nutr. 2008;11:690-98.
8. Flores M, Macías N, Rivera M, Barquera S, Hernández L, García--Guerra A, et al. Energy and nutrient intake among Mexican school--aged children, Mexican National Health and Nutrition Survey 2006. Salud Publica Mex. 2009;51(Suppl. 4):S540-50.
9. Olaiz-Fernández G, Rivera-Dommarco J, Shama-Levy T, Rojas R, Villalpando-Hernández S, Hernández-Avila M, et al. Encuesta Na-cional de Nutrición y Salud 2006. Cuernavaca (México): Instituto Nacional de Salud Pública; 2006.
10. Instituto Nacional de Geografía y Estadística [database on the in-ternet]. México: Censo de Población y vivienda 2010; 2010 [cited December 2011]. Available from: http://www.censo2010.org.mx/ 11. Unidad de Servicios para la Educación Básica del Estado de
Que-rétaro [database on the internet]. QueQue-rétaro, México: Directorio de escuelas en el estado ciclo escolar 2009-2010. Subcoordina-ción de Gestión Administrativa. DirecSubcoordina-ción de PlaneaSubcoordina-ción Educa-tiva. Departamento de Estadística; 2009 [cited May 2009]. Availa-ble from: http://www.usebeq.sep.gob.mx/
12. Consejo Nacional de Evaluación de la Política de Desarrollo So-cial [database on the internet]. México: Medición de la Pobreza 2010. 2010 [cited December 2011]. Available from: http://www.co-neval.gob.mx/cmsconeval/rw/pages/medicion/index.es.do. 13. Desarrollo Integral de la Familia-Instituto Nacional de Ciencias
Médicas y de la Nutrición Salvador Zubirán-Instituto Nacional de Geografía. Cuarto censo nacional de talla 2004. México: DIF--INCMNSZ; 2006.
14. Instituto Nacional de Geografía y Estadística [database on the internet]. México: Marco geoestadístico nacional: catalogo de calves de entidades federativas, municipios y localidades. 2011 [December 2011]. Available from: http://www.inegi.org.mx/geo/ contenidos/geoestadistica/catalogoclaves.aspx
15. Stacpoole H. El bocio endémico en México. México: Consejo de Salubridad General/Secretaría de Salud; 1994.
16. Gutiérrez J, González A. Eliminación del bocio endémico asocia-do a deiciencia de yoasocia-do en México. Avances y perspectivas. Se-cretaría de Salud, México; 1997.
17. Zimmermann MB. Iodine deiciency. Endocr Rev. 2009;30:376-408. 18. Dunn JT. Seven deadly sins in confronting endemic iodine de-iciency, and how to avoid them. J Clin Endocrinol Metab. 1996;81:332-5.
19. Pardede LV, Hardjowasito W, Gross R, Dillon DH, Totoprajogo OS, Yosoprawoto M, et al. Urinary iodine excretion is the most appro-priate outcome indicator for iodine deiciency at ield conditions at district level. J Nutr. 1998;128:1122-6.
20. Vela-Amieva MC, Gamboa-Cardiel S, Pérez-Andrade ME, Ortiz--Cortés J, González-Contreras CR, Ortega-Velázquez V. Epidemio-logía del hipotiroidismo congénito en México. Salud Pub Mex. 2004;46:141-8.
21. Rendón-Macías ME, Morales-García I, Huerta-Hernández E Silva--Batalla A, Villasís-Keever MA. Birth prevalence of congenital hypo-thyroidism in Mexico. Paediatr Perinat Epidemiol. 2008;22:478-85. 22. Secretaría de Salud del Estado de Querétaro Servicios de Salud
Méxi-Cop
yright
© ABE&M t
odos os dir
eit
os r
eser
vados
.
co Atención a la salud de la infancia y la adolescencia. 2008 [cited January 2009]. Available from: http://www.sesa-qro.gob.mx/ss/ 23. Dirección General de Información en Salud, Secretaria de Salud
[database on the internet]. México: base de datos de certiicado de nacimiento-nacimientos ocurridos 2007, Sistema Nacional de Información en Salud. 2007 [cited January 2008] Available from: http://www.sinais.salud.gob.mx/nacimientos/index.html 24. Pino S, Fang SL, Braverman LE. Ammonium persulfate: a safe
alternative oxidizing reagent for measuring urinary iodine. Clin Chem. 1996;42:239-43.
25. WHO. Physical status: the use and interpretation of anthropome-try. Report of a WHO Expert Committee. WHO Technical Report Series no. 8. Geneva: WHO; 1995.
26. Cacciari E, Milani S, Balsamo A, Dammacco F, De Luca F, Chiarelli F, et al. Italian cross-sectional growth charts for height, weight and BMI (6-20 y). Eur J Clin Nutr. 2002;56:71-80.
27. WHO [database on the internet]. Geneva: WHO reference 2007: growth reference data for 5-19 years. 2007 [cited July 2011]. Avai-lable from: http://www.who.int/growthref/en/
28. Caulield LE, Richard SA, Rivera JA, Musgrove P, Black RE. Chap-ter 28. Stunting, wasting, and micronutrient deiciency disorders. In: Jamison DT, Breman JG, Measham AR, Alleyne G, Claeson M, Evans DB, et al., editors. Disease control priorities in developing countries. 2nd ed. Washington, DC: World Bank; 2006. p. 551-67. 29. Bonvecchio A, Safdie M, Monterrubio EA, Gust T, Villalpando S,
Rivera JA. Overweight and obesity trends in Mexican children 2 to 18 years of age from 1988 to 2006. Salud Publica Mex. 2009; 51(Suppl. 4):S586-94.
30. Brahmbhatt SR, Brahmbhatt RM, Boyages SC. Impact of protein energy malnutrition on thyroid size in an iodine deicient popula-tion of Gujarat (India): Is it an aetiological factor for goiter? Eur J Endocrinol. 2001;145:11-7.
31. Aghini-Lombardi F, Vitti P, Antonangeli L, Fiore E, Piaggi P, Palla-ra A, et al. The size of the community Palla-rather than its geogPalla-raphi- geographi-cal location better deines the risk of iodine deiciency: results
of an extensive survey in Southern Italy. J Endocrinol Invest. 2013;36:282-6.
32. Secretaría de Salud, Barquera S, Rivera J, Campos I, Hernández L, Santos-Burgoa C, et al. Bases técnicas del Acuerdo Nacional para la Salud Alimentaria: Estrategia contra el sobrepeso y la obesidad. México, DF: Secretaría de Salud; 2010.
33. Lozada M, Sánchez-Castillo CP, Cabrera GA, Mata II, Pichardo-On-tiveros E, Villa AR, et al. School food in Mexican children. Public Health Nutr. 2008;11:924-33.
34. Caballero L. Yoduria en escolares y embarazadas del estado Trujillo, Venezuela 2007-2008. Rev Argent Endocrinol Metab. 2011;48:206-11. 35. Miranda M, Chávez H, Aramburú A, Tarqui C. Estado nutricional
de yodo en alumnos de escuelas públicas del nivel primario en el Perú, 2009. Lima, Perú: Ministerio de Salud/Instituto Nacional de Salud/Centro Nacional de Alimentación y Nutrición; 2011. 36. Perrine CG, Sullivan KM, Flores R, Caldwell KL, Grummer-Strawn
LM. Intakes of dairy products and dietary supplements are posi-tively associated with iodine status among U.S. children. J Nutr. 2013;143:1155-60.
37. Andersson M, Aeberli I, Wüst N, Piacenza AM, Bucher T, Henschen I, et al. The Swiss iodized salt program provides adequate iodine for school children and pregnant women, but weaning infants not receiving iodine-containing complementary foods as well as their mothers are iodine deicient. J Clin Endocrinol Metab. 2010;95:5217-24.
38. Skeaff SA, Lonsdale-Cooper E. Mandatory fortiication of bread with iodised salt modestly improves iodine status in schoolchil-dren. Br J Nutr. 2013;109:1109-13.
39. Radetti G, Kleon W, Buzi F, Crivellaro C, Pappalardo L, di Iorgi N, et al. Thyroid function and structure are affected in childhood obesi-ty. J Clin Endocrinol Metab. 2008;93:4749-54.
40. Grandone A, Santoro N, Coppola F, Calabrò P, Perrone L, Del Giu-dice. Thyroid function derangement and childhood obesity: an Italian experience. BMC Endocr Disord. 2010;10:8.