Article
Printed in Brazil - ©2012 Sociedade Brasileira de Química0103 - 5053 $6.00+0.00A
*e-mail: [email protected]
#Current address: Department of Environmental Chemistry, IDAEA-CSIC,
Jordi Girona 18-26, 08034 Barcelona, Catalonia, Spain
Tributyltin in Crustacean Tissues: Analytical Performance and Validation of Method
Joyce Cristale,a,# Dayana M. dos Santos,b Bruno S. Sant’Anna,c Daniela C. Sandron,a
Sara Cardoso,a Alexander Turrad and Mary Rosa R. de Marchi*,a
aDepartment of Analytical Chemistry, Institute of Chemistry, São Paulo State University (UNESP),
CP 355, 14800-900 Araraquara-SP, Brazil
bDepartment of Chemical and Geological Oceanography, Oceanographic Institute,
University of São Paulo, 05508-900 São Paulo-SP, Brazil
cDepartment of Zoology, Institute of Biosciences, São Paulo State University (UNESP),
13506-900 Rio Claro-SP, Brazil
dDepartment of Biological Oceanography, Oceanographic Institute, University of São Paulo,
05508-120 São Paulo-SP, Brazil
O ermitão Clibanarius vittatus é um organismo típico de regiões intertidais estuarinas sendo
considerado um possível bioindicador da presença de tributilestanho (TBT) nesses ambientes. Por esta razão, este estudo apresenta o desempenho analítico e a validação do método para quantificação de TBT em tecidos de C. vittatus por cromatografia gasosa com detector fotométrico de chama
pulsante (GC-PFPD), após extração com solvente apolar (tolueno) e derivatização com reagente de Grignard. Os limites de detecção do método (LOD) foram 2,0 e 2,8 ng g-1 para TBT e DBT
(dibutil estanho), respectivamente, e seus limites de quantificação (LOQ) 6,6 e 8,9 ng g-1 para TBT
e DBT, respectivamente. O método foi aplicado em amostras do Estuário de Santos, Estado de São Paulo, Brasil. As concentrações de TBT e DBT variaram de 26,7-175,0 ng g-1 a 46,2-156,0 ng g-1,
respectivamente. As concentrações encontradas saopreocupantes uma vez que efeitos tóxicos (tais como a alteração endócrina) têm sido relatados em outros organismos, mesmo em níveis inferiores aos registrados no presente estudo.
The hermit crab Clibanarius vittatus is a typical organism from intertidal regions being
considered as a good bioindicator of tributyltin presence at these environments. Thus this study presents the analytical performance and validation method for TBT quantification in tissues of
C. vittatus by gas chromatography with pulsed flame photometric detector (GC-PFPD) after
extraction with an apolar solvent (toluene) and Grignard derivatization. The limits of detection of the method (LOD) were 2.0 and 2.8 ng g-1 for TBT and DBT (dibutyltin), respectively, and its
limits of quantification (LOQ) were 6.6 and 8.9 ng g-1 for TBT and DBT, respectively. The method
was applied to samples from Santos Estuary, São Paulo State, Brazil. TBT and DBT concentrations ranged from 26.7 to 175.0 ng g-1 and from 46.2 to 156.0 ng g-1, respectively. These concentrations
are worrisome since toxic effects (such as endocrine disruption) have been reported for other organisms even under lower levels of registred at this study.
Keywords: crustaceans, organotin, tributyltin (TBT), gas chromatography
Introduction
Butyltin compounds (BTs), members of the class of organometallic contaminants, are found in coastal regions worldwide because they were used in antifouling paints for
many years.1-3 In spite of the total worldwide ban proposed
by the International Maritime Organization (IMO) in January 2008, these compounds are still found in different environmental compartments of aquatic systems.4 Their
toxic effects are observed in many species because tributyltin (TBT) can induce an endocrine disruption process known as imposex.5 This effect in mollusks has been well documented.6-8
growth in the centric diatoms Skeletonema costatum and Thalassiosira pseudonana and increased mortality in the
sabellid Sabellastarte sanctijosephi, among other marine
organisms affected.9
Considering many studies involving abiotic matrices, only few works have quantified organotin compounds in the biota. This is mainly a result of the lack of appropriate analytical methods for these complex matrices. Methods for analysis of BTs have been developed for mollusks9 and
for vertebrates, such as fish and dolphins.10,11 In crustaceans,
besides the observed toxicity in contaminated areas where imposex is detected, there are few published reports for analysis of BTs in these organisms and none involving
estuarine hermit crabs.12 Hermit crabs commonly
inhabit coastal and estuarine regions near sources of BT contamination, such as harbors.13,14 They are scavengers,
consuming both dead animals and algae, and have relatively restricted mobility.15 For these reasons, hermit
crabs may be a more accurate sentinel organism than the predatory marine mollusks, the highly mobile fish and other crustaceans that are generally used as environmental indicators of this kind of pollution.
In consequence of the low environmental concentrations of BTs, analytical approaches need to be refined in order to develop methods with high recovery and accuracy. Most studies analyzing BTs used gas chromatography with flame photometric detection (GC-FPD)10,16 and gas chromatography
coupled to tandem mass spectrometry (GC-MS/MS).17-19 In
Brazil, some recent studies have used gas chromatography with pulsed flame photometric detection (GC-PFPD) to analyze BTs in both biotic and abiotic samples.4,20-22 For
analysis of BTs by GC, it is necessary a derivatization step, for which the main used agents are Grignard reagent and sodium tetraethylborate.2,23,24 In addition to the derivatization,
the analytical procedure involves extraction using an apolar solvent (hexane or toluene) and a clean-up step using Florisil and silica.21 In order to develop a safe and reliable
method, validation procedures are necessary.25 The validation
process involves the use of certified reference materials to evaluate the accuracy and precision of the method, as well as the limits of detection (LOD) and quantification (LOQ) of the procedure.
For crustaceans, Guérin et al.12 proposed a method
using NaBEt4. However, in Brazil, it is difficult to obtain this reagent because it is not authorized to be transported overland. An alternative for such studies is an adaptation of the used method by Limaverde et al.20 for mollusks,
which uses Grignard reagent. Another study16 successfully
used Grignard reagent for analysis of BTs in mussel tissues. Therefore, we aimed to develop a method for the determination of TBT in hermit-crab tissues using Grignard
reagent as a derivatizating agent, with the western-Atlantic hermit crab Clibanarius vittatus as a biological model.
Experimental
Chemicals
TBT (96% tributyltin chloride), DBT (96% dibutyltin dichloride), MBT (95% monobutyltin trichloride), TPrT as surrogate (98% tripropyltin chloride) and TeBT as internal standard (96% tetrabutyltin) were purchased from Sigma-Aldrich (Milwaukee, WI, USA), as well as neutral aluminum oxide and Grignard reagent (2 mol L-1
pentyl magnesium bromide in diethyl ether). Methanol, hydrochloric acid, sulfuric acid, sodium hydroxide and anhydrous sodium sulfate were purchased from JT Baker (Xalostoc, Mexico). Hexane and toluene were acquired from Mallinckrodt (Xalostoc, Mexico). Ammonium pyrrolidine dithiocarbamate (98% APDC) was purchased from Fluka (St. Gallen, Switzerland). The certified reference material ERM-CE477 (mussel tissue) was purchased from European Reference Materials.
The butyltin chloride stock solutions were prepared in hexane at concentrations of 5 µg mL-1 (MBT), 6 µg mL-1
(DBT) and 4 µg mL-1 (TBT). Working standard solutions
were obtained by dilution of stock solutions and were used for a one-month period.
Apparatus
Extracts were analyzed by gas chromatography: Varian 3800 (Walnut Creek, CA, USA) equipped with a pulsed flame photometric detector (PFPD) using a tin filter (390 nm) and a VF5 capillary column (30 m × 0.25 mm;
Varian, Walnut Creek, CA, USA) using an initial
temperature program at 50 oC (hold for 0.50 min),
followed by a ramp at 15 °C min-1 until 170 °C and then
at 10 °C min-1 until 280 °C, remaining for 0.50 min. The
injector and detector temperatures were 250 and 300 °C, respectively. The injection volume was 2 µL (splitless,
1 min) and the carrier gas (hydrogen) was used at a flow rate of 1.7 mL min-1. Since the PFPD response is closely
dependent on several detector parameters, the optimization of the conditions for BT analysis included a purge flow closed for 60 s.21 Chromatograms and area values were
calculated by means of Varian Star 5.5 software.
Sample collection and preparation
tide on Pescadores Beach (23º 58’ 21’’ S; 46º 23’ 35’’ W) in the São Vicente Estuary. A pool of these organisms was used in the BT recovery study and in the determination of the limits of detection of the method (LOD).
The used crabs to apply the method were collected at three locations (location 1: 23° 59’ 27.8’’ S and 46° 18’ 15.2’’ W, location 2: 23° 59’ 13.9’’ S and 46° 17’ 39.8’’ W and location 3: 23° 55’ 53.6’’ S and 46° 18’ 19.4’’ W) in Santos Estuary, Southeastern Brazil in São Paulo State. At each of these locations, 15 hermit crabs were collected and pooled in three groups of five crabs to provide a triplicate analysis for each sampling site.
In the laboratory, the specimens were identified according to Melo26 and stored frozen until analysis. After
the hermit crabs were removed from their shells, the dorsal portion of the abdomen was dissected and the gonads and digestive gland were removed, forming a pool of several specimens of C. vittatus from each location for the chemical
analysis. This pool was stored in aluminum containers at
−20 oC until analysis. Prior to sample processing, each pool
was homogenized by vortex.
Butyltin extraction
The tissue extraction is a modification of the proposed method by Limaverde et al.20 for organotin extractions in
mussel tissue. The extraction was performed by adding 3.5 mL of hydrochloric acid and 5 mL of methanol, homogenizing in vortex for 1 min for digestion. After 10 min rest, 1 g of sodium chloride was added to saturate the solution (salting-out effect). The extraction was performed with toluene, replacing ethyl ether-hexane proposed by Limaverde et al.20 A volume of 8 mL of
toluene was added, followed by vortex agitation for 1 and 10 min of extraction in an ultrasonic bath, and then centrifugation for 5 min at 2000 rpm. This procedure was repeated three times, and the combined extracts were transferred to a separation funnel, where 10 mL APDC (0.1% v/v in water) was added to complex the TBT and to reduce its water solubility. Then, the organic phase was dried by passing through anhydrous sodium sulfate and transferred to a pear-shaped flask, for concentration in a rotary evaporator (40-50 oC) to 2 mL. The BT standards
have low volatility, so these standards were derivatized with Grignard reagent, following a derivatization method for TBT analysis in sediment samples by GC-PFPD, as reported in other studies on organotin analysis in Brazilian marine sediments.4,21,27,28 For derivatization, 3 mL of
Grignard reagent were added to 2 mL of the concentrated extract. The reaction was stopped after 20 min by adding 20 mL of ultrapure water, in an ice bath. Following
solubilization of the white precipitate with a few drops of sulfuric acid, the solution was transferred to a separation funnel and the aqueous phase was discarded. The organic phase was then reconcentrated to 2 mL, dried with sodium sulfate and passed through an aluminum oxide (1 g) column for clean-up with hexane as eluent (6 mL). Final extracts were again concentrated to 0.1 mL with N2 and
then TeBT corresponding to 1000 ng mL-1 was added as
an internal standard (IS).
Validation of the method
The limits of instrumental detection (iLOD) were
experimentally obtained by injecting standard dilutions until the compounds cannot be detected. The standard solutions were submitted to a derivatization step (previously described) before injection into the GC system. The limits ofinstrumental quantification (iLOQ) and the linear interval were obtained by a linearity curve according to the Huber test.29 For the determination of the linear interval, it was
calculated the area/concentration (A/C) ratios for each compound at each level of the calibration and determined the median (md) of these values. Then, it was calculated the difference between the A/C and the md, and the median of these differences (mad) was determined. The confidence interval (IC) was obtained by multiplying the mad by a constant that varies from 2 to 8. This factor gives the width of the confidence interval, and lower values result in narrower intervals. Thus, for narrower data dispersion, the number 3 is chosen as this factor. A/C values which were above or below this confidence interval were rejected. The first value within this interval was considered to be the iLOQ. The iLOD and iLOQ were also determined for MBT and DBT.
Spiked samples were used for the BT recovery studies and to determine the limits of detection and quantification of the method. 1 g portions from a pool of 20 organisms were used for spiking. From the same pool of 20 organisms, three 1 g samples were analyzed and the found amounts of TBT, DBT and MBT in these samples were subtracted from the results for the spiked samples.
For the recovery study, samples spiked with 66, 89 and 82 ng g-1 of TBT, DBT and MBT, respectively, were used.
The LOD and LOQ were determined using a sample spiked with 6.6, 8.9 and 33 ng g-1 for TBT, DBT and MBT,
The accuracy of the method was determined using 250 mg of the certified reference material (mussel tissue, ERM- CE477, EC-JRC-IRMM, Geel, Belgium), following the described butyltin extraction procedure in the previous section. The certified amounts of TBT, DBT and MBT in the CRM were 2.20 ± 0.19, 1.54 ± 0.12 and 1.5 ± 0.28 mg kg-1,
respectively.
Results and Discussion
Validation of the method
The standard solutions were submitted to a derivatization step before injection into the GC system. A study of the linearity was performed to define the linear interval and the iLOQ for the GC-PFPD system, using the linearity curve according to the Huber test (previously described). Table 1 shows the obtained values of iLOD, iLOQ, linear equation, linear interval and linear regression (r2).
TBT, DBT and MBT were detected and measured in the pool of 20 crabs that were used for the recovery study and for the LOD and LOQ determinations. Three 1 g portions of this pool were analyzed, and the amounts of TBT and
DBT in these samples (non-spiked) were 18.6 ng g-1
with a RSD of 20% and 18.9 ng g-1 with a RSD of 18%,
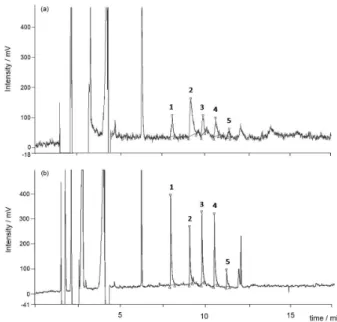
respectively. MBT was not quantified in these samples because the obtained results were unsatisfactory for this compound, as discussed below. The chromatograms for the spiked and non-spiked samples are shown in Figure 1. These amounts were subtracted from the obtained values in the recoveries.
The obtained LOD was 2.0 ng g-1 tissue for TBT and
2.8 ng g-1 for DBT. In the recovery study, the spiked samples
at 66 ng g-1 for TBT, 89 ng g-1 for DBT and 82 ng g-1 for
MBT were used, and the recoveries for TBT, DBT and MBT were 97 ± 12%, 107 ± 2% and 92 ± 8%, respectively. The mean recovery of the spiked samples (n = 3) at the level of 6.6 ng g-1 tissue for TBT was 62 ± 12%. For DBT
(4.4 ng g-1 tissue), the recovery from these spiked samples
was acceptable (79 ± 11%), whereas for MBT (33 ng g-1
tissue) the recovery was unacceptable (10 ± 3%). For TBT and DBT, 6.6 and 4.4 ng g-1 were considered as the LOQ,
respectively. Table 2 summarizes the obtained results for TBT, DBT and MBT in the method-validation study.
For the evaluation of the accuracy and precision of the method, it was used 250 mg of ERM-CE477 (mussel tissue). The TBT results for the certified reference material (n = 3) were similar to those for the spiked samples (Table 2), with mean recoveries of 98 ± 12%. The recoveries of DBT and MBT were 61 ± 18% and 32 ± 6%, respectively. Because of the unacceptable results that were obtained for MBT at low concentrations in the spiked samples and in the reference material, only TBT and DBT were quantified in the mussel samples, as discussed below. In this study, toluene was used as the extraction solvent, replacing ethyl
Table 1. Analytical curve parameters and limits of instrumental detection (iLOD) and instrumental quantification (iLOQ) for the GC/PFPD system for organotin compounds. Values expressed as mass injected into the GC system
Compound iLOD / pg iLOQ / pg Linear equation Linear interval / pg Linear regression (r2)
TBT 33 66 y = 0.0009x + 0.0565
y = 0.0008x + 0.2823
66-1320 1320-14784
0.9398 0.9693
DBT 44 396 y = 0.0007x + 0.0208
y = 0.0007x + 0.2123
396-1980 1980-22176
0.9990 0.9837
MBT 165 660 y = 0.0002x – 0.0249
y = 0.0011x – 1.1971
660-2310 1980-18480
0.9505 0.9822
TPrTa 41 168 y = 0.001x + 0.0203
y = 0.0005x + 0.6479
168-1650 1650-2310
0.9656 0.9344
aUsed as surrogate.
ether-hexane as proposed by Limaverde et al.20 This led
to better recovery results, with an increase from 30% to 98 ± 12% for TBT from the ERM-CE477.
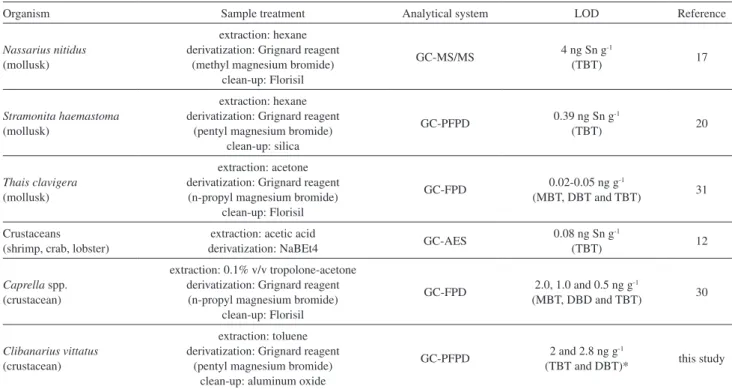
Table 3 compares the results that were obtained in this study and those obtained for TBT analyses in other organisms by other authors, showing results comparable to those obtained in this study. The proposed method proved to be suitable for the analyzed samples in this study, as described below. The LOQ could not be compared with other studies because of the lack of this information in the published data. BT levels in a crustacean that were analyzed by GC-FPD and derivatized with Grignard reagent were previously
reported.30 The authors proposed a method involving the
addition of Grignard reagent to the mussel extract and shaking for 1 h under controlled temperature at 40 °C. In this study, the reaction time for TBT analysis in the hermit crab Clibanarius vitattus was 20 min at ambient temperature.
Another advantage of this method is the use of aluminum oxide for clean-up. This is less expensive than Florisil, which is used by many authors for biotic samples.17,30,31 This
method resulted in clean extracts, with good reproducibility (RSD < 20%) and the use of GC-PFPD can contribute for the major sensitivity and selectivity of organotin compounds in complex environmental matrices by using a tin filter.
Table 2. Summary data for the TBT, DBT and MBT method validation processes for hermit crab (Clibanarius vittatus) tissues
Recovery study LOQ study Accuracy and precision
Spiked samples (n = 3) Spiked samples (n = 3) Reference materiala (n = 3)
TBT mass added / (ng g-1 tissue)
TBT recovery / %
TBT mass added / (ng g-1 tissue)
TBT recovery / %
TBT certified value / (mg kg-1 tissue)
TBT recovery / %
66 97 ± 12 6.6b 62 ± 12 2.20 ± 0.19 98 ± 12
DBT mass added / (ng g-1 tissue)
DBT recovery / %
DBT mass added / (ng g-1 tissue)
DBT recovery / %
DBT certified value / (mg kg-1 tissue)
DBT recovery / %
89 107 ± 2 4.4b 79 ± 11 1.54 ± 0.12 61 ± 18
MBT mass added / (ng g-1 tissue)
MBT recovery / %
MBT mass added / (ng g-1 tissue)
MBT recovery / %
MBT certified value / (mg kg-1 tissue)
MBT recovery / %
82 92 ± 8 33 10 ± 3 1.5 ± 0.28 32 ± 6
aERM-CE477 (mussel tissue); baccepted values as limit of quantification of the method (LOQ).
Table 3. Data for TBT in different biotic matrices, taken from literature references and the present study
Organism Sample treatment Analytical system LOD Reference
Nassariusnitidus
(mollusk)
extraction: hexane derivatization: Grignard reagent
(methyl magnesium bromide) clean-up: Florisil
GC-MS/MS 4 ng Sn g(TBT)-1 17
Stramonita haemastoma
(mollusk)
extraction: hexane derivatization: Grignard reagent
(pentyl magnesium bromide) clean-up: silica
GC-PFPD 0.39 ng Sn g-1
(TBT) 20
Thais clavigera
(mollusk)
extraction: acetone derivatization: Grignard reagent (n-propyl magnesium bromide)
clean-up: Florisil
GC-FPD 0.02-0.05 ng g-1
(MBT, DBT and TBT) 31
Crustaceans (shrimp, crab, lobster)
extraction: acetic acid
derivatization: NaBEt4 GC-AES
0.08 ng Sn g-1
(TBT) 12
Caprella spp. (crustacean)
extraction: 0.1% v/v tropolone-acetone derivatization: Grignard reagent (n-propyl magnesium bromide)
clean-up: Florisil
GC-FPD 2.0, 1.0 and 0.5 ng g-1
(MBT, DBD and TBT) 30
Clibanarius vittatus
(crustacean)
extraction: toluene derivatization: Grignard reagent
(pentyl magnesium bromide) clean-up: aluminum oxide
GC-PFPD 2 and 2.8 ng g-1
(TBT and DBT)* this study
Application of the method
Following the validation procedure, the method was applied to the collected samples in Santos Estuary, where the largest harbor in Brazil is located. In addition to the presence of this harbor, the area is also heavily impacted by industrial and urban contaminants. In a previous study,21 organotin contamination was detected in surface
sediments, with a mean concentration of 482 ng Sn g-1
dry weight (1205 ng g-1 dry weight) for TBT. Based on
these data, organisms from this region are suitable for assessments of toxicological risk. Application of this method to hermit crabs can help to understand how this contamination may affect the biota.
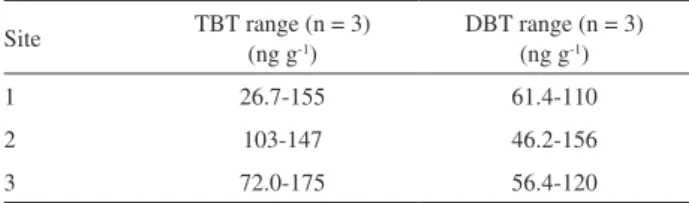
The proposed method showed to be suitable for the samples, and TBT and DBT were quantified in all the analyzed samples. The TBT and DBT quantities in the samples were similar among the studied areas, with concentrations ranging from 26.7 to 175 ng g-1 for TBT and
from 46.2 to 156 ng g-1 for DBT. The results of the TBT
quantification of these samples are shown in Table 4.
Although MBT was detected in the samples, it was not possible to quantify it because the validation procedure was not completed for this compound. Therefore, the comparison between the amounts of TBT and degradation products was made only with DBT. In sediments, it is common to determine the degradation index (which helps to determine if the contamination is recent or old) from the ratio of TBT to DBT + MBT.32 However, for living
organisms, this determination is not applicable because the degradation compounds can be directly assimilated from the abiotic/biotic source.
The lack of data for organotin in the sediment, which was sampled at the same time as the hermit-crab samples, makes difficult the discussion of the assimilation index. However, as in other studies, the amount of bioaccumulation appeared to be similar for these organisms, even in different sampling areas. Abiotic factors including tides, currents, oxyreduction state and salinity, which are frequently used for interpretation of BTs in sediments, are not related to the
concentrations of these compounds in organisms. However, data for lipid content, maturation stage and sex could help to interpret the results.
TBT is the most important BT, since it has strong toxic effects. It can accumulate more in animals at lower trophic levels because they have a poor capacity to degrade this compound.33 The results of this study can be
compared with those obtained by Limaverde et al.20 using
the gastropod Stramonita haemastoma and the bivalve Perna perna as bioindicators, with TBT concentrations
ranging from < LOD to 62 ng Sn g-1 (155 ng TBT g-1) for
S. haemastoma and < LOD to 110 ng Sn g-1 (275 ng TBT g-1)
for P. perna. For crustaceans, Takeuchi et al.30 quantified
TBT in amphipods (Caprella spp.) with a mean TBT
concentration of 32 ng g-1.
The wide range of concentrations that were found in samples from the same site may be related to different rates of assimilation of this pollutant by organisms, or to their different maturation stages. However, although it was variable, even the lowest concentration of recorded TBT in the study area (26.7 ng g-1 wet weight) can cause toxic
effects in organisms,1 since concentrations of 1 ng g-1 are
usually sufficient to produce these effects.2 In some cases
the effects can be irreversible or even lethal.
Conclusions
A method was developed for analysis of TBT and DBT (degradation product) in tissues of Clibanarius vittatus.
This is the first method that is reported for the determination of organotins in this group of crustaceans. The studies of accuracy and precision were carried out with certified reference material and spiked samples. Good results were obtained, with recoveries higher than 60% and RSD lower than 20%. The method proved to be appropriate for TBT and DBT determination in samples from Pescadores Beach (São Paulo State, Brazil). It was possible to quantify these compounds in all samples, and TBT was recorded at concentrations that may cause toxic effects in the biota.
Acknowledgements
Fundação de Amparo à Pesquisa do Estado de São Paulo (FAPESP, Grant 2006/57007-3) and scholarship to B. S. S. (Grant 2006/61589-8)), Conselho Nacional de Desenvolvimento Científico e Tecnológico (CNPq, research scholarship to A. T., Grant 301240/2006-0, and undergraduate scholarship to S. C. S. and D. C. S.), Fundação de Apoio à Ciência, Tecnologia e Educação (FACTE). Dr. Janet W. Reid revised the English text.
Table 4. TBT and DBT data for tissues of hermit crabs collected at three
sites in the Santos estuary, southeastern Brazil. Three sample pools (five crabs) from each site were analyzed. The values are expressed as ng g-1
wet tissue
Site TBT range (n = 3) (ng g-1) DBT range (n = 3) (ng g-1)
1 26.7-155 61.4-110
2 103-147 46.2-156
References
1. Fent, K.; Toxicol. Lett.2003, 140, 353. 2. Hoch, M.; Appl. Geochem.2001, 16, 719.
3. Antizar-Ladislao, B.; Environ. Int.2008, 34, 292.
4. Santos, D. M.; Araújo, I. P.; Machado, E. C.; Carvalho-Filho, M. A. S.; Fernandez, M. A.; Marchi, M. R. R.; Godoi, A. F. L.;
Mar. Pollut. Bull.2009, 58, 1926.
5. Cao, D.; Jiang, G.; Zhou, Q.; Yang, R.; J.Environ. Manage.
2009, 90, S16.
6. Gibbs, P. E.; Bryan, G. W.; Pascoe, P. L.; Mar. Environ. Res.
1991, 32, 79.
7. Bettin, C.; Oehlmann, J.; Stroben, E.; Helgolander Meeresuntersuchungen1997, 50, 299.
8. Oehlmann, J.; Fioroni, P.; Stroben, E.; Markert, B.; Sci. Total Environ.1996, 188, 205.
9. Bryan, G. W.; Gibbs, P. E.; Newman, M. C.; McIntosh, A. W.;
Metal Ecotoxicology: Concepts & Applications; Lewis
Publishers: Michigan, 1991, p. 323.
10. Kannan, K.; Corsolini, S.; Focardi, S.; Tanabe, S.; Tatsukawa, R.; Arch. Environ. Con. Tox.1996, 31, 19.
11. Dorneles, P. R.; Lailson-Brito, J.; Fernandez, M. A. S.; Vidal, L. G.; Barbosa, L. A.; Azevedo, A. F.; Fragoso, A. B. L.; Torres, J. P. M. O.; Environ Pollut.2008, 156, 1268.
12. Guérin, T.; Sirot, V.; Volatier, J. L.; Leblanc, J. C.; Sci. Total Environ.2007, 388, 66.
13. Turra, A.; J. Mar. Biol. Assoc. U. K. 2004, 84, 757.
14. Sant’anna, B. S.; Reigada, Á. L. D.; Pinheiro, M. A. A.; J. Mar. Biol. Assoc. U. K.2009, 89, 761.
15. Hazlett, B. A.; Annu. Rev. Ecol. Syst.1981, 12, 1.
16. Horiguchi, T.; Li, Z.; Uno, S.; Shimizu, M.; Shiraishi, H.; Morita, M.; Thompson, J. A. J.; Levings, C. D.; Mar. Environ. Res.2004, 57, 75.
17. Berto, D.; Giani, M.; Boscolo, R.; Covelli, S.; Giovanardi, O.; Massironi, M.; Grassia, L.; Mar. Pollut. Bull.2007, 55, 425. 18. Boscolo, R.; Cacciatore, F.; Berto, D.; Marin, M. G.; Giani, M.;
Appl. Organomet. Chem.2004, 18, 614.
19. Rato, M.; Gaspar, M. B.; Takahashi, S.; Yano, S.; Tanabe, S.; Barroso, C.; Mar. Pollut. Bull.2008, 56, 1323.
20. Limaverde, A. M.; Wagener, A. L. R.; Fernandez, M. A.; Scofield, A. L.; Coutinho, R.; Mar. Environ. Res.2007, 64, 384.
21. Godoi, A. F. L.; Favoreto, R.; Santiago-Silva, M.; Quim. Nova
2003, 26, 708.
22. Felizzola, J. F.; Wagener, A. D. L. R.; Almeida, A. C.; Wie, O. L.;
Quim. Nova 2008, 31, 89.
23. Morabito, R.; Massanisso, P.; Quevauviller, P.; TrAC, Trends Anal. Chem.2000, 19, 113.
24. Cassi, R.; Tolosa, I.; Bartocci, J.; de Mora, S.; Appl. Organomet. Chem.2002, 16, 355.
25. http://www.eurachem.org/guides/pdf/valid.pdf accessed in December 2010.
26. Melo, G. A. S.; Manual de Identificação dos Crustacea Decapoda do Litoral Brasileiro: Anomura, Thalassinidea, Palinuridea, Astacidea;Plêiade: São Paulo, Brasil, 1999. 27. de Oliveira, C. R.; dos Santos, D.; Madureira, L. A. S.; de
Marchi, M. R. R.; J. Hazard. Mater.2010, 181, 851.
28. Santos, D. M. D.; Sant’Anna, B. S.; Sandron, D. C.; de Souza, S. C.; Cristale, J.; Marchi, M. R. R. D.; Turra, A.;
Estuar. Coast. Shelf S.2010, 88, 322.
29. Huber, L.; LC GC Eur.1998, 11, 96.
30. Takeuchi, I.; Takahashi, S.; Tanabe, S.; Miyazaki, N.; Mar. Environ. Res.2004, 57, 397.
31. Leung, K. M. Y.; Kwong, R. P. Y.; Ng, W. C.; Horiguchi, T.; Qiu, J. W.; Yang, R.; Song, M.; Jiang, G.; Zheng, G. J.; Lam, P. K. S.; Chemosphere2006, 65, 922.
32. Díez, S.; Ábalos, M.; Bayona, J. M.;Water Res. 2002, 36, 905. 33. Godoi, A. F. L.; Favoreto, R.; Santiago-Silva, M.; Quim. Nova
2003, 26, 708.
Submitted: May 22, 2011 Published online: October 13, 2011