Article
Printed in Brazil - ©2012 Sociedade Brasileira de Química0103 - 5053 $6.00+0.00
A
*e-mail: [email protected]
Direct Electrochemical Analysis of Dexamethasone Endocrine Disruptor in
Raw Natural Waters
Thiago M. B. F. Oliveira,a Francisco W. P. Ribeiro,a Jefferson M. do Nascimento,a
Janete E. S. Soares,b Valder N. Freire,c Helena Becker,a Pedro de Lima-Netoa and
Adriana N. Correia*, a
aDepartamento de Química Analítica e Físico-Química and cDepartamento de Física,
Centro de Ciências, Universidade Federal do Ceará, Campus do Pici, 60455-760 Fortaleza-CE, Brazil
bDepartamento de Farmácia, Faculdade de Farmácia, Odontologia e Enfermagem, Universidade
Federal do Ceará, Rua Capitão Francisco Pedro, 1210, Rodolfo Teófilo, 60430-370 Fortaleza-CE, Brazil
Este trabalho descreve uma metodologia eletroanalítica, utilizando voltametria adsortiva de onda quadrada, que foi aplicada com êxito na determinação direta de resíduos de dexametasona em águas naturais brutas utilizadas no abastecimento público do Estado do Ceará, Brasil. Os limites de detecção obtidos variaram entre 7,47 × 10⁻⁹ e 1,80 × 10⁻⁸ mol L–1 para as três matrizes
de águas naturais brutas avaliadas. Os valores percentuais médios de recuperação (98,86% ± 0,72), repetibilidade (0,32% ± 0,05) e reprodutibilidade (0,91% ± 0,20) foram significativos, reafirmando a sensibilidade do procedimento. A energia dos orbitais LUMO e as cargas atômicas de Mülliken foram calculadas usando o funcional BLYP/DNP. Os resultados teóricos, aliados aos critérios de diagnóstico da voltametria de onda quadrada, indicam que o mecanismo redox da dexametasona está associado a processos de redução quase-reversível e irreversível dos grupos cetona localizados em C-20 e C-3, respectivamente.
This paper describes an electroanalytical methodology using square-wave adsorptive voltammetry, which has been successfully applied for the direct determination of dexamethasone residues in raw natural waters used for the public supply of the Ceará State, Brazil. The obtained detection limits ranged from 7.47 × 10⁻⁹ to 1.80 × 10⁻⁸ mol L–1 for the three matrices of raw
natural waters evaluated. High percentages of average recovery (98.86% ± 0.72), repeatability (0.32% ± 0.05) and reproducibility (0.91% ± 0.20) were obtained in these samples, reaffirming the sensitivity of the procedure. Energy of the LUMO orbitals and Mülliken’s atomic charges were calculated using the functional BLYP/DNP. The theoretical results allied to the diagnostic criteria of the square-wave voltammetry indicate that the dexamethasone redox mechanism is associated to the quasi-reversible and irreversible reduction process of the ketone groups located at C-20 and C-3, respectively.
Keywords: dexamethasone, raw natural waters, direct analysis, square-wave adsorptive
voltammetry
Introduction
The absence of a sustainable planning during the process of land occupation, intensified in Brazil from the 60’s, caused serious impacts on society as a whole, due to various environmental disequilibra caused, such as contamination of drinking water supplies, constituting a strong threat to national economy and public health.1 This,
associated to difficulty of access, seasonal vulnerability and irregular distribution, has forced the population to survive under intense rationing policy.2
of impermeable crystalline rocks in the soil, high rates of evapotranspiration, long period of dry season and low levels of water retention still has left many victims of drought in the countryside.
Beyond the problems of scarcity, the water reservoirs have been continually contaminated for a variety of micropollutants (µg L–1 to ng L–1), from discharge of
domestic and/or industrial effluents, which persist in the aquatic environment, even after passing through the processes employed in water and sewage treatment plants.4
This problem has been observed in many reservoirs of the Ceará, such as Gavião and Ayres de Souza dams, responsible for the water public supply of Fortaleza and Sobral cities, respectively, which shows evidence of the evolutionary framework of eutrophication, due to the discharge of these wastes without any treatment, alerting the population to a possible status of public calamity.5
Many of these substances are of great scientific interest due to their ability to interfere with the endocrine system of humans and other animals, as well as their offspring, blocking, mimicking, stimulating and/or inhibiting the production of natural hormones.4,6,7 These natural or
synthetic contaminants are known as endocrine disruptors (EDs) and have been one of the most relevant topics in environmental chemistry in terms of water quality.2,4,6,7
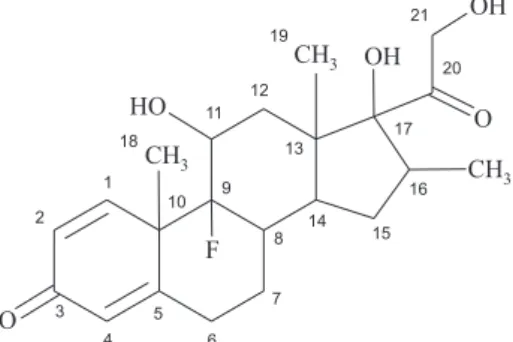
Dexamethasone, 9-fluoro-11β,17,21-trihydroxy-16α -methylpregna-1,4-diene-3,20-dione, represented by DMZ (Figure 1), is an important catabolic steroid that has a 40-fold greater potency than natural glucocorticoids, such as cortisol and corticosterone, with strong anti-inflammatory and immunosuppressive action.8
Despite its usefulness in the human and veterinary medicine, special care has been dedicated to this drug due to its characteristics as an endocrine disruptor. In vitro
studies have shown that by acting directly on the granulosa cell, it stimulated progesterone production or could disrupt ovarian steroidogenesis by inhibiting luteinizing hormone (LH) secretion.9,10 Some authors have reported that it may
produce irreversible morphological alterations on the
female reproductive tract through changes in the ovarian steroidogenic enzymes, and by inhibiting gonadotrophin secretion/action, which in turn caused infertility.11 In
addition, Illera et al.8 have stated that a single dose of DMZ
may disrupt gonadal function in adult female rats even after dexamethasone is undetectable by conventional assay methods, consequently disturbing reproductive function and possibly leading to infertility. Complementing this discussion, Skinner et al.12 reported that extremely low doses
of EDs may be capable of inducing adverse effects in animals and, in the precautionary principle, the contact of these substances on humans should be avoided to the maximum.
Thus, the development of precise methods for quantification of residues of these compounds in different environmental matrices allowed the adoption of necessary providence for the control and management of pollution sources.13-15 Electroanalytical methods can be interesting
alternatives for this purpose, due to their sensitivity, selectivity, and relatively short time of analysis in comparison with traditional analytical procedures.15-18
Square-wave adsorptive voltammetry (SW-AdsV) is a well-established and fast electroanalytical technique and has been applied in the analysis of DMZ in different matrices, such as pharmaceutical preparations and biological fluids.13,16,17 It has the advantages of allow low detection
and quantification limit, high sensitivity, wide spectrum of the test material and analytes with insignificant matrix effect, speed, and relatively low cost of analysis.15,16 To our
knowledge, there are no studies available in the literature concerning the determination of residues of this drug in trace concentration in natural waters, especially regarding direct application in raw waters with different levels of organic matter, and several other dissolved contaminants.
Thus, the aim of this study was to develop an electroanalytical methodology employing SW-AdsV, for the direct determination of DMZ residues in trace concentrations present in raw natural waters, using the Gavião and Ayres de Souza dams, without any step of clean up or extraction procedure.
Experimental
Equipments and reagents
electrode, and a hanging mercury drop electrode (HMDE, 663 VA Stand, Metrohm-Eco Chemie) with a surface area of 0.52 mm2 as a working electrode. A Micronal B474
pH meter equipped with a Ag/AgCl/KClsat combined electrode was used to adjust the pH values. All solutions were prepared with water purified by a Milli-Q system (Millipore Corp.).
A 1.0 × 10⁻⁵ mol L-1 standard aqueous stock solution
of DMZ (CAS: 2392-39-4)was prepared using USP-grade DMZ; it was stored in a dark flask and under refrigeration. Other standard solutions were obtained by diluting a certain amount of stock standard solution with purified water to the desired concentration. The 0.04 mol L–1 Britton-Robinson
(BR) buffer solutions, used as the supporting electrolyte, were prepared as described in the literature and the pH was adjusted to the desired value by adding appropriate amounts of 0.2 mol L–1 NaOH stock solution.19 All reagents used
were analytical grade.
Electroanalytical procedure
Before each experiment, a stream of high-purity N2 was passed through the solution for 10 min. Negative scans were then performed from 0.0 V to –1.4 V, using
cyclic voltammetry (CV) and SW-AdsV techniques. After selecting the best conditions of the pH electrolyte, the effect of analyte preconcentration onto the HMDE surface was evaluated, varying accumulation potential and time. The optimisation of the analytical procedure for SW-AdsV was also carried out following a systematic study of the other experimental parameters that affect the responses, such as pulse potential frequency (f), amplitude of the pulse (a), and height of the potential step (∆Es), in relation to peak
current and maximum selectivity (half-peak width). Then, analytical curves were performed in purified water in order to assess the sensitivity of the method and its possible application to evaluate the levels of DMZ in natural waters. The recovery experiments were carried out by standard additions of the DMZ stock solution to the supporting electrolytes. All measurements were taken in triplicate, and the value [DMZ]found refers to the concentration
obtained by extrapolation of the analytical curves. The standard deviation of the mean intercept measured, for ten replicates, at the reduction potential of the DMZ compound was used together with the slope of the straight lines of the analytical curves in the determination of the limit of detection (LOD) and limit of quantification (LOQ). The accuracy of the procedure was evaluated based on recovery efficiencies (recovery %), which was calculated from the ratio between the found concentration value and the previously added concentration. In case of precision, it
was performed based on repeatability experiments realised with ten measurements with the same DMZ standard solution (intraday) and with five measurements in different days with different DMZ standard solutions in the same concentration (interday).20,21 All measurements were made
at room temperature.
Sampling and physicochemical analysis of the raw natural waters
The raw natural water samples were collected at three different sampling points located in two dams: the Gavião dam (points GD1 and GD2) and the Ayres de Souza dam (point ASD) in the State of Ceará, Brazil. These dams are used for fishing, recreational activities and, primarily, the supply of water to the cities of Fortaleza and Sobral. The strategic sampling points were selected in areas close to the discharge of untreated domestic and industrial sewage, in order to compare the robustness of the procedure. The quality of these waters has been evaluated for simultaneous physicochemical analysis, based on standard methodologies described by APHA,22 which are discussed later. Water
samples were collected in amber glass bottles, transported to the laboratory in charge and kept under refrigeration (± 5 °C) until the time of analyse, following the range of recommended storage time for each parameter.
Application of the electroanalytical procedure in raw natural waters
Once constructed the analytical curve, the sensitivity, accuracy and precision of the procedure, and the interference of matrix components from raw natural waters in comparison to purified water, were evaluated. For this, electrochemical measurements were performed without any pre-treatment of samples, so that even water from dams was used in preparing the supporting electrolyte, similarly to the procedure employed in purified water. The recovery experiments were carried out by standard additions of the DMZ stock solution to the supporting electrolytes and all experiments were taken in triplicate.
Results and Discussion
Effect of pH in the electrochemical behaviour of DMZ
Firstly, a study of the electrochemical behaviour of 2.91 × 10⁻⁵ mol L-1 DMZ solution, from 0.0 to –1.4 V, was
carried out by square-wave voltammetry over the pH range of 2.0 to 12.0 in the 0.04 mol L-1 BR buffer solution. This
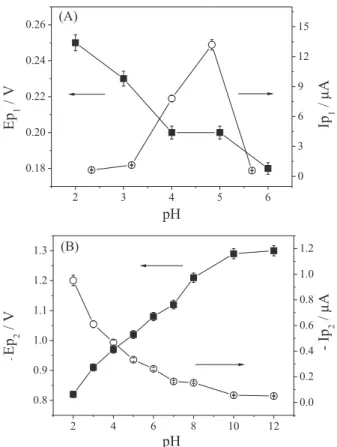
processes up to pH 7.0. For the first peak, the peak current (Ip) increased up to pH 5.0 and decreased at higher values. For the second peak, the most significant peak current was recorded at pH 2.0, gradually decreasing with increasing pH, as can be seen in Figure 2A for peak 1, and Figure 2B for peak 2.
From pH 7.0, the first peak completely disappears and the second peak undergoes a deformation in the voltammetric profile. This deformation in peak 2 may be related to a transitional state among protonated, neutral and unprotonated DMZ derivatives. Some researchers have reported the difficulties in observing these intermediaries separately, due to the electrochemical properties being quite similar.16,23
A linear shift was observed in peak 2 to more negative peak potential (Ep) values with increasing pH, suggesting a reaction with the participation of protons. It can be expressed by the following regression expression:
– Ep (mV) = 718.8 + 58.9 pH (1)
As can be observed, the value of ∂Ep/∂pH was close to 60 mV/pH, an ideal value for reactions with the same
number of protons and electrons involved in redox reactions. Recently, Goyal et al.17 have shown that this
process involves two protons and two electrons per DMZ
molecule, employing 1H NMR. In addition, DMZ has two
pKa values, so that the first protonation of this molecule
should occur in the conjugated ketone group, i.e., another
evidence of the strong dependence of this reactive site with the protons concentration. In the case of peak 1, Ep values remain virtually constant with a variation in pH, showing that it is independent of proton concentration in the solution.
The value of Ip for peak 1 at pH 2.0 is already quite significant. This information, together with the fact that the increase in pH causes a shift of peak 2 to more negative Ep values, was used as criteria for the choice of pH 2.0
as the optimum condition for the development of this methodology. A DMZ square-wave voltammogram with net, forward and backward components for both peaks in this same pH is represented in Figure 3, so that the peak 1 was recorded at –0.21 V and peak 2 at –0.83 V.
Mechanistic aspects
From the cyclic voltammetric results, it is possible to observe that both DMZ reduction processes are independent, since different scans exhibit isolated processes; 0.0 to
–0.5 V for peak 1 and –0.5 to –1.4 V for peak 2; or both
processes simultaneously, 0.0 to –1.4 V; without a decrease
in the intensity of peak currents or an alteration in ∆Ep/2. Analysing the DMZ molecule as a whole, it was observed that resonance effects at C-3 gives much greater stability to this reactive site if compared to the steric effect observed at C-20. Therefore, it is expected that one reduction process will be observed for each particular ketone group. Thus, Figure 2. Behaviour of peak current and peak potential regarding to the
corresponding pH, for peak 1 (A) and peak 2 (B), using 2.91 × 10⁻⁵ mol L–1
of DMZ in BR buffer pH 2.0, on the HMDE with f = 100 s–1, a = 50 mV
and ∆Es = 2 mV.
Figure 3. Square-wave voltammograms for 2.91×10⁻⁵ mol L–1 of DMZ on
the HMDE in BR buffer, pH 2.0, with a scan potential ranging from 0.0 V to –1.2 V, f = 100 s–1, a = 50 mV and ∆E
s = 2 mV. Resultant component
the electrochemical signal associated with C-20 (peak 1) should appear at potentials less negative than C-3 (peak 2).
The reversibility of the processes was also evaluated by cyclic voltammetry. In the case of peak 1, the presence of anodic and cathodic peaks with different intensities and a slope close to the unit were found, from the relationship between log Ip and log v, according to equation 2,
representing a quasi-reversible system controlled by adsorption.
log (Ip / A) = –8.811 + 0.873 log (v / mV s–1) (2)
The cyclic voltammogram for peak 2 showed only one well-defined cathodic peak, which was an indication of an irreversible process. A straight line between Ip and v was
observed according to following equation:
–Ip (A) = 9.257×10⁻⁹ + 2.334×10⁻⁹v (mV s–1) (3)
Moreover, no linear displacement of Ep to more negative values with an increase of v was observed.
These data characterised an irreversible process with the redox mechanism controlled by adsorption of reagents and products.24 Due to adsorptive character of the DMZ
reduction processes, we chose to work with SW-AdsV as analytical technique.
Quantum-chemical studies
Theoretical and experimental studies have shown the importance of quantum-chemical studies to understand the electrochemical mechanistic aspects of numerous organic compounds.25 Here, this information was used
to determine the probable sites of reduction of the DMZ, considering its protonated form, because the studies were conducted at pH 2. In this case, the effect of protonation is an aspect that should be considered. The data presented below were obtained from DMOL 3 quantum-chemical software package of the Materials Studios, employing the method of generalized gradient approximation, using the functional BLYP and DNP basis set.
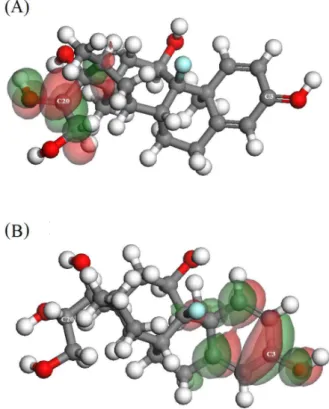
Initially, we performed the calculation of frontier molecular orbital HOMO (highest occupied molecular orbital) and LUMO (lowest unoccupied molecular orbital) of the DMZ before and after the first reduction process. The HOMO orbital indicates the region of the molecule where the oxidation process would be more likely, while the LUMO orbital is responsible for the entry of electrons in the molecule, indicating its site of reduction. Thus, for the DMZ reduction process, only the data for LUMO orbital will be emphasized. From Figure 4A, regarding
the protonated molecule of DMZ before the first reduction process, it is observed that the atoms C-13, C-16, C-20 and C-21 are those that present the greatest contribution to the formation of LUMO orbitals. In case of the second reduction process (Figure 4B), the largest contribution is observed from C-1 to C-5, C-9 and C-18.
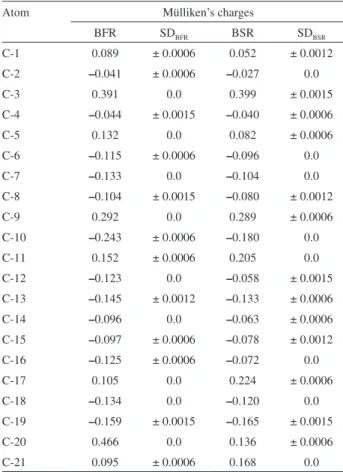
After this, the Mülliken’s charges for these atoms were calculated, based on three conformers of lowest energy, to investigate where the first and second reduction processes are more probable. The results are described in Table 1. According to the theoretical model, the more positive the value obtained, the greater the tendency to accept electrons and the greater the possibility of the occurrence of the reduction reaction. The results showed that the more positive values for Mülliken’s charges were observed in C-20 (charge = 0.466), before of the first reduction process, and in C-3 (charge = 0.399) before the second reduction process. Thus, from the quantum-chemical point of view, the peaks 1 and 2 are related to reduction processes occoring in C-20 and C-3, respectively.
of the DMZ, where the reduction at C-20 generates a corresponding hydroxy compound and at C-3, a pinacol.16
The proposed mechanism was based on well-defined theoretical model related to electrochemical mechanisms of steroidal anti-inflammatory, focusing in electrochemical reduction of conjugated and unconjugated ketone groups.26,27
Effect of accumulation of potential and time
The influence of the accumulation potential (Eacc) was investigated on the HMDE in BR buffer pH 2.0 by applying different potentials between –0.10 and –0.93 V
by SWV measurements with f = 100 s–1, a = 50 mV and
∆Es = 2 mV. For peak 1, the best condition was obtained at –0.60 V, due to the higher peak current observed. In the
case of peak 2, the current remained practically constant at –0.70 V, reducing substantially at higher values.
In relation to accumulation time (tacc), both processes maintained practically constant values after 15 s. Therefore, Eacc = –0.60 V and tacc = 15 s were chosen and employed
in the development of the electroanalytical methodology.
Voltammetric parameters
The SWV parameters were studied to determine the optimal values to provide the best analytical signal. For both peaks, the frequency was evaluated from 10 to 500 s–1.
At peak 1, no linear relationship was obtained between Ip and f, and the Ep values remained practically constant.
The amplitude showed a linear correlation between Ip and
a, from 5 to 50 mV. The obtained results with the scan
increment variations show that ∆Es > 2mV does not seem to offer a significant contribution to the peak currents. Thus, the optimized conditions for peak 1 were f = 100 s–1, a = 50 mV and ∆Es = 2 mV.
For peak 2, a linear dependence between Ip and f was
observed up to 100 s–1. For the amplitude of pulse values
above 15 mV, no linear relationship occurred. The Ip values showed a linear dependence with ∆Es variation (from 1 to
7 mV), but above 2 mV an increase of half-peak width was observed, which can decrease the selectivity of the procedure. Therefore, f = 100 s–1, a = 15 mV and ∆E
s = 2 mV were
employed as optimized conditions for peak 2.
Analytical curves
In an attempt to use peak 1 for analytical applications, it was found that the linearity range obtained between Ip and [DMZ] was very small, ranging only from 5.00 × 10⁻⁶ to
1.03 × 10⁻⁵ mol L-1, which would imply low values of LOD
and LOQ in comparison to other works.12,13,17 Moreover,
the Ip values obtained for [DMZ] > 7.94 × 10⁻⁶ mol L-1
had a significant loss of reproducibility, which negatively affected the values of recovery, precision and accuracy of the proposed methodology.
On the other hand, using the linearity range between 4.98 × 10⁻⁸ and 6.10 × 10⁻⁷ mol L–1 for peak 2, it was
possible to calculate LOD (2.54 × 10⁻⁹ mol L–1) and
LOQ (8.47 × 10⁻⁹ mol L–1) values in the same order
of magnitude as those already published.12,13,17 The
repeatability and reproducibility of the measurements were higher than those obtained for peak 1, showing that peak 2 should be considered as the most adequate proposal for analytical applications. Previously, our group reported the development of an electroanalytical procedure to determine DMZ in multicomponent commercial pharmaceutical formulations.16 The linear regression equation obtained
from the analytical curve is represented by:
– Ip (A) = –1.58×10⁻⁹ + 0.09 [DMZ] (4)
As can be observed, the intercept of the analytical curves was negative. Therefore, an evaluation of the Table 1. Mülliken’s charges in the DMZ molecule before of the first
(BFR) and before of the second (BSR) reduction processes with the corresponding standard deviation
Atom Mülliken’s charges
BFR SDBFR BSR SDBSR
C-1 0.089 ± 0.0006 0.052 ± 0.0012
C-2 –0.041 ± 0.0006 –0.027 0.0
C-3 0.391 0.0 0.399 ± 0.0015
C-4 –0.044 ± 0.0015 –0.040 ± 0.0006
C-5 0.132 0.0 0.082 ± 0.0006
C-6 –0.115 ± 0.0006 –0.096 0.0 C-7 –0.133 0.0 –0.104 0.0 C-8 –0.104 ± 0.0015 –0.080 ± 0.0012
C-9 0.292 0.0 0.289 ± 0.0006
C-10 –0.243 ± 0.0006 –0.180 0.0
C-11 0.152 ± 0.0006 0.205 0.0
C-12 –0.123 0.0 –0.058 ± 0.0015 C-13 –0.145 ± 0.0012 –0.133 ± 0.0006 C-14 –0.096 0.0 –0.063 ± 0.0006 C-15 –0.097 ± 0.0006 –0.078 ± 0.0012 C-16 –0.125 ± 0.0006 –0.072 0.0
C-17 0.105 0.0 0.224 ± 0.0006
C-18 –0.134 0.0 –0.120 0.0 C-19 –0.159 ± 0.0015 –0.165 ± 0.0015
C-20 0.466 0.0 0.136 ± 0.0006
presence of random errors was performed by a significance test in order to determine if the difference between the interception obtained in these analytical curves and the standard values originated from random error.28 The t-test
was used, according to equation 5, where –x is the average
from obtained interception values, µ is the standard value expected in the case of the interception being zero, n is the number of determinations, and s is the standard deviation of the current responses.
(5)
The calculated t value was4.01, which was lower than the critical value (tcritical = 4.30) at an assurance level of 95%, indicating that no considerable difference occurred from the calculated mean value to the standard expected value, and the negative interception was free from random errors. Thus, the obtained sensitivity and precision combined with the simplicity and low cost of the electroanalytical procedure, in comparison to other traditional analytical procedures, reaffirm that the proposal developed here can be successfully employed for practical applications, such as the electroanalytical determination of DMZ in complex samples.
Application of the method in raw natural waters
The developed electroanalytical procedure was applied to natural water samples, without any previous extraction or clean-up steps that could hinder direct determination, collected at different dams in the State of Ceará, Brazil. These water samples were used to prepare 0.04 mol L–1 BR
buffer solutions, with pH adjusted to 2.0 by addition of the
appropriate quantities of 1.0 mol L–1 NaOH solution, and
used as supporting electrolyte. These samples were then spiked with known concentrations of DMZ stock solutions and analytical curves were performed by SW-AdsV on the HMDE to evaluate the voltammetric responses and the influence of possible interferences. An example of the analytical curves obtained in raw natural waters from Gavião dam 1 is represented at Figure 5.
The results of the linear regression equation, and figures of merit obtained in purified water and different raw natural waters samples, are shown in Table 2. For concentration ranging from 4.98×10⁻⁸ and 6.10×10⁻⁷ mol L–1, LOD and
LOQ values in the supporting electrolyte and natural waters Figure 5. (A) Square-wave voltammograms for DMZ in raw natural waters from Gavião dam 1 on the HMDE, buffer solution at pH 2.0, employing f = 100 s–1, a = 15 mV, ∆E
s = 2 mV, Eacc = –0.60 V, tacc = 15 s
and concentrations in the interval from 1.48×10⁻⁷ to 1.50×10⁻⁶ mol L–1
of DMZ. (B) Average analytical curve obtained from voltammograms presented in A, including error bar.
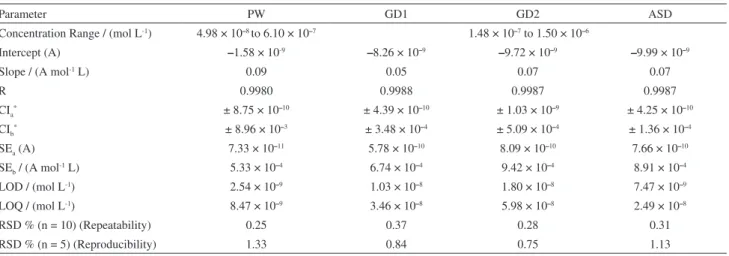
Table 2. Analytical parameters obtained for DMZ determination employing SW-AdsV on HMDE. PW = purified water; GD1: Gavião dam 1; GD2: Gavião dam 2; ASD: Ayres de Souza dam; r: correlation coefficient; CIa: confidence interval of the intercept; CIb: confidence interval of the slope; SEa: standard
error of the intercept; SEb: standard error of the slope; LOD: limit of detection; LOQ: limit of quantification; RSD: relative standard deviation
Parameter PW GD1 GD2 ASD
Concentration Range / (mol L-1) 4.98 × 10⁻⁸ to 6.10 × 10⁻⁷ 1.48 × 10⁻⁷ to 1.50 × 10⁻⁶
Intercept (A) –1.58 × 10⁻⁹ –8.26 × 10⁻⁹ –9.72 × 10⁻⁹ –9.99 × 10⁻⁹
Slope / (A mol-1 L) 0.09 0.05 0.07 0.07
R 0.9980 0.9988 0.9987 0.9987
CIa* ± 8.75 × 10⁻¹⁰ ± 4.39 × 10⁻¹⁰ ± 1.03 × 10⁻⁹ ± 4.25 × 10⁻¹⁰
CIb* ± 8.96 × 10⁻³ ± 3.48 × 10⁻⁴ ± 5.09 × 10⁻⁴ ± 1.36 × 10⁻⁴
SEa (A) 7.33 × 10⁻¹¹ 5.78 × 10⁻¹⁰ 8.09 × 10⁻¹⁰ 7.66 × 10⁻¹⁰
SEb / (A mol-1 L) 5.33 × 10⁻⁴ 6.74 × 10⁻⁴ 9.42 × 10⁻⁴ 8.91 × 10⁻⁴
LOD / (mol L-1) 2.54 × 10⁻⁹ 1.03 × 10⁻⁸ 1.80 × 10⁻⁸ 7.47 × 10⁻⁹
LOQ / (mol L-1) 8.47 × 10⁻⁹ 3.46 × 10⁻⁸ 5.98 × 10⁻⁸ 2.49 × 10⁻⁸
RSD % (n = 10) (Repeatability) 0.25 0.37 0.28 0.31
RSD % (n = 5) (Reproducibility) 1.33 0.84 0.75 1.13
were different. The most probable explanation for this problem is the higher quantity of dissolved organic matter present in the aquatic environment that is adsorbed on the electrode surface, decreasing the active area, and competing with the DMZ molecules. Moreover, as can be seen in the Experimental section, these samples were collected in areas with a large presence of sediments, detritus rich in organic matter, where its mineralization is associated to environmental conditions, such as redox potential, dissolved oxygen, pH and temperature,1 indicating the
likely presence of humic acids. Studies with natural waters showed that these substances can interact with other dissolved compounds in the environment,14,29 in this case
DMZ molecules, which can reduce their concentration in the electrochemical cell. Recently, Botero et al.7 showed
that some drugs can interact with ionized oxygenated groups of aquatic humic substances, through hydrogen bonds, which can strongly influence the transport and reactivity of these contaminants in aquatic systems. Similar discussions can also justify the differences in the linear regression results obtained for purified water and raw natural water samples (Figure 6).
Table 3 reports data regarding physicochemical parameters used to evaluate the quality of the waters. Among these, chlorophyll A, DBO5, dissolved total
organic carbon and thermotolerant coliforms confirmed the negative impacts from untreated effluents in these waters. One of the major consequences observed in loco, it was
the proliferation of the aquatic macrophytes, floating and submerged, considered bioindicators of organic matter in decomposition, and it represents a serious risk to aerobic animals, for the threat of hypoxia in the environment.1
This phenomenon is triggered by nutrients derived from phosphorous and nitrogen, evidenced by total phosphorous and nitrogen results. Therefore, when a drug is determined
directly in these waters, it is necessary that an analytical method is selective and particularly robust, because of the complexity of the environmental matrix.
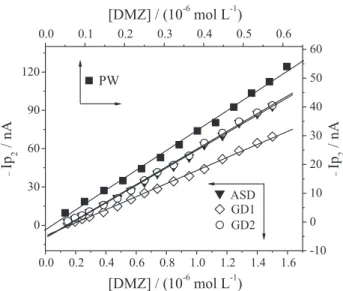
As can also be seen in Figure 6, the linear regression equation presents a negative intercept. As such, the paired
t-test was used, according to equation 6, where d and s– d are
the average and standard deviations respectively of d, the difference between the values obtained in pure electrolyte and in natural water samples, and n is the number of determinations. The calculated t values were 3.80, 4.06 and
4.10 for GD1, GD2 and ASD, respectively, which represent values lower than the theoretical critical value (tcritical = 4.30)
at an assurance level of 95%.28 This is confirmed by the
inclinations obtained in all natural water samples, which Figure 6. Response of peak currents as a function of corresponding concentration of DMZ, ranging from 4.98×10⁻⁸ to 6.10×10⁻⁷ mol L–1
in purified water and 1.48×10⁻⁷ to 1.50×10⁻⁶ mol L–1, on the HMDE in
BR buffer (pH 2.0), employing f = 100 s–1, a = 15 mV and ∆E s = 2 mV,
Eacc = –0.60V, tacc = 15 s. Purified water (), Gavião dam 1 (), Gavião dam 2 () and Ayres de Souza dam ().
Table 3. Physicochemical parameters for the raw natural waters. GD1: Gavião dam 1; GD2: Gavião dam 2; ASD: Ayres de Souza dam
Parameter GD1 GD2 ASD
pH / 25 °C 7.65 7.65 7.40
Chlorophyll A / (µg L–1) 43 125 ≤ 0.2
NO3– / (mg N per L) 0.036 ≤ 0.035 ≤ 0.035
NO2– / (mg N per L) ≤ 0.005 ≤ 0.005 0.006
NH3 / (mg N per L) ≤ 0.1 ≤ 0.1 ≤ 0.1
Total Nitrogen / (µg L–1) 550 2127 446
PO43– / (mg P per L) ≤ 0.01 ≤ 0.01 0.013
Total Phosphorous / (µg L–1) 82 44 69
Thermotolerant Coliform / NMP per 100 mL 15.43 15.43 50.00
BOD5 / (mg O2per L) 10.29 10.29 10.80
were similar to inclinations obtained in purified electrolyte, confirming the hypotheses that the analytical sensitivity in natural water samples and in purified water were practically equal, and that these experiments were free from random errors.
(6)
On the other hand, a comparison of the various values obtained for LOD and LOQ in the different natural waters, in comparison to purified water, indicates that the impurities cause no discrepant influence on the final analytical result. Massaropi et al.30 have reported that the lower slope value,
compared to purified water, is compensated by a smaller variation for the blank responses, and this is an important finding as no clean-up step was included in the present study, which is imperative for chromatographic methods. However, although antropic and natural activities contribute to an increase in the concentration of organic matter, and consequently an increase in LOD and LOQ values, these values were sufficiently small, with orders of magnitude very close to that seen in purified water, indicating that this technique can be successfully used in the direct analysis of DMZ residues in raw natural waters. Moreover, despite the complexity of the samples, no other electrochemical process was detected, associated with several species dissolved in natural water, which gives selectivity and ruggedness to the developed procedure.
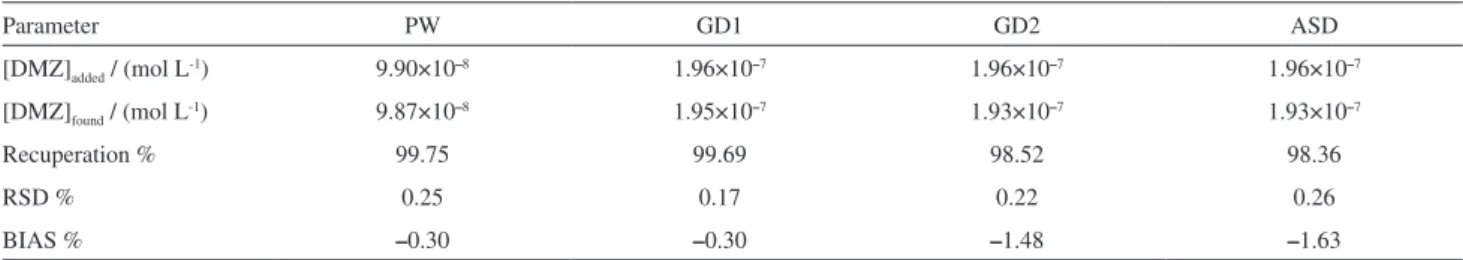
Finally, in artificially contaminated samples, recovery experiments were performed by the standard addition technique. The obtained results are presented in Table 4, showing that the recovery values in GD1 (99.69%), GD2 (98.52%) and ASD (98.36%) were very significant, in addition to showing considerable repeatability and reproducibility. The calculated BIAS values were –0.30%, –1.48% and –1.63% for GD1, GD2 and ASD, respectively,
demonstrating the accuracy and precision of the method,31
and confirming this methodology as an excellent alternative for the direct determination of DMZ residues in natural waters.
Conclusions
This paper reports the success in the utilization of SW-AdsV for the direct determination of DMZ in environmental samples. An electrochemical study of 5×10⁻⁶ mol L-1 DMZ
solution showed two reduction processes associated to C-20 and C-3, representing a quasi-reversible and irreversible mechanism, respectively, with a strong adsorptive character on the HMDE.
The very low LOD values and high levels of repeatability and reproducibility obtained in raw natural water allowed the direct application of this methodology in the electroanalysis of DMZ in trace concentrations, without any clean-up step. Standard addition experiments found recovery values ranging between 98.36 and 99.69%, indicating that matrix effects can be satisfactorily reduced.
Differences between the figures of merit in purified and raw water are due to the adsorption of organic matter and/or other possible dissolved contaminants in the environment. However, the order of magnitude of these values was quite similar, showing that such a procedure can be applied with success in the direct electroanalytical determination of DMZ in complex environmental samples, in addition to giving robustness and selectivity to the developed method.
Acknowledgments
The authors wish to thank the Brazilian research funding institutions CNPq, CAPES, FINEP for their financial support and to Prof. David Lima Azevedo (DQ-UFMA) for the assistance in the theoretical calculations. T. M. B. F. Oliveira would also like to thank the UERN for the award of a fellowship.
References
1. Oliveira, T. M. B. F.; Di Souza, L.; Castro, S. S. L.; Ecl. Quim.
2009, 34, 17.
2. Baird, C.; Química Ambiental, 2nd ed.; Bookman: Porto Alegre,
2002.
Table 4. DMZ recuperation in purified water and natural waters from dams in the State of Ceará, using SW-AdsV on HMDE. PW = purified water; GD1 = Gavião dam 1; GD2 = Gavião dam 2; ASD = Ayres de Souza dam
Parameter PW GD1 GD2 ASD
[DMZ]added / (mol L-1) 9.90×10⁻⁸ 1.96×10⁻⁷ 1.96×10⁻⁷ 1.96×10⁻⁷
[DMZ]found / (mol L-1) 9.87×10⁻⁸ 1.95×10⁻⁷ 1.93×10⁻⁷ 1.93×10⁻⁷
Recuperation % 99.75 99.69 98.52 98.36
RSD % 0.25 0.17 0.22 0.26
3. Fernandez, M. A.; Limaverde, A. M.; Castro, I. B.; Almeida, A. C. M.; Wagener, A. L. R.; Cad. Saúde Pública 2002, 18, 463.
4. Bila, D. M.; Dezotti, M.; Quim. Nova 2007, 30, 651. 5.
http://www.srh.ce.gov.br/index.php/projetos-especiais/pacto-das-aguas, accessed in May 2011.
6. Ghiselli, G.; Jardim, W. F.; Quim. Nova 2007, 30, 695
7. Botero, W. G.; Oliveira, L. C.; Cunha, B. B.; Oliveira, L. K.; Goveia, D.; Rocha, J. C.; Fraceto, L. F.; Rosa, A. H.; J. Braz. Chem. Soc. 2011, 22, 1103.
8. Illera, J. C.; Silván, G.; Martínez, M. M.; Blass, A.; Peña, L.;
J. Physiol. Biochem. 2005, 61, 429.
9. Botero, L. F.; Roberts Jr., C. T.; LeRoith, D.; Adashi, E. Y.; Hernández, E. R.; Endocrinology 1993, 132, 2703.
10. Huang, T. J.; Shirley Li, P.; Biol. Reprod. 2001, 64, 163.
11. Illera, J. C.; Silván, G.; Martínez-Mateos, M. M.; Blass, A.; Lorenzo, P. L.; Illera, M.; Anal. Chim. Acta 2003, 483, 225.
12. Skinner, M. K.; Manikkam, M.; Guerrero-Bosagna, C.; Reprod. Toxicol. 2011, 31, 337.
13. Ghoneim, E. M.; El-Attar, A.; Ghoneim, M. M.; J. AOAC Int.
2009, 92, 597.
14. Rezaei, B.; Zare, S. Z. M.; Ensafi, A. A.; J. Braz. Chem. Soc.
2011, 22, 897.
15. Gupta, V. K.; Jain, R.; Radhapyari, K.; Jadon, N.; Agarwal, S.;
Anal. Biochem. 2011, 408, 179.
16. Oliveira, T. M. B. F.; Ribeiro, F. W. P.; Soares, J. E. S.; De Lima-Neto, P.; Correia, A. N.; Anal. Biochem. 2011, 413, 148.
17. Goyal, R. N.; Chatterjee, S.; Rana, A. R. S.; Electroanalysis
2010, 22, 2330.
18. De Lima-Neto, P.; Correia, A. N.; Portela, R. R.; Juliao, M. S.; Linhares-Junior, G. F.; Lima, J. E. S.; Talanta 2010, 80, 1730.
19. Britton, H. T. S.; Robinson, R. A.; J. Chem. Soc. 1931, 458, 1456.
20. Mocak, J.; Bond, A. M.; Mitchell, S.; Scollary, G.; Pure Appl. Chem. 1997, 69, 297.
21. Skoog, D. A.; West, D. M.; Holler, F. J.; Fundamentals of Analytical Chemistry, 7th ed., Saunders College: Philadelphia,
1996.
22. APHA, Standard Methods for the Examination of Water and Waste Water, 20th ed., American Public Health Association: New
York, 1998.
23. De Boer, H. S.; Den Hartigh, J.; Ploegmakers, H. H. J. L.; Van Oort, W. J.; Anal. Chim. Acta 1978, 102, 141.
24. Gosser Jr, D. K.; Cyclic Voltammetry: Simulation and Analysis
of Reaction Mechanisms, VCH Publ.: New York, 1994.
25. Toledo, R. A.; Mazo, L. H.; Santos, M. C.; Honório, K. M.; Silva, A. B. F.; Cavalheiro, É. T. G.; Quim. Nova 2005, 28, 456.
26. Fry, A. J.; Synthetic Organic Electrochemistry, 2nd ed., John
Wiley: New York, 1989.
27. De Boer, H. S.; Van Oort, W. J.; Zuman, P.; Anal. Chim. Acta
1981, 130, 111.
28. Miller, J. N.; Miller, J. C.; Statistics and Chemometrics for Analytical Chemistry, 5th ed., Pearson Prentice Hall: United
Kingdom, 2005.
29. Sibley, S. D.; Pedersen, J. A.; Environ. Sci. Technol. 2008, 42,
422.
30. Massaroppi, M. R. C.; Machado, S. A. S.; Avaca,L. A.; J. Braz. Chem. Soc. 2003, 14, 113.
31. Taverniers, I.; Loose, M. D.; Bockstaele, E. V.; Trends Anal. Chem. 2004, 23, 535.
Submitted: June 5, 2011