Artigo
*e-mail: [email protected]
SODIUM DODECYL SULFATE COATED γ-ALUMINA SUPPORT MODIFIED BY A NEW SCHIFF BASE FOR
SOLID PHASE EXTRACTION AND FLAME-AAS DETERMINATION OF LEAD AND COPPER IONS
Ardeshir Shokrollahi*, Morteza Montazerozohori and Tahere Mehrpour
Department of Chemistry,Yasouj University,Yasouj, 75918-74831, Iran
Hossein Tavallali, Batool Zare Khafri and Zohreh Montaseri
Department of Chemistry, Payame Noor University, Shiraz, 71365-944, Iran
Recebido em 21/3/13; aceito em 16/5/13; publicado na web em 25/7/13
A simple and fast approach for solid phase extraction is herein described, and used to determine trace amounts of Pb2+ and Cu2+
metal ions. The solid phase support is sodium dodecyl sulfate (SDS)-coated γ-alumina modified with bis(2-hydroxy acetophenone)-1,6-hexanediimine (BHAH) ligand. The adsorbed ions were stripped from the solid phase by 6 mL of 4 M nitric acid as eluent. The eluting solution was analyzed by flame atomic absorption spectrometry (FAAS). The sorption recovery of metal ions was investigated with regard to the effects of pH, amount of ligand, γ-alumina and surfactant and the amount and type of eluent. Complexation of BHAH with Pb2+ or Cu2+ ions was examined via spectrophotometry using the HypSpec program. The detection limit for Cu2+ was
7.9 µg L-1 with a relative standard deviation of 1.67%, while that for Pb2+ was 6.4 µg L-1 with a relative standard deviation of 1.64%. A
preconcentration factor of 100 was achieved for these ions. The method was successfully applied to determine analyte concentrations in samples of liver, parsley, cabbage, and water.
Keywords: solid phase extraction; Pb2+ and Cu2+ ions; BHAH.
INTRODUCTION
Every day, people are exposed to a variety of chemical contami-nants in food, air and manmade materials in homes and the workplace. Typically, chemical exposures are nominal, producing no recognizable health impact. But some exposures, such as high lead concentrations in aging homes, are a critical health concern especially for children.1 In recent years; a strong secular trend toward decreasing blood lead concentrations has been noted in the general population after many of the current environmental measures were adopted such as reduction in the use of leaded gasoline.2
Copper, an element essential for many biological systems, plays an important role in carbohydrate and lipid metabolism. In general, copper at nearly 40 µg L−1 is required for normal metabolism of many living organisms; however, in higher levels it is considered to be toxic and severe oral intoxication will mainly affect the blood and kidneys.3 Therefore, the ability to identify trace amounts of Cu2+ and Pb2+ ions in water is of great significance to public health and environmental safety.
The determination of trace elements in biological and environ-mental samples is particularly difficult because of the complex matrix and the usually low concentration of these elements in such samples, which requires sensitive instrumental techniques and frequently a preconcentration step. Although atomic absorption spectrometric methods, used either in the flame or graphite furnace mode (FAAS and ET-AAS), are a powerful analytical tool for the determination of trace elements in a great number of samples, preconcentration and separation of the metal ions with different chelating agents are still necessary for improvement of the detection limit.
Several methods have been proposed for separation and pre-concentration of trace amounts of Cu2+ and Pb2+ ions. These include cloud point extraction,4 precipitation/co-precipitation.5 liquid–liquid extraction6 and solid-phase extraction (SPE).7
In fact, solid phase extraction has become known as a powerful
procedure for separation and enrichment of various inorganic and organic analytes.8,9 It has several advantages over other techniques, including stability and reusability of the solid phase, reach of high preconcentration factors, easiness of separation and enrichment under dynamic conditions, no need for organic solvents and minimal costs due to low consumption of reagents. Several selective solid phase extractors have been prepared either by physical loading or chemical binding of selected chelating reagents to different solid supports such as silica gel,10,11 activated carbon,12,13 SDS-coated alumina,14 modi-fied chromosorb,15 ion-imprinted polymers,16 Amberlite XAD-2000 resin,17 Sepabeads SP70,18 Diaion SP-850,19 nano particles20,21 and natural beds.22,23
The purpose of this work is to investigate the feasibility of using sodium dodecyl sulfate (SDS)-coated γ-alumina modified with Bis(2-hydroxy acetophenone)-1,6-hexanediimine (BHAH) as a substrate for adsorption of Cu2+ and Pb2+ ions, to determine their concentrations by flame atomic absorption spectrophotometry.
EXPERIMENTAL
Instruments
A GBC (Australia) SensAA double beam atomic absorption spectrometer equipped with deuterium background correction, and hollow cathode lamps of copper and lead as the radiation source, was used for absorbance measurements at wavelengths of 327.4 and 283.3 nm. The acetylene flow rate and burner height were adjusted in order to obtain the maximum absorbance signal while aspirating the analyte solution. A Jenway pH meter, model 3510, was used for pH measurements. An Adam model 220 LA electronic analytical balance was used for weighing the solid materials.
Reagents and solutions
distilled deionized water was used throughout. Nitrate salts of lead, copper and the other salts were obtained from Merck Company at the highest purity available, and used without any further purifica-tion. Tetraethyl ammonium perchlorate (TEAP) was synthesized according to reference.24 Lead perchlorate was purchased from Alfa Aesar Company. The pH of the solutions was adjusted by adding hyd-rochloric acid or sodium hydroxide. For spectrophotometric studies, all solutions were prepared in acetonitrile solvent, tetrahydrofuran (THF) from Merck Company (Darmstadt, Germany).
Preparation of 2 Bis(2-hydroxy acetophenone)-1,6-hexanedii-mine (BHAH)
A solution of 2-hydroxy acetophenone (2 mmol) in absolute ethanol (EtOH) (15 mL) was added to a solution of 1,6-hexane-diimine (1 mmol) and boiled under reflux for 4 h. The reaction mixture was kept in the refrigerator overnight. After evaporation of the solvent, the product was obtained as a yellow crystalline powder. The crystals were filtered and washed twice with a mixture of cooled ethanol/water, and dried under air (85% yield). Elemental analysis, % C22H28N2O2: Calculated: C, 74.97; H, 8.01; N, 7.95; found: C, 73.9; H, 8.2; N, 7.7. IR (KBr, cm-1): 3430 (bs, νOH), 3057 (w, CH- Aromatic), 2922 (w, CH- aliphatic), 1613 (-C=N), 1572 (C=C), 1504 (m), 1442 (m, C=C), 1381 (m), 1373 (s, C-N), 1298 (m), 1257 (m), 1226 (m), 1157 (s), 1063 (m, C-O), 1027 (m, C-O), 913 (m), 827 (s), 753 (s), 641 (m), 503 (m). The structure of ligand is shown in Figure 1.
Spectrophotometric titration
Standard stock solutions of BHAH ligand (1.0×10⁻³ mol L−1), Cu2+ or Pb2+ ions (1.0×10⁻³ mol L−1) were prepared by dissolving exactly weighted amount of BHAH ligand, Cu(NO3)2.3H2O or Pb(ClO4)2 in pre-calibrated 25.0 mL volumetric flasks and diluting to the mark with acetonitrile. Working solutions were prepared by dilution of the stock solutions. Titration of a 2.6 mL aliquot of BHAH ligand solution (3.8 × 10⁻⁵ mol L−1) was carried out at 25.0 °C in 0.05 mol L−1 TEAP by using a pre-calibrated microsyringe to add solutions of Cu2+ or Pb2+ ions (1.0 × 10⁻³ mol L−1). The spectra were recorded after each addition (Figure 2).
Preparation of BHAH coated γ-Alumina
About 1.0 g of γ-alumina was added to 50 mg of SDS and mixed with a magnetic stirrer. After addition of 25 mg BHAH ligand dis-solved in 3 mL THF, the pH was adjusted to approximately 2.5 by addition of 1 mol L−1 HCl. The solution was shaken for 30 min and filtered to prepare the solid phase. The pH of 250 mL of the solution was adjusted to 6.0 with hydrochloric acid, and passed through the solid phase column at a flow rate of 2 mL min-1. The analyte was then eluted with 6 mL of 4 mol L−1 nitric acid. The metal ion content of the eluent was measured by FAAS. The same eluate was used to determine all analytes.
Pretreatment of real samples
Parsley and cabbage were purchased from Shiraz, Iran. A 40 g sample of parsley or cabbage was transferred to an oven at 120 °C for 1 h, then incubated in a furnace for 2 h at 300 °C and for an additional 2 h at 500 °C. The residue was cooled, and treated with 2.0 mL of hydrochloric acid solution (2 mol L−1). The filtrate, washings and volume were made up to the mark in a 500 mL volumetric flask and used for solid phase extraction and atomic absorption measurements.25
Water samples were analyzed as follows, to determine their anal-yte content. About 500 mL of sample was passed through a sintered glass funnel, and 1 mL concentrated HNO3 was added for elimination and decomposition of micro-organisms. The water samples were stored in polyethylene bottles. Then, the given procedure in general procedure section was applied for analysis.
A liver sample (50 g) was dried for 48 h in an oven at 120 °C to remove water and to obtain a constant weight (about 68% water). The dried liver sample was transferred into a glass flask. For diges-tion of the sample, a concentrated acid mixture of 3 mL H2SO4, 15 mL HClO4, and 15 mL HNO3 was added and the sample was left to stand overnight. The solution was kept in an oil bath at 50 °C until the foaming stopped. The temperature was then increased to 150 °C, and heating was continued until the brown fumes of nitrogen oxides had ceased to evolve. When a dark brown mixture was obtained, the flask was cooled for about 2 min prior to addition of 5 mL nitric acid. Heating was again continued until nitrogen oxide fumes ceased to evolve. The appearance of white fumes of perchloric acid in 1 mL of solution is an indication of complete digestion.26
RESULTS AND DISCUSSION
Study of complexation between BHAH ligand and metal ions
The complexation between the BHAH Schiff base and the Cu2+ or Pb2+ ions was investigated via spectrophotometry. The solutions were titrated according to spectrophotometric titration procedures, and the spectra were recorded. As shown in Figure 2a, significant changes in the ligand spectrum occurred after Cu2+ ions were added, upon which a new peak appeared at about 258-300 nm. Addition of Pb2+ ions cau-sed one of the original peaks of the BHAH (at about 290-340 nm) to gradually vanish, and two new peaks to appear at about 258-300 nm and 340-400 nm. Their intensity increases at higher concentrations of Pb2+ ion, with very clear isobestic points, as shown in Figure 2d. These results indicate relatively strong interaction between BHAH and the metal ions. Analyzing the spectral data over the ranges of 260-288 nm and 260-280 nm yielded the stoichiometry and stability constants of the ligand with Cu2+ and Pb2+ ions, These were calculated by using the HypSpec program, a new version of the PHab program.27,28 Our group has successfully used this program for calculating the stability constants for copper complexes of a new thio Schiff base.29
The best fits to the spectrophotometric data show that two com-plexes for Cu2+ ion, were obtained, these being CuL (ε = 1.85×10⁴ mol L−1 cm−1) and CuL
2 (ε = 5.31×10
4 mol L−1 cm−1) whose stability constants are 5.21 and 5.01, respectively. The species obtained with the Pb2+ ion were PbL (ε = 1.88×10⁴ mol L−1 cm−1) and PbL
2 (ε = 4.96×10⁴ mol L−1 cm−1) whose stability constants are 5.69 and 5.62, respectively. The mole ratio plots and fitted curves of the respective titration spectra are depicted at λmax = 273 nm for Cu
2+ (Figure 2b), and λmax = 270 nm for Pb
2+ (Figure 2e). The corresponding distribution diagrams were obtained by the Hyss 2009 program, a new version of a software program that had previously been used in other reports30 (Figure 2c, and 2f). Figures 2c and 2f show that the predominant species are PbL, PbL2, CuL and CuL2.
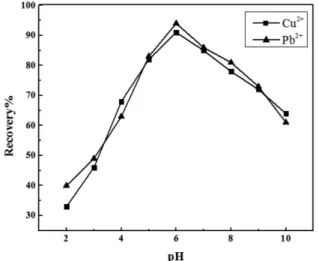
Effect of pH
The pH of the aqueous phase is one of the most important fac-tors in solid phase extraction for quantitative recovery. This can be attributed to the fact that the metal ions are present in free cation form in an acidic medium, i.e., pH ≤ 6.0, The charge density of the functional groups of the agent, loaded on the supported solid, also plays a crucial role in the metal ion sorption.
The influence of pH on the adsorption of Cu2+ and Pb2+ ions onto γ-alumina modified with BHAH was investigated over a pH range of
facilitated the dissociation of functional groups, and thus released more binding sites for the sorption of metal ions, increasing retention efficiency. However, at pH higher than 6.0, the metal ions tended to cause precipitation of M(OH)n, which resulted in heterogeneity of the fluidic flow and the contamination of the sorbent surface. Hence, a slight decline of the retention efficiency was observed at pH greater than 6.0. A sample pH value of 6.0 was consequently employed for the ensuing investigations.
Effect of ligand amount
The amount of ligand in the preconcentration studies is another main factor affecting metal ion recovery.31-36 In order to investigate the optimum amount of ligand on the quantitative extraction of these ions by the γ-alumina, the ion extraction was conducted upon varying the amount of ligand from 0 to 70 mg. The recovery of analyte ions without ligand was not quantitative. With increasing the amount of ligand up to 25 mg, an increase in recovery can be achieved. Further increase in the amount of ligand does not induce a significant change in efficiency. Quantitative recovery for the analytes was obtained using 25 mg of BHAH. Subsequent stud-ies for further experiments were carried out with 25 mg of ligand (Figure 4).
Effect of the amount of modified γ-Alumina
In order to investigate the effect of the amount of modified γ-alumina on the quantitative extraction of Cu2+ and Pb2+ ions, the extraction was conducted with varying the amounts of the modified γ-alumina from 0.1 to 1.5 mg. Quantitative recovery ( > 92%) of Cu2+ and Pb2+ ions was obtained with increasing the amount of modified γ-alumina up to 1.0 mg. Hence, 1.0 mg of the modified γ-alumina was used for further experiments, due to the greater availability of the surface area at high amounts of the sorbent, and to account for other extractable species.
Effect of amount of SDS on metal ion recovery
The influence of SDS amount on the percentage of complexed ions that were ad-solubilized was investigated by passing 250 mL of a solution containing 0.2 µg mL-1 of each metal ion through a solid phase comprising various amounts of SDS, 1.0 g γ-alumina and 25 mg BHAH at pH 6. The presence of surfactant favors the formation of hydrophobic complexes. Figure 5 shows that the recovery of metal ions increased at higher amounts of SDS, up to 50 mg, because of the formation of hydrophobic ternary ion pairs (M-ligand-SDS) that increase the retention of ternary ion pairs on the modified solid phase. The retention of metal ions on hemimicelles, which have a hydrophobic surface, was clearly dependent on the polarity of the analyte complex. The formation of minute amounts of admicelles was essential to achieve complete adsolubilization of the chelates of these ions. At surfactant amounts higher than about 50 mg, a gradual decrease in the retention percentage of ions was observed, due to the formation of micelles in the bulk aqueous solution or due to complexation of SDS with ligand to form an ion pair with metal ions. As a result, it was more difficult for the SDS-coated solid phase to desorb BHAH into aqueous solution.
Selection of eluent and optimization of eluent concentration
To select the best eluent, the effect of various acidic solutions such as sulfuric, perchloric, hydrochloric, and phosphoric acid on the preconcentration yields of the metal ions was studied under optimum conditions. Higher recovery efficiency was observed with nitric acid, which was therefore selected as the proper eluent. Experiments were carried out to select the concentration of nitric acid solution. Concentrations of HNO3 solutions between 1.0 to 6.0 mol L
−1 were Figure 3. Effect of pH on recovery of metal ions. Conditions: 250 mL 0.2 µg
mL-1 metal ions at various pH, 1.0 g g-alumina, 50 mg SDS, 25 mg BHAH, eluting solution 6 mL of 4 M HNO3
Figure 4. Effect of BHAH concentration on recovery of metal ions, Conditions: 250 mL 0.2 µg mL-1 metal ions at pH 6.0, 1.0 g g-alumina, 50 mg SDS, different concentration of BHAH, eluting solution 6 mL of 4 M HNO3
studied for this purpose. The recovery values increased upon adding nitric acid. Quantitative recovery of the analytes was observed after adding 4.0 mol L−1 HNO
3; at higher concentration it is possible that the ligand and analytes were eluted together, and this may reduce the atomization efficiency. The optimum nitric acid concentration and volume were determined to be 4 mol L−1 and 6 mL, respectively.
Effect of sample flow rate and volume
The retention of analytes on the sorbent depends on the flow rate of the solution. The influence of metal ion sorption on modified γ-alumina was investigated by varying the flow rate of the sample solution in the range of 1–6 mL min−1, and by passing the solution through the solid phase column. The recovery of the analytes de-creased when the flow rate was greater than 2.0 mL min−1. Hence, a flow rate of 2.0 mL min−1 was employed in this work.
Sample volume is an important parameter for obtaining high preconcentration. To select the optimal sample volume, the volume of sample solution, containing 0.2 µg mL-1 of Pb2+ or and Cu2+ ions, was varied from 100 to 2000 mL. The metal ions were preconcen-trated on the modified γ-alumina. The effect of sample volume on the preconcentration and extraction efficiency was tested in the range of 100-2000 mL. Quantitative recovery ( > 92%) of Pb2+ and Cu2+ ions was obtained for up to 1000 mL of sample solution. The pre-concentration factor was 100 for sample solutions, because the final elution volume was diluted to 10 mL. The dilution of the solution with increasing volume, for a constant amount of analyte, caused the recovery of sorption to decrease.
Analytical performance
The figures of merit of the proposed method were investigated un-der the optimum conditions determined as above. The dynamic linear range for Cu2+ and Pb2+ ions was calculated in the concentration range of 0.01–0.40 µg mL−1 from the equations A = 0.524C + 0.039 for Cu2+ and A = 0.393C + 0.032 for Pb2+. The detection limit (DL) is obtained from 3Sb/m, where Sb is the standard deviation of five replicate blank
measurements, and m is the slope of calibration curve. The DL of the proposed method was 7.9 µg L−1 for Cu2+ and 6.4 µg L−1 forPb2+ ions under the optimum conditions. The proposed method exhibited good reproducibility, with a relative standard deviation (RSD) of 1.67% for Cu2+ and 1.64% for Pb2+ (five replicate measurements at 0.2 µg mL−1 metalions). The theoretical preconcentration factor, calculated as the
ratio of the initial sample volume (1000 mL) to the final volume after preconcentration (10.0 mL), was 100.
According to the figures of merit of the proposed method in comparison with other reported solid phase extraction methods,26,37-39 the proposed method showed very good sensitivity and precision for determining Cu2+ and Pb2+ ions. The results are summarized in Table 1.
Effect of contaminant ions
In the determination of metal ions by atomic absorption spectro-photomety, the level of foreign ions is an important problem. In order to assess the possible analytical applications of the proposed proce-dure for preconcentration, the effect of foreign ions was examined under the optimized conditions. Trace amounts of foreign ions can interfere with the determination of analyte ions in various real medium samples. The results are shown in Table 2. The tolerable limit was defined as the highest amount of foreign ions that produced an error not exceeding 5% by a combination of solid phase column extraction and atomic absorption spectrometry. The experiments summarized in Table 2 indicated that within ±5% error range, interference from most of inorganic cations and some anions was not observed. No tests were conducted at higher concentration levels. For real samples, the content of the afore mentioned coexisting species is usually lower than the tolerated concentration levels, therefore, the present protocol can be readily exploited directly and no further sample treatments or masking reagents are needed.
Table 1. Comparative data for preconcentration of analytes ions by SPE procedure using chemically modified sorbents Metal ions Sorbent Determinaton
method
Sample volume (mL)
Preconcentration or enri-chment factor
LOD
(µg L-1) References
Cd2+,Co2+, Cu2+,
Cr3+ Pb2+, Zn2+
sodium dodecyl sulfate (SDS)-coated poly vinyl chloride (PVC) modified with (BHABDI) ligand
FAAS 200 50 1.2-3.1 37
Fe3+, Cu2+, Zn2+
(PHBI) loaded on Triton X-100-coated polyvinyl chloride
(PVC).
FAAS 450 90 0.95-1.00 38
Cu2+, Cr3+, Pb2+ Bismuthiol-II-immobilized
mag-netic nanoparticles ICP-OES 100 95, 96, 87 0.058, 0.043, 0.085 39 Cu2+, Ni2+, Co2+,
Pb2+
(DHMP) loaded on activated
carbon FAAS 1300 260 2.9, 3.5, 8.4, 3.4 26
Cu2+, Pb2+
(SDS)-coated γ-alumina modified with Bis(2-hydroxy acetophenone)-1,6-hexanediimine
(BHAH) ligand
FAAS 1000 100 7.9, 6.4 This work
Table 2. Effects of the interferences ions on the recoveries of the examined metal ions
Ion Interference/analyte ratio (w/w)
Recovery (%) Cu2+ Pb2+
Without interference ion --- 93 94
K+, Na+, Li+ 1000 95 93
SCN-, HCO 3
- 1000 95 93
Ba2+, Mg2+ 600 93 94
Co2+, Cd2+, Ni2+ 500 91 92
Hg2+ 200 94 91
Cr3+ 200 91 93
Application of method to analyze real samples
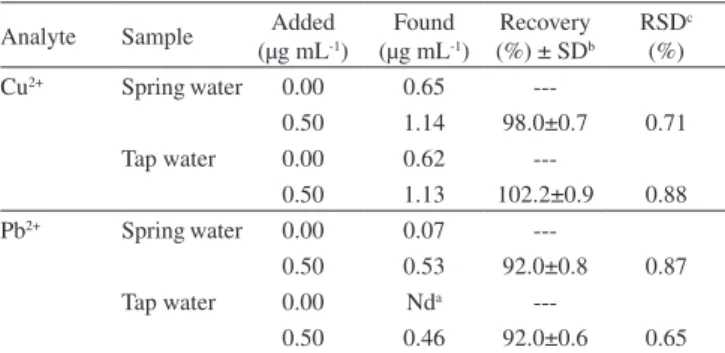
In order to assess how well the method may be applied to real samples, which often have complex matrices containing varying amounts of diverse ions, the method was applied to the separation and recovery of analytes from liver, parsley, cabbage, and water. The reliability was verified by performing spiking experiments, using the standard addition method. The percent recovery for each element in spiked real samples is given in Tables 3 and 4. The results of three analyses of each sample show that, in all cases, the ions recoveries is almost quantitative with a low relative standard deviation.
CONCLUSION
The present study describes a new solid phase extraction proce-dure for environmental samples. The method involves the preconcen-tration of Cu2+ or Pb2+ ions on SDS-coated γ-alumina modified with BHAH ligand, followed by spectrophotometric measurement of the complexation, and finally determination of analyte ions by FAAS. The procedure provides a simple, rapid, economic, selective and reproduc-ible method for the separation, preconcentration and determination of metal ions. The system successfully preconcentrated analyte ions in low amounts from large sample volumes (1000 mL). The proposed preconcentration/separation method can also be applied to determine analyte ions in real samples with complex matrices.
REFERENCES
1. Wilhelm, M.; Pesch, A.; Rostek, U.; Begerow, J.; Schmitz, N.; Idel, H.; Ranft, U.; Sci. Total Environ. 2002, 297, 109.
2. Vupputuri, S.; He, J.; Muntner, P.; Bazzano, L. A.; Whelton, P. K.;
Ba-Table 4. Analysis of analyte ions in meat and vegetable samples (N = 3) Analyte Sample Added
(µg/g)
Found (µg/g)
Recovery (%) ± SDb
RSDc
(%)
Cu2+ Liver 0.00 0.58
---6.25 6.83 100.0± 0.9 0.90
Parsley 0.00 1.00
---6.25 7.06 97.00±0.9 0.93
Cabbage 0.00 1.37
---6.25 7.56 99.0±.9 0.91
Pb2+ Liver 0.00 Nda
---6.25 6.13 98.0 ±0.7 0.71
Parsley 0.00 Nd
---6.25 6.38 102.0±0.8 0.78
Cabbage 0.00 Nd
--6.25 6.25 100.0±0.9 0.90 a) Not detected b) Standard deviation c) Relative standard deviation.
Table 3. Analysis of analyte ions in water samples (N = 3) Analyte Sample Added
(µg mL-1)
Found (µg mL-1)
Recovery (%) ± SDb
RSDc
(%) Cu2+ Spring water 0.00 0.65
---0.50 1.14 98.0±0.7 0.71 Tap water 0.00 0.62
---0.50 1.13 102.2±0.9 0.88 Pb2+ Spring water 0.00 0.07
---0.50 0.53 92.0±0.8 0.87 Tap water 0.00 Nda
---0.50 0.46 92.0±0.6 0.65 a)Not detected. b) Standard deviation. c) Relative standard deviation.
tuman, V.; Hypertension 2003, 41, 463.
3. Tabrizi, H. B.; J. Hazard. Mater. 2007,B139, 260.
4. Tang, A. N.; Jiang, D. Q.; Yan, X. P.; Anal. Chim. Acta 2004, 507, 203. 5. Atanassova, D.; Stefanova, V.; Russeva, E.; Talanta 1998, 47, 1237. 6. EI-Hussaini, O. M.; Rice, N. M.; Hydrometallurgy 2004, 72, 259. 7. Meng, F. Y.; Wei, Y. Q.; Lu, H.; Liu, X. X.; Liu, J. X.; Chin. Chem. Lett.
2012, 23, 591.
8. Bezerra, M. A.; dos Santos, W. N. L.; Lemos, V. A.; Korn, M. G. A.; Ferreira, S. L. C.; J. Hazard. Mater. 2007, 148, 334.
9. Adhikari, B. B.; Gurung, M.; Kawakita, H.; Ohto, K.; Chem. Eng. Sci.
2012, 78, 144.
10. Gentscheva, G.; Tzvetkova, P.; Vassileva, P.; Lakov, L.; Peshev, O.; Ivanova, E.; Microchim. Acta 2006,156, 303.
11. Akhond, M.; Absalan, G.; Sheikhian, L.; Eskandari, M. M.; Sharghi, H.; Sep. Purif. Technol. 2006, 52, 53.
12. Zhang, L.; Chang, X.; Li, Zh.; He, Q.; J. Mol. Struct. 2010, 964, 58. 13. Zhao, Y.; Liu, Ch.; Feng, M.; Chen, Zh.; Li, Sh.; Tian, G.; Wang, L.;
Huang, J.; Li, Sh.; J. Hazard. Mater. 2010, 176, 119.
14. Mohammadi, S. Z.; Hamidian, H.; Karimzadeh, L.; Moeinadini, Z.; Arabian J. Chem. 2012, In press.
15. Ghaedi, M.; Fathi, M. R.; Shokrollahi, A.; Shajarat, F.; Anal. Lett. 2006, 39, 1171.
16. Rao, T. P.; Daniel, S.; Gladis, J. M.; TrAC, Trends Anal. Chem. 2004,23, 28.
17. Duran, C.; Senturk, H. B.; Gundogdu, A.; Bulut, V. N.; Elci, L.; Soylak, M.; Tufekci, M.; Uygur, Y.; Chin. J. Chem. 2007, 25, 196.
18. Ghaedi, M.; Shabani, R.; Montazerozohori, M.; Shokrollahi, A.; Sahraie-an, A.; HossainiSahraie-an, H.; Soylak, M.; Environ. Monit. Assess. 2011, 174, 86. 19. Shokrollahi, A.; Ghaedi, M.; Shabani, R.; Montazerozohori, M.;
Cheh-reh, F.; Soylak, M.; Alipour, S.; Food Chem. Toxicol. 2010, 48, 482. 20. Ghaedi, M.; Tavallali, H.; Shokrollahi, A.; Zahedi, M.; Montazerozohori,
M.; Soylak, M.; J. Hazard. Mater. 2009,166, 1441.
21. Yin, J.; Jiang, Z. C.; Chang, G.; Hu, B.; Anal. Chim. Acta 2005,540, 333.
22. Chen, M. L.; Tian, Y.; Wang, J. H.; J. Anal. At. Spectrom. 2008,23, 876. 23. Faraji, M.; Yamini, Y.; Shariati, S.; J. Hazard. Mater. 2009,166, 1383. 24. Kolthoff, I. M.; J. Am. Chem. Soc. 1957,79, 1.
25. Horwitz W.; Official methods of analysis of AOAC International, Gaithersburg, MD‚ 2002.
26. Ghaedi, M.; Ahmadi, F.; Shokrollahi, A.; J. Hazard. Mater. 2007,142, 272.
27. Gans, P.; Sabatini, A.; Vacca, A.; Talanta 1996,43, 1739. 28. Gans, P.; Sabatini, A.; Vacca, A.; Ann. Chim. 1999, 89, 45.
29. Shokrollahi, A.; Abbaspour, A.; Ghaedi, M.; Naghashian Haghighi, A.; Kianfar, A. H.; Ranjbar, M.; Talanta 2011, 84, 34.
30. Alderighi, L.; Gans, P.; Ienco, A.; Peters, D.; Sabatini, A.; Vacca, A.; Coord. Chem. Rev. 1999, 184, 311.
31. Soylak, M.; Tuzen, M.; J. Hazard. Mater. 2006,138, 195.
32. Soylak, M.; Karatepe A. U.; Elci, L.; Dogan, M.; Turk. J. Chem. 2003, 27, 235.
33. Shahtaheri, S. J.; Khadem, M.; Golbabaei, F.; Rahimi-Froushan, A.; Ganjali, M. R.; Norozi, P.; Iran. J. Public Health 2007,36, 73. 34. Mahmoud, M. E.; Osman, M. M.; Amer, M. E.; Anal. Chim. Acta 2000,
15, 433.
35. Suvardhan, K.; Kumar, K. S.; Rekha, D.; Kiran, K.; Raj B. J.; Chiranjeevi, P.; J. Anal. Chem. 2007, 62, 336.
36. Suleiman, J. S.; Hu, B.; Pu, X.; Huang, C.; Jiang, Z.; Microchim. Acta
2007,159, 379.
37. Marahel, F.; Ghaedi, M.; Shokrollahi, A.; Montazerozohori, M.; Davoodi, Sh.; Chemosphere 2009,74, 583.
38. Ghaedi, M.; Niknam, Kh.; Shokrollahi, A.; Niknam, E.; Ghaedi, H.; Soylak, M.; J. Hazard. Mater. 2008, 158, 131.