Article
J. Braz. Chem. Soc., Vol. 26, No. 2, 325-330, 2015. Printed in Brazil - ©2015 Sociedade Brasileira de Química 0103 - 5053 $6.00+0.00
A
*e-mail: [email protected]
An Uncommon Naphthaquinoid and a New Lignan Derivative from the Roots of
Cordia leucocephala
Moric
Jaécio C. Diniz,a Francisco A. Viana,a Maria da Conceição M. Torres,b Raimundo
Braz-Filho,c Edilberto R. Silveirab and Otília D. L. Pessoa*,b
aDepartamento de Química, Universidade do Estado do Rio Grande do Norte,
59610-210 Mossoró-RN, Brazil
bDepartamento de Química Orgânica e Inorgânica, Universidade Federal do Ceará,
60021-970 Fortaleza-CE, Brazil
cSetor de Química de Produtos Naturais, Universidade Estadual do Norte Fluminense,
28013-600 Campos dos Goytacazes-RJ, Brazil
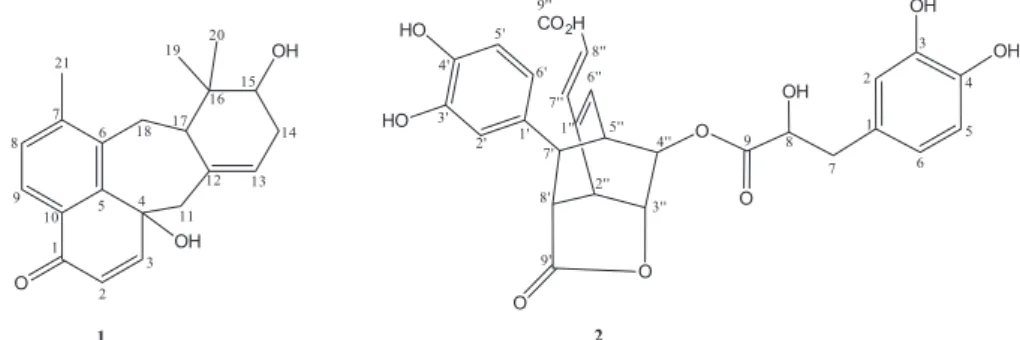
Two uncommon compounds, a meroterpene naphthoquinoid (cordiaquinone P) and a new lignan derivative, were isolated from the hexane extract of roots of Cordia leucocephala Moric
and their structures, including the relative stereochemistry, were determined by nuclear magnetic resonance (NMR) (1H and 13C NMR, HSQC, HMBC and NOESY) and high resolution electrospray
ionization mass spectrometry (HRESIMS) techniques.
Keywords:Cordia leucocephala, Boraginaceae, naphthoquinone
Introduction
Cordia comprises one of the major and most important genus of the Boraginaceae family. For this genus are recognized ca. 300 species, many of which are used in traditional medicine.1 It is known as a prolific source of
terpenoids, phenolic compounds and saponins,2-6 however,
it is famous for its ability to biosynthesize meroterpenoid benzoquinone and naphthoquinones, including their reduced forms.7,8 These type of compounds, many of
which are named as cordiaquinones or cordiachromes, an allusion to the genus, seems to be of chemotaxonomic significance.8-11 Interestingly, the occurrence of such
secondary metabolites seems to be restrict to the roots. Previous work with the roots of C. polycephala resulted in the isolation of the new cordiaquinones P and Q, besides the known cordiaquinone J, whose cytotoxic properties were evaluated.12 Our efforts to find anticancer compounds
led us to continue the chemical investigation of the EtOH extract from roots of C. polycephala. In the present work, it is described the isolation and characterization of two further new compounds, a naphthoquinoid and a lignan derivative (Figure 1).
Results and Discussion
The new compounds 1 and 2 were isolated from the
root EtOH extract of C.leucocephala and their structures were unequivocally elucidated by spectrometric methods, including 1D and 2D nuclear magnetic resonance (NMR) experiments and high resolution electrospray ionization mass spectrometry (HRESIMS).
Compound 1, a yellow resin, possesses molecular
formula C21H24O3 (ten degrees of unsaturation), which was determined by HRESIMS through the sodium adduct ion at m/z 347.1633 [M + Na]+ (calcd. 347.1623). The infrared
(IR) spectrum exhibited absorption bands for chelated and nonchelated hydroxyl (3512 and 3346 cm−1), C–H stretching
of sp2 and sp3 carbon (3065-2886 cm−1), conjugated carbonyl
(1661 cm−1), carbon-carbon double bond (1634 cm−1), skeletal
bands of benzene ring (1588 and 1470 cm−1), C–O stretching
(1087 and 1039 cm−1) and the =C–H out-of-plane bending
(816 cm−1). The 1H NMR spectrum (CDCl
3) displayed signals
for methyl groups attached to a quaternary carbon at d 1.09 (3H-19) and 1.08 (3H-20), and a singlet for a methyl attached to a benzene ring at d2.46 (3H-21).Additionally, a set of signals inthe range of d3.45-1.75 indicated protons attached tononfunctionalized sp3 carbons.The 1H-1H COSY contour
map showed cross-peaks evidencing the presence of two isolated spin systems through the signals at d 5.53 (H-13) with
d 2.34 and 2.20 (2H-14), and the laters with d 3.51 (H-15) for AMM’X, as well as for an AXX’ at d 1.75 (H-17) with d 3.45 and 3.15 (2H-18).
The 13C NMR spectrum revealed 21 carbon signals
(Table 1), to which, based on the DEPT and HSQC experiments, were assigned an oximethine (d 74.2), a methine (d 49.4), five monohydrogenated sp2 carbons
(d154.4, 130.1, 126.4, 124.9 and 124.4), three methylenes (d 49.2, 32.2 and 29.7), three methyls (26.1, 22.0 and 18.6), and eight nonhydrogenated carbons, five of which sp2
(d 144.2, 142.4, 140.6, 137.4 and 128.2), one oxygenated (d 69.7), one saturated (d 38.2), and one carbonyl group (d185.0). A 4-hydroxy-7-methyl-naphthoquinone moiety (seven degrees of unsaturation) was supported by 1H and 13C NMR data and was confirmed by the HMBC contour
map through the correlations of H-9 (d 7.87) with C-1 (d 185,0) and C-7 (d 142.4); H-8 (d 7.23) with C-6 (d 140.6) and C-21 (d 22.0); H-2 (d 6.29) with C-10 (d 128.2) and C-4 (d 69.8), as well as the Me-21(d 2.46) with the carbons 6-8 (d140.6, 142.4 and 130.1, respectively). The three remaining unsaturation degrees were attributed to an extra carbon-carbon double bond and two cycles, which are part of a monoterpene (C10) chain positioned at C-4
and C-6, through the HMBC correlations of the metylene protons 2H-11(d 2.69 and 2.38) with C-3 (d154.4) and C-4 (d 69.8), as well as the metylene protons 2H-18 (d3.45 and 3.15) with C-5 (d144.2), C-6 (d140.6) and C-7 (d 142.4). Finally, the correct localization of the geminal methyls at C-16 (d 38.2), the hydroxyl group at C-15 (d 74.2) and the double bond between C-12 (d 137.4) and C-13 (d 124.4), were also confirmed by the HMBC contour map as depicted in Figure 2. The relative configuration of the stereocenters of 1, was determined by NOESY analysis (Figure 3). The
hydroxyl group at C-15 was α-positioned, particularly due to the dipolar interactions of the methine proton at d1.75 (d, J 11.6 Hz, H-17) with the proton signals at d3.51 (t, J 5.3 Hz, H-15) and the methyl signal at d 1.09 (s, 3H-19). Both H-15 and 3H-19 also showed dipolar coupling, confirming the relative stereochemistry. The dipolar coupling of H-3 (d6.8 d, J 10.0 Hz) with the Hβ-11 (d(2.69 d, J 14.3 Hz), and of the later with H-13 (d5.53 br s) suggested that the hydroxyl at C-4 is also α. Thus, the structure of 1 was established as
the terpene 4α,15α-dihydroxy-naphthoquinone derivative named as cordiaquinone P.
Compound 2, was isolated as a brown resin, its HRESIMS
exhibited a deprotonated molecule at m/z 523.126 [M − H]−, indicating as the C27H24O11 molecular formula,which
requires 16 degrees of unsaturation. The 1H NMR spectrum
(500 MHz, CD3OD) showed signals for two AMX systems:
d 6.74 (d, J 1.0 Hz, H-2), 6.69 (d, J 8.0 Hz, H-5) and 6.61 (br d, J 8.0 Hz, H-6), and d 6.64 (d, J 8.1 Hz, H-5’), 6.42 (d, J 1.6 Hz, H-2’) and 6.33 (d, J 8.1 Hz, H-6’), indicating two trisubstituted aromatic rings. Olefinic protons signals atd 7.42 (d, J 15.9 Hz, H-7”), 6.52 (d, J 6.4 Hz, H-6”) and 6.26 (d, J 15.9 Hz, H-8”) for a α,β,γ,d-conjugated system, and signals for three oxymethine protons at d 5.20 (dd, J 8.0 and 3.7 Hz, H-8), 4.24 (d, J 4.8 Hz, H-3”) and 3.99 (d, J 3.2 Hz, H-4”), were also observed. In addition, the
1H NMR spectrum exhibited signals for diastereotopic
methylene protons at d 3.11 (dd, J 14.3, 8.0 Hz, H-7a) and 3.00 (dd, J 14.3, 3.7 Hz, H-7b), besides signals for three methine protons at d 4.1 (br s, H-2”), 3.31 (br s, H-5”) and 2.67 (br s, H-8’) (Table 1).
The combination of 13C NMR, DEPT and HSQC spectra
were consistent with the presence of one methylene, sixteen methines and ten nonhydrogenated carbons (Table 1). A detailed NMR data analysis allowed to identify two aromatic rings, three carboxyl carbons [d 181.0 (C-9), 173.7 (C-9’) and 168.2 (C-9”)], two double bonds [d 144.3 (C-7’’), 141.9 (C-6”), 135.3 (C-1’’) and 117.4 (C-8’’)], and three oxymethine carbons [d 84.2 (C-3”) and 75.1 (C-4” and C-8)]. Based on the carbon hydrogenation pattern, chemical shift values and HMBC correlations, two caffeic acid moieties
O OH OH OH O HO HO O O CO2H
OH OH O 1 3 4'' 5 3'' 7 8' 9 1' 3' 5' 2'' 9' 7' 6'' 1 2 1 3 5 7 9 11 13 15 17 19 20 21 2 4 6 8 5'' 4' 2' 6' 7'' 1'' 9'' 8'' 2 4 6 8 10 12 14 16 18
were easily identified, as well as an α, β, γ, δ-conjugated carboxylic acid system, Table 1 and Figure 2. Comparison of the NMR data of 2 with those reported for the bicyclic
[2.2.2] octane lignin (rufescenolide), an adduct of two caffeic acid molecules, previously isolated of C. rufescens,13 revealed a close similarity among them, differing only by the substitution of the hydroxyl proton at C-4” of the bicyclic [2.2.2] octane lignan for another caffeic acid moiety, as well as by the presence of a carboxylic acid function instead the methyl ester. The COSY and HMBC contour map supported the structure of the new lignan derivative after the esterification with 2-hydroxy-dihydrocaffeic acid (Figure 2). The relative stereochemistry suggested for 2
was established by the NOESY analysis (Figure 3), which showed correlations between Hα-7’ (d 3.14) and Hα-4’’ (d
3.99, d, J 3.2 Hz) allowing to set the aromatic ring at C-7’ and the 2-hydroxy-dihydrocaffeic acid moiety at C-4’’, both β-positioned. This proposition also was supported by the NOE correlations observed for Hβ-8’ (d 2.67) with H-2’ (d
6.42, d, J 1.6 Hz) and H-6’ (d 6.33, dd, J 8.1, 1.6 Hz). A speculative biogenetic route for the formation of 2,
involving three caffeic acid units and common enzymatic reactions, such as reduction, oxidation, hydrogenation and cyclization, is suggested (Figure 4).
Conclusions
From C. leucocephala were isolated two new compounds, a meroterpene naphthoquinoid which was
designated as cordiaquinone P, and a lignan trimmer- like of caffeic acid, the acid form of rufescenolide esterified with a 2-hydroxy-dihydrocaffeic acid moiety at C-4’’. Based on the current results, rufescenolide, previously isolated from C. rufescens, could be speculated as being an artifact, since the solvent used during the extraction process was methanol.13 The cytotoxicity of both
compounds 1 and 2 have being assayed against a panel
of tumor cells, unfortunately, neither one showed any cytotoxic activity.
Experimental
General methods
The optical rotations were measured on a Perkin-Elmer 341 digital polarimeter. The HRESIMS were acquired using a LCMS-IT-TOF (SHIMADZU) spectrometer. IR spectra (KBr pellets) were recorded using a Perkin-Elmer FT-IR 1000 spectrometer. All NMR experiments were recorded on a Bruker DRX-500 spectrometer operating at 500 and 125 MHz for 1H and 13C, respectively. The high performance
liquid chromatography (HPLC) analysis was carried out using a Class LC-10 (SHIMADZU) system equipped with a SPD-M10Avp diode array UV-Vis detector, two LC10ATvp pumps and LC-Si column (250 mm × 10 mm i.d. × 5 µm) from Supelco. Chromatography columns were carried out on silica gel 60 (Merck) and Sephadex LH-20 (Pharmacia), while thin layer chromatography (TLC) was performed on
O OH OH OH O HO HO O O CO2H
OH OH O 1 3 4'' 5 3'' 7 8' 9 1' 3' 5' 2'' 9' 7' 6'' 1 2 HMBC COSY 1 3 5 7 9 11 13 15 17 19 20 21
Figure 2. 1H-1H COSY (bold) and HMBC (arrows) key correlations observed for compounds 1 and 2.
H H H O O HO HO H H CO2H
H O OH OH OH O H H H H H H H H OH H OH O 21 18 17 19 15 13 11 3 1 5 7 9 4'' 3'' 2'' 8' 7' 2' 6' 8'' 1 2
precoated silica gel polyester sheets (kieselgel 60 F254, 0.20 mm, Merck). The fractions and pure compounds were monitored by spraying with vanillin/perchloric acid/EtOH solution followed by heating at 105 °C.
Plant material
C.leucocephala, collected in May 2006, was harvested at Mossoró County, Rio Grande do Norte State, Brazil, and identified by the botanist Odaci Fernandes de Oliveira. A voucher specimen (MOSS 8827) has been deposited at the Herbarium Dárdano de Andrade Lima of the Universidade Federal Rural do Semi-Árido (UFERSA), Rio Grande do Norte, Brazil.
Extraction and isolation
Dried and powdered rootsof C. leucocephala (650.0 g) were extracted, at room temperature, with hexane followed by a 70% aqueous ethanol solution to yield 9.3 and 57.0 g, respectively, of crude extracts. The crude hydroalcoholic extract was dissolved in H2O (700 mL) and partitioned
with CHCl3, EtOAc and n-BuOH (3 × 200 mL, each), to yield, after the solvent evaporation, 28.5, 2.71 and 7.26 g, respectively. The CHCl3 fraction (28.5 g) was subjected to chromatography column (CC) over silica gel, by elution with binary mixtures of CHCl3/MeOH of increasing degree of polarities to yield 57 fractions (20 mL each), which after TLC analysis were pooled together to six fractions (F1A to F6A). The F3A (170.2 mg) was subjected to a Sephadex LH-20 column, using MeOH as eluent, to give 19 subfractions of 8 mL, that after TLC analysis were grouped to 5 subfractions (F1B to F5B). The F3B (80.0 mg), was purified by semipreparative HPLC analysis using H2O (0.1%
TFA)/ACN (42:58; v/v) at a flow rate of 1.9 mL min−1 to yield
compound 1 (67.0 mg, tR = 16.2 min). The EtOAc fraction (2.71 g) was fractionated by silica gel CC, using as eluent a ternary mixture of AcOEt/MeOH/H2O (70:22:08 v/v), to give
29 fractions (8 mL). TLC analysis showed a major spot for fractions 11-14 (687.3 mg) that were pooled together.The final fraction was subjected to a Sephadex LH-20 column, followed by semipreparative HPLC using H2O (0.1% formic
acid)/ACN (75:25; v/v) at flow rate of 2.9 mL min−1 to yield
compound 2 (70.2 mg, tR = 22.1 min).
HO
OH
O O O
O OH
OH OH RO2C
OH OH
OH HO
O
OH
O OH HO
O
H O
O OH HO
O
H HO
OH
O O OH O
RO2C
HO
OH
OH OH OH O
RO2C
OH HO
HO
O
OH OH HO
O
OH OH R
O
[4+2] [H]
[H]
[O]
-H2O
H
-H2O
2
Compound 1: yellow resin; [α]25
D−70.0 (c 0.45, CHCl3);
for 1H-(500 MHz, CDCl
3) and 13C NMR (125 MHz, CDCl3)
data, see Table 1; positive HRESIMS: m/z 347.1633 [M + Na]+ (calcd. 347.1623 for C
21H24NaO3).
Compound 2: brown resin; [α]25
D +310.4 (c 0.45,
MeOH); for 1H (500 MHz, MeOD) and 13C NMR
(125 MHz, MeOD) data, see Table 1; negative HRESIMS: m/z 523.1264 [M - H]- (calcd. 523.1240 for C
27H23O11).
Supplementary Information
Supplementary information (Figures S1-S16) is available free of charge at http://jbcs.sbq.org.br as a PDF file.
Acknowledgments
The authors thank the Governmental Brazilian Agencies CNPq, FUNCAP, CAPES, PRONEX and INCT-SisBio for financial support.
References
1. Al-Musayeib, N.; Perveen, S.; Fatima, I.; Nasir, M.; Hussain, A.; Molecules 2011, 16, 10214.
2. Menezes, J. E. S. A.; Machado, F. E. A.; Lemos, T. L. G.; Silveira, E. R.; Braz-Filho, R.; Pessoa, O. D. L.; Z. Naturforsch., C: J. Biosci. 2004, 59, 19.
3. Siddiqui, B. S.; Perwaiz, S.; Begum, S.; Tetrahedron 2006, 62,
10087.
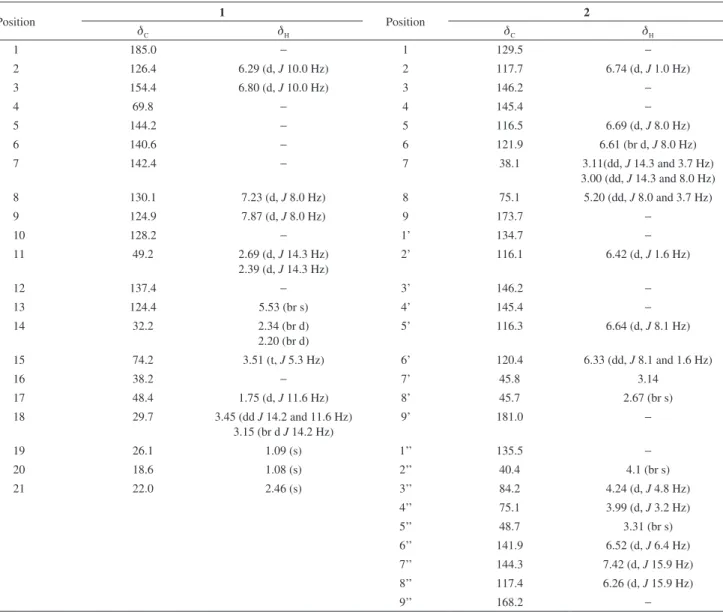
Table 1.1H and 13C NMR data for compounds 1 (CDCl
3) and 2 (MeOD)a
Position 1 Position 2
dC dH dC dH
1 185.0 − 1 129.5 −
2 126.4 6.29 (d, J 10.0 Hz) 2 117.7 6.74 (d, J 1.0 Hz)
3 154.4 6.80 (d, J 10.0 Hz) 3 146.2 −
4 69.8 − 4 145.4 −
5 144.2 − 5 116.5 6.69 (d, J 8.0 Hz)
6 140.6 − 6 121.9 6.61 (br d, J 8.0 Hz)
7 142.4 − 7 38.1 3.11(dd, J 14.3 and 3.7 Hz)
3.00 (dd, J 14.3 and 8.0 Hz)
8 130.1 7.23 (d, J 8.0 Hz) 8 75.1 5.20 (dd, J 8.0 and 3.7 Hz)
9 124.9 7.87 (d, J 8.0 Hz) 9 173.7 −
10 128.2 − 1’ 134.7 −
11 49.2 2.69 (d, J 14.3 Hz)
2.39 (d, J 14.3 Hz)
2’ 116.1 6.42 (d, J 1.6 Hz)
12 137.4 − 3’ 146.2 −
13 124.4 5.53 (br s) 4’ 145.4 −
14 32.2 2.34 (br d)
2.20 (br d)
5’ 116.3 6.64 (d, J 8.1 Hz)
15 74.2 3.51 (t, J 5.3 Hz) 6’ 120.4 6.33 (dd, J 8.1 and 1.6 Hz)
16 38.2 − 7’ 45.8 3.14
17 48.4 1.75 (d, J 11.6 Hz) 8’ 45.7 2.67 (br s)
18 29.7 3.45 (dd J 14.2 and 11.6 Hz) 3.15 (br d J 14.2 Hz)
9’ 181.0 −
19 26.1 1.09 (s) 1’’ 135.5 −
20 18.6 1.08 (s) 2’’ 40.4 4.1 (br s)
21 22.0 2.46 (s) 3’’ 84.2 4.24 (d, J 4.8 Hz)
4’’ 75.1 3.99 (d, J 3.2 Hz)
5’’ 48.7 3.31 (br s)
6’’ 141.9 6.52 (d, J 6.4 Hz)
7’’ 144.3 7.42 (d, J 15.9 Hz)
8’’ 117.4 6.26 (d, J 15.9 Hz)
9’’ 168.2 −
a1H (500 MHz) and 13C (125 MHz). din ppm and J in Hz. Assignments were based on HSQC, COSY, HMBC and NOESY experiments. Overlapped
4. Kuroyanagi, M.; Kawahara, N.; Sekita, S.; Satake, M.; Hayashi, T.; Takase, Y.; Masuda, K.; J. Nat. Prod. 2003, 66, 1307.
5. Silva, S. A. S.; Rodrigues, M. S. L.; Agra, M. F.; da-Cunha, E. V. L.; Barbosa-Filho, J. M.; Silva, M. S.; Biochem. Syst. Ecol.
2004, 32, 359.
6. Santos, R. P.; Silveira, E. R.; Uchôa, D. E. A.; Pessoa, O. D. L.; Viana, F. A.; Braz-Filho, R.; Magn. Reson. Chem. 2007, 45, 692.
7. Parks, J.; Gyeltshen, T.; Prachyawarakorn, V.; Mahidol, C.; Ruchirawat, S.; Kittakoop, P.; J. Nat. Prod. 2010, 73, 992.
8. Ioset, J. R.; Marston, A.; Gupta, M. P.; Hostettmann, K.;
Phytochemistry 2000, 53, 613.
9. Menezes, J. E. S. A.; Lemos, T. L. G.; Pessoa, O. D. L.; Braz-Filho, R.; Montenegro, R.; Wilke, D. V.; Costa-Lotufo, L. V.; Pessoa, C.; Moraes, M. O.; Silveira, E. R.; Planta Med. 2005,
71, 54.
10. Santos, R. P.; Silveira, E. R.; Uchôa, D. E. A.; Pessoa, O. D. L.; Viana, F. A.; Braz-Filho, R.; Magn. Reson. Chem. 2007, 45,
692.
11. Ioset, J. R.; Marston, A.; Gupta, M. P.; Hostettmann, K.;
Phytochemistry 1998, 47, 729.
12. Diniz, J. C.; Viana, F. A.; Oliveira, O. F.; Maciel, M. A. M.; Torres, M. C. M.; Braz-Filho, R.; Silveira, E. R.; Pessoa, O. D. L.; Magn. Reson. Chem. 2009, 47, 190.
13. Vale, A. E.; David, J. M.; Santos, E. O.; David, J. P.; Silva, L. C. R. C.; Bahia, M. V.; Brandão, H. N.; Phytochemistry2012,
76, 158.
Submitted on: July 8, 2014