Article
J. Braz. Chem. Soc., Vol. 26, No. 2, 282-289, 2015. Printed in Brazil - ©2015 Sociedade Brasileira de Química 0103 - 5053 $6.00+0.00
A
*e-mail: [email protected]
Subcritical Extraction of
Salvia hispanica
L. Oil with
N
-Propane: Composition,
Purity and Oxidation Stability as Compared to the Oils Obtained by Conventional
Solvent Extraction Methods
Ana B. Zanqui,*,a Damila R. de Morais,c Cláudia M. da Silva,a Jandyson M. Santos,c
Lucas U. R. Chiavelli,a Paulo R. S. Bittencourt,d Marcos N. Eberlin,c
Jesui V. Visentainer,a Lúcio Cardozo-Filhob and Makoto Matsushitaa
aDepartment of Chemistry and bDepartment of Chemistry Engineering, State University of Maringá, UEM, 87020-900 Maringá-PR, Brazil
cThoMSon Mass Spectrometry Laboratory, Institute of Chemistry, University of Campinas, Unicamp, 13083-970 Campinas-SP, Brazil
dDepartment of Chemistry, Federal Technological University of Paraná, UTFPR, 85884-000 Medianeira-PR, Brazil
This study evaluated the Chia (Salvia hispanica L.) oil composition in terms of fatty acids (FA), sterols, acylglycerols and oxidative stability obtained via subcritical n-propane fluid extraction (SubFE-propane), in different temperatures and pressure conditions, as compared to Bligh & Dyer (BD), Soxhlet (SE) and Folch (FLS) extractions. Total lipid varied from 23.25 to 30.21% and the best yield was obtained by both SubFE-propane extraction at 45 °C and 12 MPa (A). α-Linolenic acid (18:3n-3) was the most abundant FA and SubFE-propane extraction provided the best results for the sum of n-3 and PUFA. All oil samples were similar in regard to triacylglycerols (TAG) profiles as measured via direct electrospray ionization mass spectrometry (ESI-MS) analysis. The total amounts of stigmasterol, β-tocopherol and tocopherol total were highest in the Chia oil obtained by BD, campesterol and sitosterol by SE and γ-tocopherol by SubFE-propane extraction. The SubFE-propane oil also presented the best (2 to 5 times) oxidation stability. SubFE-propane was the most efficient extraction method for Chia oil, providing the highest extraction yields, purity, oxidation stability and diverse profile of sterols.
Keywords: lipids extraction, fatty acids, subcritical extraction, principal components analysis, phytosterols
Introduction
Chia, Salvia hispanica L. is an oilseed crop with potential use as human food.1,2 This seed is composed
of 30% of oil3,4 rich in α-linolenic acid (50 to 60%)2-5
and is gluten-free, thereby handling it appropriate to be consumed by celiac.5 As for other oilseeds, chia
also presents several bioactive components, such as phytosterols and tocopherols,6,7 and free phytosterols serve
to stabilize phospholipid bilayers in plant cell membranes just as cholesterol does in animal cell membranes. Most phytosterols contain 28 or 29 carbons and one or two carbon-carbon double bonds, typically one in the sterol nucleus and sometimes a second double bond in the alkyl
side chain. Phytostanols are a fully-saturated subgroup of phytosterols which act on cellular functions, preventing inflammation8 and acting in several other diseases.6,9,10
The α-linolenic acid (18:3n-3) is known to act on the prevention of cardiovascular diseases, decreasing the risk of heart and other chronic diseases such as type 2 diabetes and cancer, and protecting against Alzheimer’s disease.10-12 The conventional methods of oil extraction
used in food industry can eventually remove or degrade components such as α-linolenic acid, phytosterols and tocopherols. Supercritical fluid extraction (SFE) is an alternative method for lipid extraction,13-16 presenting
Carbon dioxide (CO2) is the solvent most commonly used
for SFE, due to beneficial properties such as low temperature (31 °C) and critical pressure (7.29 MPa).19-22 Many authors
have applied the subcritical fluid extraction SFE method for oilseeds, using CO2 and n-propane as solvent, because it can
preserve oil quality characteristics and extract free lipids from toxic residues.19–23 However, n-propane (critical temperature
of 97 °C and critical pressure of 4.19 MPa) seems to be a better alternative than CO2 for SFE oil extraction, due to this
solvent highest solubility in lipids.
This work evaluated Salvia hispanica L. oils extracted by subcritical n-propane fluid (SubFE-propane), under different pressure and temperature conditions, and compared to different conventional lipid extraction methods. The composition of the oil obtained by subcritical n-propane fluid extraction (SubFE-propane) was evaluated via gas chromatography with flame ionization detector (GC-FID), gas chromatography coupled to mass spectrometry (GC-MS) and electrospray ionization mass spectrometry (ESI-MS).
Experimental
Samples
Four packs of 500 g of 4 different lots of Chia (Salvia hispanica L.) samples were provided by Dubai Trade and Industry Food Production, Catuípe-RS, Brazil. The grains were crushed, homogenized and stored in vacuum packaging at room temperature, and protected from light.
Total lipids (TL)
Total lipids (TL) was extracted according to Folch et al.24
(FLS), Bligh et al.25 (BD), and AOAC Official Method
991.36 - Soxhlet26 (SE) and were expressed in dry basis
percentage (% DB−1).
Subcritical n-propane extraction method
For lipid extraction with pressurized n-propane, 30.0 g of dried sample was filled into the extractor, on a laboratory scale for lipid extraction with subcritical
n-propane, that was pressurized via a pump-type syringe
with a temperature-controlled thermostatic bath at 10 °C, as described by de Souza et al.27
Different temperature and pressure conditions were used as the two main factors for the 2² factorial design (Table 1), with three replications of the central point. The answer was the final oil quantity (extraction yield).
The extraction was carried out with 1 cm³ min−1 of
propane flow, controlled by an expansion valve (Autoclave Engineers) maintained at 80 °C using a thermoregulator (Tholz, model CTM-04E). Lipids were collected in weighed glass vials and lipid content was determined gravimetrically in 5 periods of 5 to 60 min on an analytical balance (Marte, model AM 220) and were expressed in dry basis percentage (% DB−1).
Fatty acid quantification
Fatty acid methyl esters (FAME) were prepared by the methylation of TL28 and analyses were performed
in triplicate. Methyl esters were separated by gas chromatography (Trace Ultra 3300 model - Thermo Scientific) equipped with a flame ionization detector and a cyanopropyl capillary column (100 m × 0.25 i.d., 0.25 µm film thickness, CP7420 Varian, EUA). The injector and detector temperatures were 240 °C. The gas flow rates used were 1.2 cm³ min−1 carrier gas (H
2), 30 cm³ min −1
make-up gas (N2), 35 and 300 cm³ min−1 flame gases (H2 and
synthetic air, respectively). The sample splitting rate was 1:80 and the samples (2 µL) were injected in duplicate. The main operational parameters were as follows: the column temperature was held at 185 °C for 7.5 min, programmed to increase at 4 °C min−1 to 235 °C and maintained at this
temperature for 1.5 min; the total run time was 25 min. The peak areas were determined by the ChromQuest 5.0 software. For fatty acid identification, retention times were compared with those of standard methyl esters.
Quantification (in mg FA g−1 of TL) was performed
against tricosanoic acid methyl ester as an internal standard (23:0).29 Theoretical FID correction factor values30 were
used to obtain concentration values. FA content was calculated in mg g−1 of total lipids using equation 1:
Ax⋅MIS⋅CFX FA
AIS⋅WX⋅CFAE
= (1)
Table 1. Factors and levels for the 2² factorial design
Factors Symbol Unit Type Levels
−1 0 +1
Temperature T ºC Numeric 30 45 60
where FA is expressed as mg g−1 total lipids, A
X is the peak
area, AIS is the peak area of the internal standard (IS) methyl
ester of tricosanoic acid (23:0), WIS is the IS weight (mg)
added to the sample (mg), WX is the sample weight (mg),
CFX is the theoretical correction factor, and CFAE is the
conversion factor necessary to express results as mg of FA rather than as methyl esters. The results were converted from FA mg g−1 of oil.
Phytosterols and tocopherols quantification
Phytosterols and tocopherols were simultaneously evaluated by gas chromatography coupled to mass
spectrometry.31 The extracted oils were previously
derivatized32 and the analysis was performed in a gas
chromatograph (Thermo–Finnigan, model Thermo Focus GC) equipped with a capillary column DB-5 (5% phenyl, 95% methylpolysiloxane) fused silica, 30 m, 0.25 mm i.d. and 0.25 mm thick film stationary phase (J & W Scientific) coupled to a mass spectrometer (Thermo–Finnigan, model DSQ II) equipped with an electron ionization source (EI). The system of data acquisition was performed by Xcalibur software accompanying database of spectra contained in the NIST MS Search spectral library version 2.0. Flow rate of gas was 1.0 cm³ min−1 for the carrier gas (He - 5.0).
The injections were performed in triplicate; the injection volume was 2 µL and the sample splitting rate was 1:10. The temperature of the injector and detector was 280 °C.
The initial temperature of the column was 200 °C for 8 min, programmed to increase to 235 by 3 °C min −1, and
then to 280 by 15 °C min−1; the column remained at this
temperature for 15 min. The temperature of the transfer line between GC and MS was 250 °C.
Quantitation were carried out in relation to the internal standard 5 α-cholestane (Sigma, Brazil), according to Li et al.33
ESI(+)-MS analysis
For ESI(+)-MS analysis, the oils were dissolved in 1.0 cm³ of HPLC-grade methanol and injected into the ESI source of the mass spectrometer (BRUKER, model HCT ultra ETD II) with an auxiliary syringe pump by a flow of 400 µL h−1.
Spectra were acquired under the following conditions: capillary and skimmer of −3000 and 40 V, respectively, source temperature of 300 ºC, and in the m/z 100-1200 range.
Differential scanning calorimeter (DSC)
The oxidative stability of the oils extracted by different extraction methods was evaluated by the midpoint.34 An
amount of 12.0 ± 0.5 mg of oil was placed in platinum capsules and introduced into the differential scanning calorimeter (DSC) (Netzsch, model STA 6000 PerkinElmer) to be analyzed at four different temperatures: 110, 120, and 140 °C. While the temperature was being increased, the sample was kept in contact with an inert atmosphere (N2)
with a flow of 50 cm³ min−1, contacting with a flow of
50 cm³ min−1 of oxygen 4.5 in the set temperature.
Statistical and principal components analysis (PCA)
Proximate composition, phytosterols and tocopherols analyses were performed in triplicate and fatty acid analysis was done in quadruplicate. Means and standard deviations of the analytical error propagation were calculated. The results were submitted to variance analysis (ANOVA) and mean values were compared by Tukey’s test, using the Statistica software,35 version 8.0. The Principal component
analyses (PCA) were performed with the Statistica software, version 8.0.
Results and Discussion
Total lipids (TL)
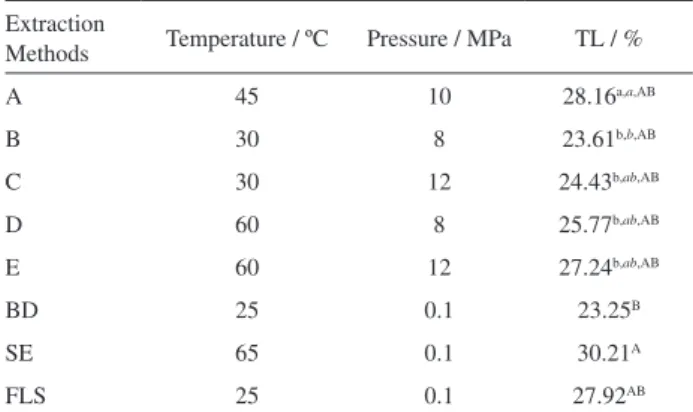
Table 2 shows the percent of TL extracted by SubFE-propane (A-E) and conventional solvent extraction methods (BD, SE e FLS). SubFE-propane A and B condition, BD and SE extraction methods presented significant differences in total lipid extraction.
Table 2. Percentage of TL extracted by different methods in dry basis
Extraction
Methods Temperature / ºC Pressure / MPa TL / %
A 45 10 28.16a,a,AB
B 30 8 23.61b,b,AB
C 30 12 24.43b,ab,AB
D 60 8 25.77b,ab,AB
E 60 12 27.24b,ab,AB
BD 25 0.1 23.25B
SE 65 0.1 30.21A
FLS 25 0.1 27.92AB
TL: Total lipids; BD: Bligh and Dyer; SE: Soxhlet; FLS: Folch, Less & Stanley. A, B, C, D and E: letters representing the testing of extraction with subcritical fluid. Averages of triplicates ± standard deviation absolute.
aAverage of triplicates of the center point. Means followed by different
italic lowercase letters in the same column demonstrated significant difference by Tukey test (p < 0.05) to different conditions of subcritical extraction chia oil with n-propane. Means followed by different uppercase letters in the same column are significantly different by Tukey test at 5% probability to different methods of chia oil extraction; bParameters used
The TL values for BD, SE and FLS were 23.25, 30.21 and 27.92% (Table 2), respectively. BD value is similar to 21.69% (in wet basis) obtained by Sargi et al.,36 which also
studied Brazilian Chia oil by BD. SE percent (30.21%) is similar to about 32.5% obtained by Olivos-Lugo et al.37 and
Monroy-Torres et al.,38 which studied the Mexican Chia oil
extracted by SE. Ixtaina et al.39 obtained by supercritical
fluid extraction with CO2 solvent, in 4 h, the same TL
amount obtained in Table 2 with n-propane solvent in 1 h.
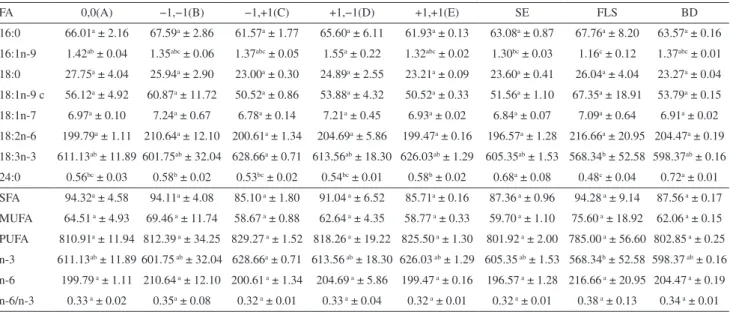
Fatty acid quantification
Table 3 shows the results for FA composition. The main FA found in the extracted oils were: palmitic acid (16:0), stearic (18:0), oleic (18:1 n-9), linoleic (18:2 n-6) and alpha-linolenic acid (18:3 n-3), and this composition agree with those found previously.3–5,36
Ixtaina et al.39 also obtained LNA values ranged from
44.4 to 63.4 mg g−1 LT (Table 2), in Mexican Chia oil.
The FA present in the highest amount was alpha-linolenic acid, with approximately 600 mg of AG g−1 of total lipids,
which is equivalent to 60% of the total mass of oil, as also reported previously,3–5 when studying different cultivars of
chia. The quantify of 18:3 n-3 obtained was the highest in C (subcritical fluid conditions).The sum of total saturated fatty acids (SFA), total monounsaturated fatty acids (MUFA), total polyunsaturated fatty acids (PUFA), total n-6 fatty acids (n-6) and n-6/n-3 ratio showed no significant differences in extraction yields.
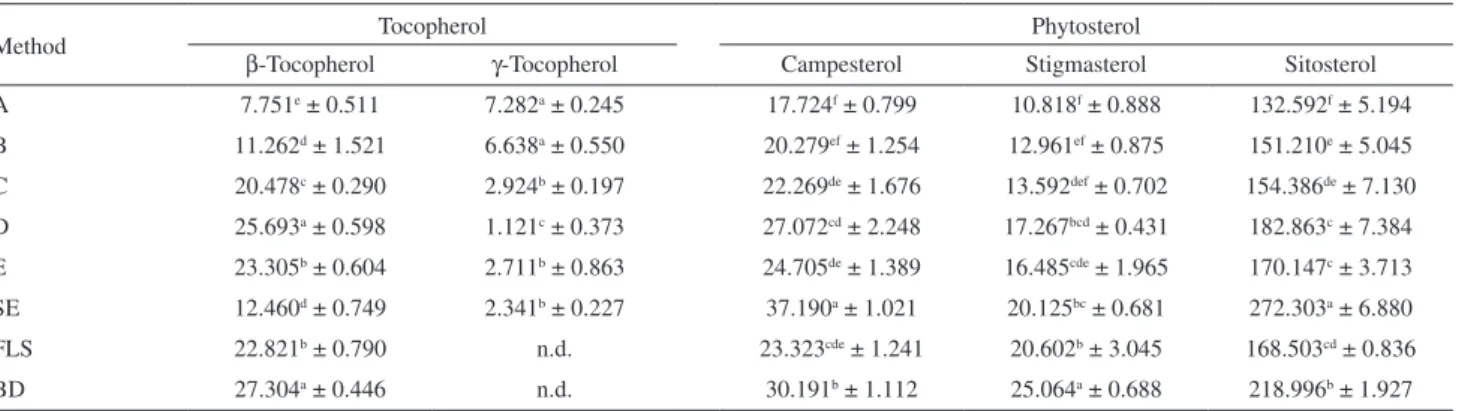
Phytosterols and tocopherols quantitation
Table 4 shows the composition of phytosterols and tocopherols obtained for Chia Oil, in mg of the compound by 100 g−1 oil.
For campesterol and sitosterol, the highest values were found for the oil obtained by Soxhlet extraction. Ciftci et al.40 in chia oil sterols extracted by Folch et al.24
and observed that the sum of sitosterol, stigmasterol and
campesterol were 205.7, 124.8 and 47.2 mg 100 g−1,
respectively. The values in Table 4 were different likely because other variety of chia was evaluated. Similar results were obtained by Ixtaina et al.39 for mechanical and solvent
lipid extraction method of tocopherol total amount, from 24 to 46 mg 100 g−1 of Chia Oil.
ESI(+)-MS analysis
All chia oils obtained by different techniques and conditions were directly analyzed by ESI(+)-MS and Figure 1 shows representative lipid profiles. Cabral et al.41
has showed that ESI(+)-MS offers a rapid and efficient technique for vegetable oil typification via triacylglycerols (TAG) profile.41 These spectra can also reveal the level of
oil oxidation.42
Note that both glycerolipids (diacylglicerol (DAG) and triacylglycerol (TAG)) and glycerophospholipids (glycerophosphoinositol (PI), glycerophosphocholine (PC), glycerophosphoserine (PS), glycerophosphates (PA),
Table 3. Quantification of fatty acids (mg g−1 of oil), summations and n-6/n-3 ratio of Chia oil extracted by the method of Bligh & Dyer, Soxhlet, Folch,
Less & Stanley and subcritical fluid using n-propane
FA 0,0(A) −1,−1(B) −1,+1(C) +1,−1(D) +1,+1(E) SE FLS BD
16:0 66.01a ± 2.16 67.59a ± 2.86 61.57a ± 1.77 65.60a ± 6.11 61.93a ± 0.13 63.08a ± 0.87 67.76a ± 8.20 63.57a ± 0.16
16:1n-9 1.42ab ± 0.04 1.35abc ± 0.06 1.37abc ± 0.05 1.55a ± 0.22 1.32abc ± 0.02 1.30bc ± 0.03 1.16c ± 0.12 1.37abc ± 0.01
18:0 27.75a ± 4.04 25.94a ± 2.90 23.00a ± 0.30 24.89a ± 2.55 23.21a ± 0.09 23.60a ± 0.41 26.04a ± 4.04 23.27a ± 0.04
18:1n-9 c 56.12a ± 4.92 60.87a ± 11.72 50.52a ± 0.86 53.88a ± 4.32 50.52a ± 0.33 51.56a ± 1.10 67.35a ± 18.91 53.79a ± 0.15
18:1n-7 6.97a ± 0.10 7.24a ± 0.67 6.78a ± 0.14 7.21a ± 0.45 6.93a ± 0.02 6.84a ± 0.07 7.09a ± 0.64 6.91a ± 0.02
18:2n-6 199.79a ± 1.11 210.64a ± 12.10 200.61a ± 1.34 204.69a ± 5.86 199.47a ± 0.16 196.57a ± 1.28 216.66a ± 20.95 204.47a ± 0.19
18:3n-3 611.13ab ± 11.89 601.75ab ± 32.04 628.66a ± 0.71 613.56ab ± 18.30 626.03ab ± 1.29 605.35ab ± 1.53 568.34b ± 52.58 598.37ab ± 0.16
24:0 0.56bc ± 0.03 0.58b ± 0.02 0.53bc ± 0.02 0.54bc ± 0.01 0.58b ± 0.02 0.68a ± 0.08 0.48c ± 0.04 0.72a ± 0.01
SFA 94.32a ± 4.58 94.11a ± 4.08 85.10 a ± 1.80 91.04 a ± 6.52 85.71a ± 0.16 87.36 a ± 0.96 94.28 a ± 9.14 87.56 a ± 0.17
MUFA 64.51 a ± 4.93 69.46 a ± 11.74 58.67 a ± 0.88 62.64 a ± 4.35 58.77 a ± 0.33 59.70 a ± 1.10 75.60 a ± 18.92 62.06 a ± 0.15
PUFA 810.91a ± 11.94 812.39 a ± 34.25 829.27 a ± 1.52 818.26 a ± 19.22 825.50 a ± 1.30 801.92 a ± 2.00 785.00 a ± 56.60 802.85 a ± 0.25
n-3 611.13ab ± 11.89 601.75 ab ± 32.04 628.66a ± 0.71 613.56 ab ± 18.30 626.03 ab ± 1.29 605.35 ab ± 1.53 568.34b ± 52.58 598.37 ab ± 0.16
n-6 199.79 a ± 1.11 210.64 a ± 12.10 200.61 a ± 1.34 204.69 a ± 5.86 199.47 a ± 0.16 196.57 a ± 1.28 216.66 a ± 20.95 204.47 a ± 0.19
n-6/n-3 0.33 a ± 0.02 0.35a ± 0.08 0.32 a ± 0.01 0.33 a ± 0.04 0.32 a ± 0.01 0.32 a ± 0.01 0.38 a ± 0.13 0.34 a ± 0.01
glycerophosphoglycerol (PG)) were detected in protonated [M + H]+, sodiated [M + Na]+ and potassiated [M + K]+
forms. TAG ions were detected in the m/z 850-1000 range, and DAG and glycerophospholipids ions were detected in the m/z 400–800 range.
The FA composition revealed by ESI(+)-MS for the chia oils shows major cluster of ions around m/z 873, a second minor cluster around m/z 851 and two less abundant clusters of ions around m/z 891 and 595. The results obtained by ESI(+)-MS in this study were compared with literature data established via ambient desorption/ionization by easy ambient sonic-spray ionization mass spectrometry (EASI(+)-MS) because according to Cabral et al.,41the
ESI(+)-MS and EASI(+)-MS has been shown to provide similar profiles for the oils.
This ESI(+)-MS profile is quite different from other common vegetable oils such as soybean and corn as reported by Simas et al.,42 using a direct ambient ionization
technique; that is, EASI(+)-MS. Marineli et al.,43 also
characterized the Chia oil using EASI(+)-MS also finding a quite typical profile with predominance of α-linolenic acid. The main FA present in the TAG molecules for the Chia oil were palmitic (P, 16:0), stearic (S, 18:0), oleic (O, 18:1n-9), linoleic (L, 18:2n-6) and particularly α-linolenic (Ln, 18:3n-3).
The ions in the ESI(+)-MS were assigned as follow:
m/z 573.5 ([PI + H]+, P), m/z 595.5 ([DAG + H]+, OP),
m/z 613.5 ([DAG + H]+, LnLn; [DAG + Na]+,PLn),
m/z 851.7 ([TAG + Na]+, PPLn) , m/z 853.7 ([TAG + Na]+,
PPL; [TAG + H]+, PLLn), m/z 855.7 ([TAG + Na]+, PPO),
m/z 873.6 ([TAG + K]+, PPS; [TAG + Na]+, LnLnP),
m/z 875.7 ([TAG + Na]+, PLLn), m/z 877.7 ([TAG + Na]+,
PLL or LnOP), m/z 879.7 ([TAG + Na]+, POL; [TAG + H]+,
LLL), m/z 891.6 ([TAG + K]+, PLLn), m/z 893.6
([TAG + K]+, PLL; [TAG + K]+, POLn or LLP;), m/z 895.6
([TAG + K]+, POL; [TAG + Na]+, LnLnLn) and m/z 897.6
([TAG + K]+, POO or LPS; [TAG + Na]+, LLnLn).
Oils obtained by SubFE-propane and by Bligh & Dyer extractions showed nearly identical spectra (Figure 1 - A) which demonstrate very similar and characteristic TAG compositions, and no significant oxidation.42 Chia oils
obtained by Soxhlet and Folch methods slightly differ by showing additional ions particularly in the m/z 380-800 range. The ESI(+)-MS of the chia oil obtained by FLS seems to display a characteristic ion of m/z 780.5 ([PC + Na]+, PL; [PS + Na]+, LnP) (Figure 1 - FLS) .
The Soxhlet extraction oil (Figure 1 - SE) displayed a diverse set of unique ions mainly of m/z 397.4 ([MAG + K]+,
S), m/z 441.4, m/z 485.4 ([PG + H]+, P), m/z 529.4 were
detected in the m/z 850–1000, m/z 551.4 (PG + K]+,
S), m/z 617.4 ([DAG + H]+, LnLn; [DAG + H]+, OLn;
([DAG + Na]+, PO; [PI + Na]+, Ln), m/z 639.4 ([PI + K]+,
S; [DAG + Na]+, LL or OLn), m/z 661.4 ([DAG + K]+, SO),
m/z 705.4 ([PA+ H]+, SS) and m/z 749.4 (PG + H]+, PO).
The differences in the ESI(+)-MS profiles of Figure 1 - A as compared to the different extraction methods (Figure 1 - FLS, BD, SE) show that the SubFE-propane Chia oil displays fortunately similar TAG profiles than that of all SE methods but SubFE-propane was able to extract considerably higher quantities of glycerophospholipids. The hydrolysis products DAG were also higher for the SE methods, likely due to the higher temperatures and longer extraction times (Figure 1 - SE).
Differential scanning calorimetry (DSC)
Table 5 shows induction temperatures obtained from differential scanning calorimetry, which determine the point where the oils begin to be oxidized. The values for the SubFE-propane oil indicate higher resistance to oxidation at
Table 4. Quantification of tocopherols and phytosterols (mg 100g−1) in chia oil extracted by the methods of Bligh & Dyer, Soxhlet, Folch, Less & Stanley
and subcritical fluid using n-propane
Method Tocopherol Phytosterol
β-Tocopherol γ-Tocopherol Campesterol Stigmasterol Sitosterol A 7.751e ± 0.511 7.282a ± 0.245 17.724f ± 0.799 10.818f ± 0.888 132.592f ± 5.194
B 11.262d ± 1.521 6.638a ± 0.550 20.279ef ± 1.254 12.961ef ± 0.875 151.210e ± 5.045
C 20.478c ± 0.290 2.924b ± 0.197 22.269de ± 1.676 13.592def ± 0.702 154.386de ± 7.130
D 25.693a ± 0.598 1.121c ± 0.373 27.072cd ± 2.248 17.267bcd ± 0.431 182.863c ± 7.384
E 23.305b ± 0.604 2.711b ± 0.863 24.705de ± 1.389 16.485cde ± 1.965 170.147c ± 3.713
SE 12.460d ± 0.749 2.341b ± 0.227 37.190a ± 1.021 20.125bc ± 0.681 272.303a ± 6.880
FLS 22.821b ± 0.790 n.d. 23.323cde ± 1.241 20.602b ± 3.045 168.503cd ± 0.836
BD 27.304a ± 0.446 n.d. 30.191b ± 1.112 25.064a ± 0.688 218.996b ± 1.927
all temperatures compared to all other SE oils, showing the effectiveness of the SubFE-propane method. The values for A were from two to five times longer than those measured for the other oils. Similar results were also observed for other oils from oleaginous obtained via SFE-CO2 and
SubFE-propane versus conventional SE extractions with hexane.21,22,44
Principal Components Analysis
PCA was performed to try to find correlations for the amount of key components (SFA, MUFA, PUFA, n-3 and n-6) in relation to the different conditions of subcritical
n-propane extraction method (Figure 2). The variance explained was 71.19 and 26.16% for PC1 and PC2,
Table 5. Time of oxidative induction obtained by differential scanning calorimetry (DSC) and its logarithmic regression equation among T0 and the temperatures of the isotherms for chia oils extracted by the methods of Bligh & Dyer, Soxhlet, Folch, Less & Stanley and subcritical fluid using n-propane
Extraction method
Temperature / ºC
Regression equation R²
110 120 140
DSC T0 / min
A 49.4 25.5 11.3 T = 461.82 – 47.19 log10T0 0.9661
FLS 27.0 10.8 2.3 T = 423.53 – 28.46 log10T0 0.9953
BD 31.3 16.4 4.5 T = 432.74 – 33.18 log10T0 0.9612
SE 38.3 17.7 5.0 T = 436.18 – 33.88 log10T0 0.9951
A: subcritical n-propane extraction at 45 °C and 10 MPa; BD: Bligh & Dyer; SE: Soxhlet; FLS: Folch, Less & Stanley. Figure 1. ESI(+)–MS spectra for Chia oils in methanol solutions obtained by different extraction methods, as indicated.
respectively, reducing the five variables for two and totaling 97.35%. Conditions C and E were more efficient in relation to the sum of n-3 PUFA and AGPI extraction.
Conclusions
SubFE-propane has been found to represent indeed a promising alternative for oil extraction with superior results as compared with conventional SE methods. The oil obtained by SubFE-propane is less oxidized compared to oils obtained by SE, BD and FLS and has higher purity. SubFE-propane at 45 °C and 10 MPa when applied to Chia oil extraction showed to be fast providing the highest oil yield, purity, and best oxidation stability with comparable levels of biologically active components.
Acknowledgments
The authors would like to thank Coordenação de Aperfeiçoamento de Pessoal de Nível Superior (CAPES), Conselho Nacional de Desenvolvimento Científico e Tecnológico (CNPq) and Fundação de Amparo à Pesquisa do Estado de São Paulo (FAPESP) for the scholarship for J. M. S. (process No. 2013/19161-4).
References
1. Coorey, R.; Tjoe, A.; Jayasena, V.; J. Food Sci. 2014,79, E859.
2. Ixtaina, V. Y.; Vega, A.; Nolasco, S. M.; Tomas, M. C.; Gimeno, M.; Barzana, E.; Tecante, A.; J. Food Comp. Anal.
2011,14, 166.
3. Porras-Loaiza, P.; Jimenez-Munguıa, M. T.; Sosa-Morales, M. E.; Palou, E.; Lopez-Malo, A.; Int. J. Food Sci. Tech. 2014, 49, 571. 4. Peiretti, P. G.; Gai, F.; Anim. Feed Sci. Tech.2009, 148, 267. 5. Ayerza, R.; J. Oleo Sci.2009,58, 347.
6. Moreau, R. A.; Whitaker, B. D.; Hicks, K. B.; Prog. Lipid Res.
2002,41, 457.
7. Moreda, A. C. W.; Pérez-Camino, M. C.; J. Chromatogr. A.
2000,881, 131.
8. Simopoulos, A. P.; Food Rev. Int.2004,20, 77.
9. Martins, S. L. C.; Silva, H. F.; Rita, M.; Garbi, C.; Ito, M. K.;
Arch. Latinoam. Nutr.2004, 1, 1.
10. Köksal, A. I.; Artik, N.; Simsek, A.; Günes, N.; Food Chem.
2006, 99, 509.
11. Simopoulos, A. P.; Am. J. Clin. Nutr. 1991, 54, 438.
12. Zanqui, A. B.; Maruyama, S. A.; Barilli, D. J.; Ribeiro, S. A. O.; Gomes, S. T. M.; Visentainer, J. V.; Matsushita, M.; Food Sci. Tech.2013,33, 532.
13. Nyan, K. L.; Tan, C. P.; Karim, R.; Lai, O. M.; Long, K.; Man, Y. B. C.; Food Chem.2010,119, 1278.
14. Garcia, V. A. S.; Cabral, V. F.; Zanoelo, E. F.; Silva, C.; Cardozo-Filho, L.; J. Supercrit. Fluids 2012, 69, 75.
15. Nimet, G.; da Silva, E. A.; Palú, F.; Dariva, C.; Freitas, L. S.; Medina-Neto, A.; Carodozo-Filho, L.; Chem. Eng. J.2011, 168, 262.
16. Yepez, B.; Espinosa, M.; López, S.; Bolaños, G.; Fluid Phase Equilib.2002,194, 879.
17. Passos, C. P.; Silva, R. M.; Da Silva, E. A.; Coimbra, M. A.; Silva, C. M.; Chem. Eng. J.2010,160, 634.
18. Mariod, A. A.; Matthäus, B.; Ismail, M.; J. Am. Oil Chem. Soc.
2011,88, 931.
19. Aguiar, A. C.; Visentainer, J.; Martínez, J.; J. Supercrit. Fluids
2012, 71, 1.
20. Xu, X.; Gao, Y.; Liu, G.; Wang, Q.; Zhao, J.; Food Sci. Technol. 2006,41, 1223.
21. Corso, M. P.; Fagundes-Klen, M. R.; Silva, E. A.; Cardozo-Filho, L.; Santos, J. N.; Freitas, L. S.; Dariva, C.;
J. Supercrit. Fluids 2010,52, 56.
22. Pederssetti, M. M.; Palú, F. S.; Rohling, E. A.; Hillmann, J.; Cardozo-Filho, L.; Dariva, C.; J. Food Eng.2011,102, 189. 23. Santos Freitas, L.; Jacques, R. A.; Richter, M. F.; Silva, A. L.;
Caramão, E. B.; J. Chromatogr. A 2008,1200, 80.
24. Folch, J.; Lees, M.; Stanley, S.; J. Biol. Chem.1957, 226, 497. 25. Bligh, E. G.; Dyer, W. J.; Can. J. Biochem. Physiol. 1959,37,
911.
26. Cunniff, P. ed.; Official Methods of Analysis of AOAC International, AOAC International: Arlington, 1998, ch. 2, p. 52. 27. Souza, A. T.; Benazzi, T. L.; Grings, M. B.; Cabral, V. A.;
Silva, E.; Cardozo-Filho, L.; Antunes, O. A. C.; J. Supercrit. Fluids 2008,47, 182.
28. Hartman, L., Lago, R. C.; Lab. Pract.1973,22, 475. 29. Joseph, J. D.; Ackman, R. G.; J. Assoc. Off. Anal. Chem. Int.
1992,75, 488.
30. Visentainer, J. V.; Quim. Nova 2012,35, 274. 31. Du, M.; Ahn, D. U.; J. Food Sci. 2002,67, 1696.
32. Beveridge, T. H. J.; Li, T. S. C.; Drover, J. C. G.; J. Agric. Food Chem. 2002, 50, 744.
33. Li, T. S. C.; Beveridge, T. H. J.; Drover, J. C. G.; Food Chem.
2007,101, 1633.
34. Tan, C. P.; Che Man, Y. B.; Selamat, J.; Yusoff, M. S. A.; Food Chem. 2002, 76, 385.
35. StatSoft, Inc.; Statistica: Data Analysis Software System, version 8.0, 2007.
36. Sargi, S. C.; Silva, B. C.; Santos, H. M. C.; Montanher, P. F.; Boeing, J. S.; Santos-Júnior, O. O.; Souza, N. E.; Visentainer, J. V.; Food Sci. Technol. 2013,33, 541.
37. Olivos-Lugo, B. L.; Valdivia-López, M. A.; Tecante, A.; Food Sci. Technol. Int.2010, 16, 89.
38. Monroy-Torres, R.; Mancilla-Escobar, M. L.; Gallaga-Solórzano, J. C.; Medina-Godoy, S.; Santiago-Garcia, E. J.;
39. Ixtaina, V. Y.; Vega, A.; Nolasco, S. M.; Tomás, M. C.; Gimeno, M.; Bárzana, E.; Tecante, A.; J. Supercrit. Fluids 2010,55, 192.
40. Ciftci, O. N.; Przybylski, R.; Rudzińska, M.; Eur. J. Lipid Sci. Tech.2012,114, 794.
41. Cabral, E. C.; Sevart, L.; Spindola, H. M.; Coelho, M. B.; Sousa, I. M. O.; Queiroz, N. C.; Foglio, M.; Eberlin, M. N.; Riveros, J. M.; Phytochem. Anal.2013,24, 184.
42. Simas, R. C.; Barrera-Arellano, D.; Eberlin, M. N.; Catharino, R. R.; Souza, V.; Alberici, R. M.; J. Am. Oil Chem. Soc. 2012,
89, 1193.
43. Marineli, R. S.; Moraes, E. A.; Lenquiste, S. A.; Godoy, A. T.; Eberlin, M. N.; Maróstica Jr., M. R.; Food Sci. Technol. 2014,
59, 1304.
44. Silva, C. M.; Zanqui, A. B.; Souza, A. H. P; Gohara, A. K.; Chaves, M. A.; Gomes, S. T. M.; Cardozo-Filho, L.; Souza, N. E.; Matsuhita, M.; J. Braz. Chem. Soc.; DOI: 10.5935/0103-5053.20140207.
Submitted: July 31, 2014
Published online: November 25, 2014