Article
J. Braz. Chem. Soc., Vol. 26, No. 2, 319-324, 2015. Printed in Brazil - ©2015 Sociedade Brasileira de Química 0103 - 5053 $6.00+0.00
A
*e-mail: [email protected]
High Throughput Enzymatic Enantiomeric Excess: Quick-
ee
Maria L. S. O. Lima,a Caroline C. S. Gonçalves,a Juliana C. Barreiro,b
Quezia B. Cassb and Anita J. Marsaioli*,a
aInstitute of Chemistry, State University of Campinas, CP 6154, 13083-970 Campinas-SP, Brazil
bDepartment of Chemistry, Federal University of São Carlos, CP 676, 13565-905 São Carlos-SP, Brazil
High throughput techniques to evaluate enantiomeric excess (ee) and enantiomeric ratio (E) of enzymatic reactions are fast and efficient tools that can be applied large quantities of enzymes, microorganisms and clones. The Quick-ee technique proposed in this study produces the ee and conversion values separately.
Keywords: enantiomeric excess (ee), enantiomeric ratio (E), high throughput screening (HTS)
Introduction
There is a growing need for enzymatic and multienzymatic cascade processes in the chemical and pharmaceutical industries to replace chemical steps with steps that incorporate green chemistry principles.1-5 When enantiomerically pure products are required, enzymes are the catalysts of choice for enantio-, diastereo- and site-selective transformations, due to their specificity in discriminating prochiral centres and faces.6-10
Currently, tailored enzymatic performance is achieved using genetic engineering to modify catalytic sites using several techniques, including site-directed evolution.11,12 The transformation process requires modification of the DNA fragment encoding the enzyme, which is inserted into a vector (plasmid, phosmid or virus) and introduced into host cells, producing several clones with different specificities. Sorting these clones leads to highly specific enzymes and products with high enantiomeric excesses (ee) and yields.13 Such transformations can be further improved to broaden their catalytic applications by generating enzymes that accept several substrates (substrate promiscuity).14,15 These attributes enhance the application of this biotechnology in industry, where molecular engineering and green chemistry work together to add value to products.16,17 These biocatalyst issues (ee, enantiomeric ratio(E), etc.) require access to fast and sensitive methodologies,18-21 such as high throughput screening (HTS).22,23 Methodologies to rapidly obtain the enantiomeric ratio require chiral substrates
and initial rate monitoring (V0) for each enantiomer.24,25 These HTS techniques usually employ chromogenic or fluorogenic probes, allowing for the simultaneous evaluation of 6, 24, 96, or 384 reactions.26-28 Based on this idea, Kazlauskas and co-workers introduced Quick-E for hydrolases through the application of chiral chromogenic probes. A chromogenic competitor was also introduced into the experiment, which behaved as the enantiomer, a statement not exactly true because they are different compounds, thus producing a good E evaluation.26
Similar methodology was proposed by Reymond et al.27-29 However, this methodology does not use a competitor and is based on fluorogenic probes, which are usually more sensitive (approximately 103).29 The lack of enantiomeric competition for the enzyme active site results in large deviations from true E values.
In this study, we applied both concepts, exploiting both the sensitivity of fluorogenic probes and competition, for the HTS evaluation of ee, which is referred to here as Quick-ee.
Experimental
Cultivation of microorganisms
Fluorescence assays
Cells were harvested with a Drigalsky’s spatula and suspended in borate buffer (pH 7.4, 0.2 mmol L−1). (R)-1 ((R)-7-(3,4-diacetoxybutyloxy)-2H-1-benzopyran-2-one), (S)-1 ((S)-7-(3,4-diacetoxybutyloxy)-2H -1-benzopyran-2-one) and 2 (7-(2-acetoxyethyloxy)-2H -1-benzopyran-2-one)), synthesized according to Reymond’s methodology,29 were each dissolved in H2O:MeCN 1:1 to prepare solutions of 1 mmol L−1 and 2 mmol L−1 for the assays with and without competition, respectively. All assays were performed in triplicate in 96 well microtitre plates, with 200 µL in each well. Fluorescence was measured using an Analytik Jena AG FlashScan 530 spectrophotometer, equipped with λex 360 nm and λem 460 nm filters (24 h, 28 °C).
The assays (enzymatic assay, negative control and positive control) were monitored for 24 h at 28 °C, simultaneously.
Enzyme and microorganism screening
Enzymatic assay. To each well were added NaIO4 (10 µL, 20 mmol L−1 in water), bovine serum albumin (BSA) (80 µL, 5.0 g L−1 in borate buffer, pH 7.4), racemic probe (1) (10 µL, 2 mmol L−1), and enzymatic or cell suspension (100 µL, 0.2 g L−1).
Negative control. To each well were added NaIO4 (10 µL, 20 mmol L−1 in water), BSA (80 µL, 5.0 g L−1 in borate buffer, pH 7.4), racemic probe (1) (10 µL, 2 mmol L−1) and borate buffer (100 µL, pH 7.4).
Positive control. To each well were added NaIO4 (10 µL, 20 mmol L−1 in water), BSA (80 µL, 5.0 g L−1 in borate buffer, pH 7.4), racemic alcohol (3)(10 µL, 2 mmol L−1), and enzymatic or cell suspension (100 µL, 0.2 g L−1).
Assays without competition
Enzymatic assay. To each well were added NaIO4 (10 µL, 20 mmol L−1 in water), BSA (80 µL, 5.0 g L−1 in borate buffer, pH 7.4), fluorescent probe (R)-1 or (S)-1
(10 µL, 2 mmol L−1), and enzymatic or cell suspension (100 µL, 0.2 g L−1).
Negative control. To each well were added NaIO4 (10 µL, 20 mmol L−1 in water), BSA (80 µL, 5.0 g L−1 in borate buffer, pH 7.4), fluorescent probe (R)-1 or (S)-1 (10 µL, 2 mmol L−1), and borate buffer (100 µL, pH 7.4).
Positive control.To each well were added NaIO4 (10 µL, 20 mmol L−1 in water), BSA (80 µL, 5.0 g L−1 in borate buffer, pH 7.4), alcohol (R)-3 or (S)-3 (10 µL, 2 mmol L−1), and enzymatic or cell suspension (100 µL, 0.2 g L−1).
Quick-E and Quick-ee (without competition)
Enzymatic assay. To each well were added NaIO4 (10 µL, 20 mmol L−1 in water), BSA (70 µL, 5.7 g L−1 in borate buffer, pH 7.4), fluorescent probe (R)-1 or (S)-1 (10 µL, 1 mmol L−1), competitor (2) (10 µL, 1 mmol L−1), and enzymatic or cell suspension (100 µL, 0.2 g L−1).
Negative control. To each well were added NaIO4 (10 µL, 20 mmol L−1 in water), BSA (70 µL, 5.7 g L−1 in borate buffer, pH 7.4), fluorescent probe (R)-1 or (S)-1
(10 µL, 1 mmol L−1), competitor (2)(10 µL, 1 mmol L−1), and borate buffer (100 µL, pH 7.4).
Positive control.To each well were added NaIO4 (10 µL, 20 mmol L−1 in water), BSA (70 µL, 5.7 g L−1 in borate buffer, pH 7.4), alcohol (R)-3 or (S)-3 (10 µL, 1 mmol L−1), alcohol competitor (4)(10 µL, 1 mmol L−1), and enzymatic or cell suspension (100 µL, 0.2 g L−1).
Biotransformations
To the implementation of the Quick-ee methodology, the racemic fluorogenic probe 1 (10 µL, 2.0 mmol L−1 in H2O/MeCN, 1:1) were added to the cell suspension (190 µL, 2.0 g L−1) to reach a final concentration of 100 mmol L−1. The diol enantiomeric excess (ee) was determined by high performance liquid chromatography (HPLC) using a CHIRALPAK-IC (Daicel: 25 cm × 0.46 cm) column, which contains a chiral stationary phase, with 6:4 ethanol:hexane as the eluent, an injection volume of 20 µL, a flow rate of 1.0 mL min−1 and l
abs= 320 nm.
Calculations
Eestimatedand Quick-E
The E value determined in assays without competitor 2
(Eestimated) and E value determined in assays with competitor 2
(Quick-E) were determined from the initial reaction rates (V0) for each enantiomer (equation 1), which were obtained from the slope of the curve of reactant concentration versus
time (t) at t = 0 (V0).
E=
(V0)fast enantiomer
(V0)slow enantiomer
ee with competition (Quick-ee) and without competition
(eeestimated)
The enantiomeric excess values were calculated (equation 2) for each point using the fluorescence signal measurement for each assay (relative fluorescence unit, RFU).
ee %=
(RFUfast enantiomer−RFUslow enantiomer)
(RFUfast enantiomer+ RFUslow enantiomer)
× 100 (2)
% conversions
The conversions (c) were calculated at each point of the curve by taking into account the fluorescent signals of the assays and the positive control (equation 3).
(RFUfast enantiomer+RFUslow enantiomer)
(RFUpositive control (fast enantiomer)+RFUpositive control(slow enantiomer))
c%= × 100 (3)
Results and Discussion
Screening of enzymes and microorganisms
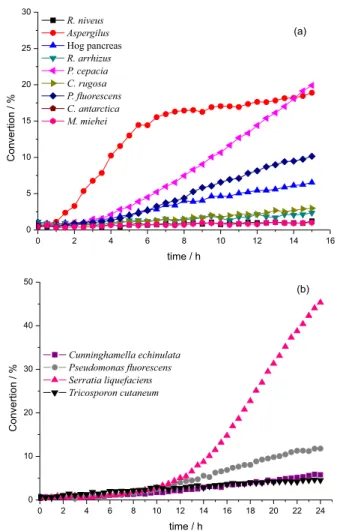
For the validation of the Quick-ee experiments, we have selected eight enzymes [Lipase basic kit, SIGMA-ALDRICH: Aspergillus (84205), Candida rugosa (62316),
Mucor miehei (62298), Pseudomonas cepacia (62309),
Pseudomonas fluorescens (95608), Rhizopus arrhizus
(62305), Rhizopus niveus (62310), Hog pâncreas (62300)] (Figure 1a); and four microorganisms [Serratia liquefaciens
(CCT-1479), Pseudomonas fluorescens (CCT-7393), Cunninghamella echinulata (CCT-4259) and Tricosporon cutaneum (CCT-1903)] for the hydrolysis of the fluorogenic probe 1 (Figure 1b).19,22
The best conversions were obtained with the microorganisms Serratia liquefaciens (CCT-1479),
Pseudomonas fluorescens (CCT-7393), and the lipase from
Aspergillus (Sigma-Aldrich 84205) (Figures 1a and 1b, respectively). However, although Serratia liquefaciens
(CCT-1479) converted the probe 1 in good yields, the enantioselectivity was poor. Thus, for implementing the methodology of Quick-ee, we used the microorganism
Pseudomonas fluorescens (CCT-7393) and the enzyme
lipase from Aspergillus (Sigma-Aldrich 84205).
Quick-ee
Assay conversions (c) and enantiomeric excess (ee) values at a specific time are parameters of fundamental importance in the kinetic characterization of an enzyme. Therefore, it is interesting to investigate new methodologies to obtain these parameters using high throughput screening.
Two methodologies employing fluorogenic probes were developed. The first is based on Reymond’s methodology26 and calculates E from the ratio between the initial rates of each enantiomer, which are evaluated separately. However, this methodology does not take into consideration the enantiomeric competition for the active site, which can produce large deviations from the real ee. Kazlauskas’ methodology27 of using chromogenic probes introduces competition to minimize effects resulting from the lack of competition. However, both methodologies do not reveal the ee and conversions at a particular reaction time. To overcome previous limitations, we fused the Reymond’s and Kazlauskas’s26,27 methodologies by implementing the assay with fluorogenic probe 1 and a nonfluorogenic competitor 2 to obtain ee and conversion (Figures 2 and 3).
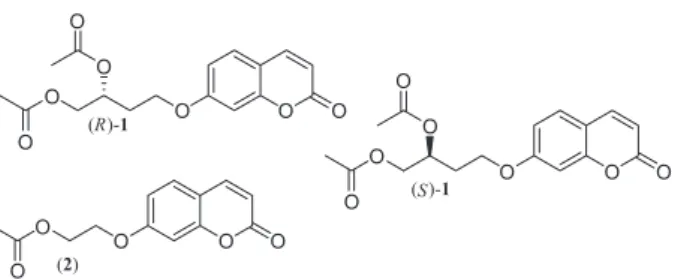
Choosing the nonfluorogenic competitor
The nonfluorogenic competitor 2 was selected by taking into consideration its structural similarity to the probe 1
(Scheme 1).
0 2 4 6 8 10 12 14 16
0 5 10 15 20 25 30
C
o
n
v
e
rt
io
n
/
%
time / h R. niveus
Aspergilus
Hog pancreas
R. arrhizus P. cepacia C. rugosa P. fluorescens C. antarctica M. miehei
(a)
0 2 4 6 8 10 12 14 16 18 20 22 24
0 10 20 30 40 50
Cunninghamella echinulata Pseudomonas fluorescens Serratia liquefaciens Tricosporon cutaneum
C
o
n
v
e
rt
io
n
/
%
time / h
(b)
Thus (R)-1 and 2 (or (S)-1 and 2) can compete for the hydrolase enzymatic site producing diols (R)-3 and (S)-3 and alcohol 4, respectively. However diols (R)-3
and (S)-3 are cleaved by the periodate present in the reaction mixture, producing aldehyde 5,which undergoes
β-elimination, catalysed by BSA, producing a fluorescent signal (Scheme 1). The fluorescent signal intensity is concentration dependent and reveals the amount of umbelliferone produced.27 The same enzymatic cascade does not occur with alcohol 4,which is not oxidized, does
not undergo β-elimination and, consequently, does not produce a fluorescent signal (Scheme 1).
Quick-ee experiments
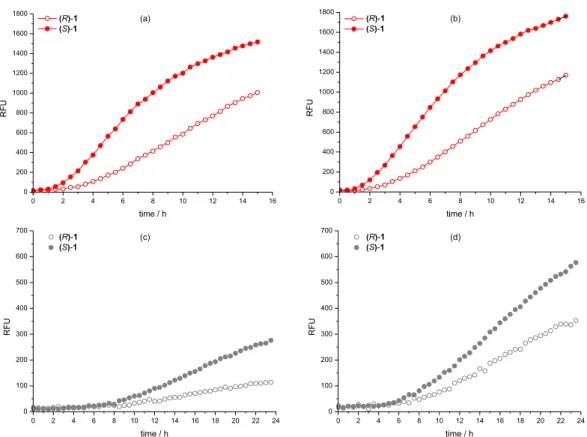
Biocatalytic hydrolyses of (R)-1 and (S)-1 with
Aspergillus lipase (SIGMA ALDRICH 84205), (Figure 4a and 4b) revealed that (S)-1 is preferentially hydrolysed, producing a fluorescent signal of higher intensity than (R)-1
at any reaction time observed until 24 h, with and without competitor 2 (Figures 4a and 4b, respectively). The same is true for the reaction with Pseudomonas fluorescens (CCT-7393) cells (Figures 4c and 4d).
The real ee = 30 value for Aspergillus lipase (Sigma-Aldrich 84205) (determined by chiral HPLC, in the Supporting Information (SI) section, Figure S5) was determined at 30% conversion and the Quick-ee was 45 (Figure 5b) (Table 1). This value is closer to real ee (eereal) than the estimated ee (eeestimated = 55), obtained without competitor (Figures 5a, 5b) (Table 1). The same is true for the reaction with Pseudomonas fluorescens (CCT-7393) cells (Figures 5c, 5d) (Table 1).
E values were obtained from the initial speed ratios of each enantiomer in each assay. E values improved in the presence of competitors (Quick-E) (Table 2) This is assigned to the competition of both fluorogenic probes ((R)-1 and (S)-1) and its competitor (2) to the enzyme active site.
Conclusions
The Quick-ee was validated for enzymes and microorganisms and the results in the presence of a competitor were closer to real ee for low E reactions. This methodology provides an easy access evaluation of numerous samples, such as libraries of mutants and clones.
O O
O O
O
O O
(R)-1
O O
O O
O
O O
(S)-1
O O
O O
O (2)
Figure 2. Fluorogenic probes (R)-1 and (S)-1 and non fluorogenic competitor 2 employed in Quick-ee assays.
Figure. 3. Representation of microtitre plate assay to obtain
ee with a competitor 2 (Quick-ee) and without a competitor 2. Representation: (a) and (h) Pseudomonas fluorescens (CCT-7393); (b) and (g) Cunninghamella echinulata (CCT-4259); (c) and (f) lipase from Aspergillus (Sigma-Aldrich 84205); (d) and (e) Serratia liquefaciens
(CCT-1479).
Scheme 1. Enzymatic reaction with fluorogenic probes (S)-1, (R)-1 and non-fluorogenic competitor 2.
O O O
O O
O O
O O O
O O
O O
O O O
OH HO
O O O
OH
HO O O O
O O O
O
O
O O O
HO
_
pH > 6.5 Esterase
Esterase
Esterase
( )-S1 ( )-R 1
( )2
( )-R 3
( )-S3
( )4
NaIO4 NaIO4
NaIO4
O O O
O
(5)
0 2 4 6 8 10 12 14 16 0
200 400 600 800 1000 1200 1400 1600 1800
R
F
U
time / h
( )R-1 ( )R-1
( )R-1 ( )R-1
( )S-1 ( )S-1
( )S-1 ( )S-1
(a)
0 2 4 6 8 10 12 14 16
0 200 400 600 800 1000 1200 1400 1600 1800
RFU
time / h (b)
0 2 4 6 8 10 12 14 16 18 20 22 24 0
100 200 300 400 500 600 700
R
F
U
time / h (c)
0 2 4 6 8 10 12 14 16 18 20 22 24 0
100 200 300 400 500 600 700
R
F
U
time / h (d)
Figure. 4. Fluorescence signals from assays using the Aspergillus enzyme (Sigma-Aldrich 84205) (a) with competitor 2 and (b) without competitor 2;
Pseudomonas fluorescens (CCT-7393) microorganism (c) with competitor 2 and (d) without competitor 2, showing the preference for (S)-1.
0 10 20 30 40 50 60 70 80 90 100
0 10 20 30 40 50 60 70 80 90 100
e
e
/
%
c / %
(a)
0 10 20 30 40 50 60
0 10 20 30 40 50 60 70 80 90 100
e
e
/
%
c / %
(b)
0 2 4 6 8 10 12 14 16 18
0 10 20 30 40 50 60 70 80 90 100
e
e
/
%
c / %
(c)
0 2 4 6 8 10 12 14 16 18
0 10 20 30 40 50 60 70 80 90 100
e
e
/
%
c / %
(d)
Table 1. ee values for assays without competition (eeestimated), with competition (Quick-ee), and the real ee (eereal)
Enzyme / Microorganism Conversion /
%c eeestimatedd Quick-eed eereal
Deviation / % (eeestimate)
Deviation / % (Quick-ee)
Enantioselective for
Lipase from Aspergillusa 30 55 45 30 83.3 50.0 (S)-1
Pseudomonas fluorescensb 4 35 27 25 40 8 (S)-1
aEnzyme; bmicroorganism; cequation 3; dequation 2.
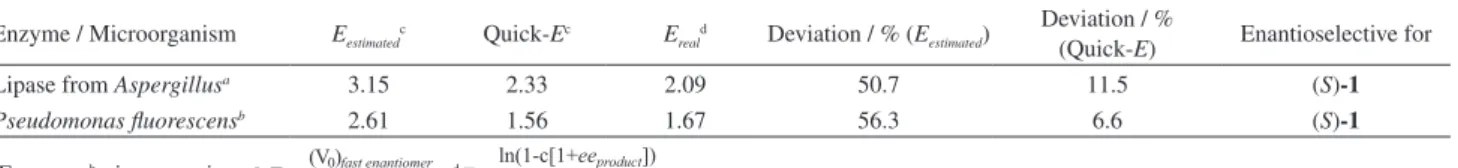
Table 2. E values from experiments with and without competitors
Enzyme / Microorganism Eestimatedc Quick-Ec Ereald Deviation / % (Eestimated)
Deviation / %
(Quick-E) Enantioselective for
Lipase from Aspergillusa 3.15 2.33 2.09 50.7 11.5 (S)-1
Pseudomonas fluorescensb 2.61 1.56 1.67 56.3 6.6 (S)-1
aEnzyme; bmicroorganism; cE = (V0)fast enantiomer
(V0)slow enantiomer
; dE =
ln(1-c[1−eeproduct])
ln(1-c[1+eeproduct])
.
Supplementary Information
S u p p l e m e n t a r y d a t a ( c h r o m a t o g r a m s o f biotransformation assays) are available free of charge at http://jbcs.sbq.org.br as PDF file.
Acknowledgements
We would like to thank FAPESP (Processes 2010/51278-0 and 22010/51278-011/12010/51278-0385-1), VALE, Petrobrás and CNPq (Process 140741/2013-5) (Brazil) for financial support. We are also grateful to Prof Ronaldo Aloise Pilli, Institute of Chemistry-UNICAMP, for the HPLC chiral column.
References
1. Siódmiaka, T.; Ziegler-Borowskab, M.; Marszałł, M. P.; J. Mol.
Catal. B: Enzym. 2013, 94, 7.
2. Solano, D. M.; Hoyos, P.; Hernáiz, M. J.; Alcántara, A. R.; Sánchez-Montero, J. M.; Bioresource Technol. 2012, 115, 196. 3. Hudlicky, T.; Reed, J. W.; Chem. Soc. Rev. 2009, 38, 3117.
4. Pollard, D. J.; Woodley, J. M.; Trends Biotechnol. 2007, 25, 66. 5. Ghislieri, D.; Green, A. P.; Pontini, M.; Willies, S. C.; Rowles, I.; Frank, A.; Grogan, G.; Turner, N. J.; J. Am. Chem. Soc. 2013,
135, 10863.
6. Schober, M.; Faber, K.; Trends Biotechnol. 2013, 31, 468. 7. Sethi, M. K.; Bhandya, S. R.; Kumar, A.; Maddur, N.;
Shukla, R.; Mittapalli, V. S. N. J.; J. Mol. Catal. B: Enzym.
2013, 91, 87.
8. Andreua, C.; Olmo, M.; J. Mol. Catal. B: Enzym. 2013, 92, 57. 9. Ni, Y.; Xu, J.-H.; Biotechnol. Adv. 2012, 30, 1279.
10. Gonçalves, C. C. S.; Marsaioli, A. J.; Quim. Nova2014, 37, 1028; Chaves, M. R. B.; Moran, P. J. S.; Rodrigues, J. A. R.; J.
Mol. Catal. B: Enzym. 2013, 98, 73.
11. Reetz, M. T.; J. Am. Chem. Soc. 2013, 135, 12480. 12. Ye, L.; Xu, H.; Yu, H.; Biochem. Eng. J. 2013, 79, 182.
13. Reetz, M. T.; Bocola, M.; Wang, L.-W.; Sanchis, J.; Cronin, A.; Arand, M.; Zou, J.; Archelas, A.; Bottalla, A.-L.; Naworyta, A.; Mowbray, S. L.; J. Am. Chem. Soc. 2009, 131, 7334. 14. Wang, M.; Si, T.; Zhao, H.; Bioresource Technol. 2012, 115, 117. 15. Cobba, R. E.; Sunc, N.; Zhao, H.; Methods 2013, 60, 81. 16. Bornscheuer, U. T.; Huisman, G. W.; Kazlauskas, R. J.; Lutz, S.;
Moore, J. C.; Robins, K.; Nature 2012, 485, 185.
17. Guinea, I. O.; Junceda, E. G.; Curr. Opin. Chem. Biol. 2013,
17, 236.
18. Cruz, G. F.; Angolini, C. F. F.; Oliveira, L. G.; Lopes, P. F.; Vasconcellos, S. P.; Crespim, E.; Oliveira, V. M.; Neto, E. V. S.; Marsaioli, A. J.; Appl. Microbiol. Biotechnol. 2010, 87, 319. 19. Mantovani, S. M.; Oliveira, L. G.; Marsaioli, A. J.; J. Braz.
Chem. Soc. 2010, 21, 1484.
20. Sicard, R.; Chen, L. S.; Marsaioli, A. J.; Reymond, J.-L.; Adv.
Synth. Catal. 2005, 347, 1041.
21. Michaelis, L.; Menten, M. L.; FEBS Lett. 2013, 587, 2712. 22. Rice, A. J.; Truong, L.; Johnson, M. E.; Lee, H.; Anal. Biochem.
2013, 441, 87.
23. Reymond, J.-L.; Food Technol. Biotechnol. 2004, 42, 265. 24. Grognux, J.; Wahler, D.; Nyfeler, E.; Reymond, J.-L.;
Tetrahedron: Asymmetry 2004, 15, 2981.
25. Andrade, G. S. S.; Freitas, L.; Oliveira, P. C.; Castro, H. F.;
J. Mol. Catal. B: Enzym. 2012, 84, 183.
26. Janes, L. E.; Kazlauskas, R. J.; J. Org. Chem. 1997, 62, 4560. 27. Badalassi, F.; Wahler, D.; Klein, G.; Crotti, P.; Reymond, J.-L.;
Angew. Chem., Int. Ed. 2000, 39, 4067.
28. Mantovani, S. M.; Oliveira, L. G.; Marsaioli, A. J.; J. Mol.
Catal. B: Enzym. 2008, 52-53, 173.
29. Wahler, D.; Badalassi, F.; Crotti, P.; Reymond, J.-L.; Chem. Eur. J. 2002, 8, 3211.
Submitted on: August 12, 2014
Published online: November 28, 2014