ACPD
11, 15745–15774, 2011Cirrus cloud-temperature
interactions
J. R. Taylor et al.
Title Page
Abstract Introduction
Conclusions References
Tables Figures
◭ ◮
◭ ◮
Back Close
Full Screen / Esc
Printer-friendly Version Interactive Discussion
Discussion
P
a
per
|
Dis
cussion
P
a
per
|
Discussion
P
a
per
|
Discussio
n
P
a
per
|
Atmos. Chem. Phys. Discuss., 11, 15745–15774, 2011 www.atmos-chem-phys-discuss.net/11/15745/2011/ doi:10.5194/acpd-11-15745-2011
© Author(s) 2011. CC Attribution 3.0 License.
Atmospheric Chemistry and Physics Discussions
This discussion paper is/has been under review for the journal Atmospheric Chemistry and Physics (ACP). Please refer to the corresponding final paper in ACP if available.
Cirrus cloud-temperature interactions in
the tropical tropopause layer:
a case study
J. R. Taylor1, W. Randel1, and E. J. Jensen2
1
National Center for Atmospheric Research, Atmospheric Chemistry Division, Boulder, CO, USA
2
NASA Ames Research Center, Earth Science Division, Moffett Field, CA, USA
Received: 5 April 2011 – Accepted: 17 May 2011 – Published: 24 May 2011
Correspondence to: J. R. Taylor ([email protected])
ACPD
11, 15745–15774, 2011Cirrus cloud-temperature
interactions
J. R. Taylor et al.
Title Page
Abstract Introduction
Conclusions References
Tables Figures
◭ ◮
◭ ◮
Back Close
Full Screen / Esc
Printer-friendly Version Interactive Discussion
Discussion
P
a
per
|
Dis
cussion
P
a
per
|
Discussion
P
a
per
|
Discussio
n
P
a
per
|
Abstract
Thin cirrus clouds in the Tropical Tropopause Layer (TTL) have important ramifications for radiative transfer, stratospheric humidity, and vertical transport. A horizontally ex-tensive and vertically thin cirrus cloud in the TTL was detected by the Cloud Aerosol LIDAR and Infrared Pathfinder Satellite Observations (CALIPSO) on 27–29 January,
5
2009 in the Tropical Eastern Pacific region, distant from any regions of deep convec-tion. These observations indicate that the cloud is close to 3000 km in length along the CALIPSO orbit track. Measurements over this three day period indicate that the cloud event extended over a region from approximately 15◦S to 10◦N and 90◦W to 150◦W and may be one of the most extensive cirrus events ever observed. Coincident
tem-10
perature observations from the Constellation of Observing Satellites for Meteorology, Ionosphere, and Climate (COSMIC) suggest that the cloud formed in-situ as a result of a cold anomaly arising from a midlatitude intrusion. The event appears to last for up to 2 days and the temperature observations do not show any indication of the ex-pected infrared heating. It is hypothesized that the cloud could be maintained by either
15
nucleation of numerous small ice crystals that do not sediment or by multiple localized ice nucleation events driven by temperature variability at scales smaller than the over-all cloud field, producing smover-all ice-crystal sizes which have sufficiently long residence times (≈53 h) to maintain the cloud. It is possible that the residence times are aug-mented by vertical motion which could also act to offset the expected infrared heating.
20
Further observations of similar events will be required in order to conclusively explain this curious cloud.
1 Introduction
Cirrus clouds have been predicted and observed in the Tropical Tropopause Layer (TTL) for almost 30 years (Robinson, 1980; Winker and Trepte, 1998; Fueglistaler,
25
ACPD
11, 15745–15774, 2011Cirrus cloud-temperature
interactions
J. R. Taylor et al.
Title Page
Abstract Introduction
Conclusions References
Tables Figures
◭ ◮
◭ ◮
Back Close
Full Screen / Esc
Printer-friendly Version Interactive Discussion
Discussion
P
a
per
|
Dis
cussion
P
a
per
|
Discussion
P
a
per
|
Discussio
n
P
a
per
|
optical depths less than 0.03 (Sassen and Cho, 1992)). These thin, often sub-visible, clouds can have optical depths of less than 0.03 and are the most common form of cloud in the TTL (Wang and Dessler, 2006). Due to their transient nature and complex morphology, the climate impacts of TTL cirrus are poorly understood (Stubenrauch et al., 2007). These clouds are also of interest because of their influence on dehydration
5
in the TTL and ultimately on stratospheric humidity (Gettelman et al., 2002; Jensen et al., 2001, 1996).
The formation of cirrus clouds in the TTL can be categorized into two different mecha-nisms: convection related generation, and in-situ formation (Pfister et al., 2001). Deep convective clouds with expanded anvil tops can have thin cirrus clouds detrain into
10
the TTL. In contrast, the formation of in-situ cirrus can occur away from convection when a cold temperature anomaly causes the air to become (super)saturated. The cold anomaly may be caused by any number of mechanisms, such as gravity waves (Pfister et al., 2001), Kelvin waves (Boehm and Verlinde, 2000), mid-latitude intrusions (Waugh and Polvani, 2000) and large scale uplift (Corti et al., 2006). On average, over
15
the equatorial region, sub-visible cirrus clouds occur 30 % of the time (Mace et al., 2009). Over the Western Pacific, where TTL cirrus most frequently occur (Wang et al., 1996), Massie et al. (2002) showed that half of the TTL cirrus are associated with deep convection while the other half are formed in-situ. Regardless of how TTL cirrus are formed, their vertical thickness is typically less than 1 km and their horizontal scale is
20
commonly less than 100 km (Massie et al., 2010).
Some TTL cirrus clouds have been seen with lifetimes as long as a few days (Winker and Trepte, 1998). The mechanism that is responsible for maintaining cirrus in the TTL for such a long period of time is not well understood. Boehm (1989) used a 2-D cloud resolving model to show that internal circulation is insufficient to maintain TTL cirrus
25
ACPD
11, 15745–15774, 2011Cirrus cloud-temperature
interactions
J. R. Taylor et al.
Title Page
Abstract Introduction
Conclusions References
Tables Figures
◭ ◮
◭ ◮
Back Close
Full Screen / Esc
Printer-friendly Version Interactive Discussion
Discussion
P
a
per
|
Dis
cussion
P
a
per
|
Discussion
P
a
per
|
Discussio
n
P
a
per
|
hypothesis and further suggest that adiabatic cooling assists in offsetting the induced diabatic warming. The dynamical model used by Durran et al. (2009) was extended by Dinh et al. (2010) to include ice microphysics (deposition growth, sublimation, and sedimentation). They showed that if TTL cirrus ice crystals are relatively small (radii
≤5 µm), then cloud radiative heating can generate a circulation with rising inside the
5
cloud, sinking outside the cloud, entrainment at cloud base, and detrainment at cloud top. Dinh et al. (2010) showed that this circulation can provide a water supply for the cloud and substantially extend the cloud lifetime. It should be noted that available observations suggest that TTL cirrus ice crystals are considerably larger than 5 µm (Lawson et al., 2008; Davis et al., 2010).
10
Radiative heating in TTL cirrus is a significant component in the TTL thermal budget (Corti et al., 2006; Yang et al., 2010). Radiative transfer calculations have shown that in the absence of underlying anvil cirrus, the radiative heating in TTL cirrus (dominated by infrared radiation) is a few K day−1 (Jensen et al., 1996; McFarquhar et al., 2000; Comstock et al., 2002). Direct observations of heating rates in TTL cirrus at≃13–15 km
15
with optical depths ranging from 0.01–0.1 (mean of 0.034) indicated values of about 2.5–3.2 K day−1, in good agreement with the calculated values (Bucholtz et al., 2010). Hartmann et al. (2001) showed that if thin TTL cirrus overlies optically thick anvil cirrus, the thin cirrus will radiatively cool the TTL. However, comparing satellite observations of isolated tropical cirrus with those that have underlying thick clouds showed that there
20
was not a significant difference in optical depths of the cirrus (Riihimaki and McFarlane, 2010). Consistent with these observations, Yang et al. (2010) showed that the effects of solar heating are minimal on TTL cirrus and infrared heating is dominant. The effects of radiation ultimately influence upwelling and troposphere-to-stratosphere transport and, consequently, stratospheric humidity (Corti et al., 2006).
25
ACPD
11, 15745–15774, 2011Cirrus cloud-temperature
interactions
J. R. Taylor et al.
Title Page
Abstract Introduction
Conclusions References
Tables Figures
◭ ◮
◭ ◮
Back Close
Full Screen / Esc
Printer-friendly Version Interactive Discussion
Discussion
P
a
per
|
Dis
cussion
P
a
per
|
Discussion
P
a
per
|
Discussio
n
P
a
per
|
Pacific in boreal winter. Satellite observations also show a large diurnal signal in TTL cloud occurrence, but this has little effect upon the low occurrence frequencies in the Eastern Pacific (Liu and Zipser, 2009).
Here we provide a case study of a clearly isolated, extensive cirrus cloud found in the TTL over the Eastern Pacific in a region devoid of deep convection in January
5
2009. We use CALIPSO observations to characterize the spatial and temporal extent of the cloud and its optical properties. Coincident high vertical resolution temperature observations from GPS radio occultation measurements are used to investigate the interaction between the cloud and background temperature field. Finally, these obser-vations are presented in the context of the current theoretical understanding of cirrus
10
physical properties and apparent inconsistencies are discussed.
2 Observations
Observations of cirrus clouds are provided by the Cloud-Aerosol Lidar with Orthogo-nal Polarisation (CALIOP) instrument on board the Cloud Aerosol Lidar and Infrared Pathfinder Satellite Observations (CALIPSO) satellite. These are combined with
tem-15
perature observations made by the Constellation of Observing Satellites for Meteo-rology, Ionosphere, and Climate (COSMIC) satellite system. Coincident observations made by these instruments elucidate details of cloud-temperature interaction in the TTL.
2.1 CALIPSO Data 20
The CALIPSO satellite mission was launched in April 2006 and is flying in formation with the A-train Constellation of Satellites (Stephens et al., 2002). This constellation is in a 705 km sun-synchronous polar orbit inclined at 98.2◦ which yields a 16 day repeat cycle (Winker et al., 2009). The local time of the observations is at 01:30 LT and 13:30 LT. The CALIOP instrument is a dual wavelength (532 nm and 1064 nm),
ACPD
11, 15745–15774, 2011Cirrus cloud-temperature
interactions
J. R. Taylor et al.
Title Page
Abstract Introduction
Conclusions References
Tables Figures
◭ ◮
◭ ◮
Back Close
Full Screen / Esc
Printer-friendly Version Interactive Discussion
Discussion
P
a
per
|
Dis
cussion
P
a
per
|
Discussion
P
a
per
|
Discussio
n
P
a
per
|
polarization-sensitive LIDAR with a near-nadir viewing geometry (Winker et al., 2007). Over the 8–20 km altitude range, the charge-coupled device detector is configured to observe a small footprint of≈1 km with a vertical resolution of≈60 m. For this study, the version 2.2 data product horizontally averaged into 5 km footprints is used (referred to as the 5km Cloud Layer product) (Vaughan et al., 2004). In this product, the vertical
5
cloud information is defined by cloud layer tops and bottoms only. The layer integrated attenuated backscatter is used to determine the optical depth of a given layer. Similarly, the layer integrated depolarization ratio is employed to determine the shape of the scattering particles and, consequently, assist in discriminating between phases in an observed cloud-layer. For example, a depolarization ratio of≈0.4 is indicative of
ice-10
phase clouds, such as high-level cirrus clouds in the TTL (Hu, 2007).
Cloud observations from CALIPSO have been used extensively to understand the cli-matology and statistics of cirrus clouds in the TTL (Fu et al., 2007; Mace et al., 2009). Furthermore, CALIPSO has been used in concert with other satellite sensors to suc-cessfully investigate specific case/process studies in the TTL (Takashima et al., 2010).
15
The 5 km Cloud Layer product has been used to distinguish between TTL cirrus clouds that are related to convection versus those that are isolated (Riihimaki and McFar-lane, 2010). Unfortunately, the limited spatial and temporal sampling of CALIPSO have proven challenging for observing single cirrus clouds as consecutive daytime/nighttime passes are separated by≈25◦longitude at the equator with a time difference of≈1.6 h
20
between orbits (Virts et al., 2010). Despite these limitations, CALIPSO cloud observa-tions can be combined with COSMIC temperature observaobserva-tions to provide sequential snapshots of cloud-temperature interactions.
2.2 COSMIC data
The COSMIC satellite system was launched in April 2006 as a joint project with the
25
re-ACPD
11, 15745–15774, 2011Cirrus cloud-temperature
interactions
J. R. Taylor et al.
Title Page
Abstract Introduction
Conclusions References
Tables Figures
◭ ◮
◭ ◮
Back Close
Full Screen / Esc
Printer-friendly Version Interactive Discussion
Discussion
P
a
per
|
Dis
cussion
P
a
per
|
Discussion
P
a
per
|
Discussio
n
P
a
per
|
ceiver that measures the phase delay of radio waves received from the constellation of GPS satellites as they are occulted by the Earth’s atmosphere. From this phase delay, high resolution vertical profiles of precise bending angles are obtained (Kuo et al., 2004). These bending angles are then converted to measurements of temperature in the stratosphere and temperature and water vapor in the troposphere (Kursinski et
5
al., 1997). The efficacy of this technique has previously been demonstrated by the CHAllenging Minisatellite Payload (CHAMP) (Wickert et al., 2001) and the Satellite de Aplicaciones Cientificas-C (SAC-C) (Hajj et al., 2004).
COSMIC observations are distributed around the globe with a temporal frequency as high as 2500 measurements/day (Schreiner et al., 2007). Because the occultations
10
are measured between the six microsatellites and the GPS constellation, the temporal sampling does not follow a regular pattern although the orbit results in a higher sam-pling at mid/high latitudes. In this study, the Dry Profile observations (referred to as “dryPrf” product) are used and provide accurate observations of temperature above 10 km (Wickert et al., 2004). Although the profiles are provided on a 200 m grid, the
15
vertical temperature resolution is closer to 1 km (Barnett et al., 2008). Comparisons
between COSMIC and radiosondes above 10 km have shown that the mean difference
in temperature observations is close-to-zero with virtually no day/night bias (He et al., 2009).
3 Results 20
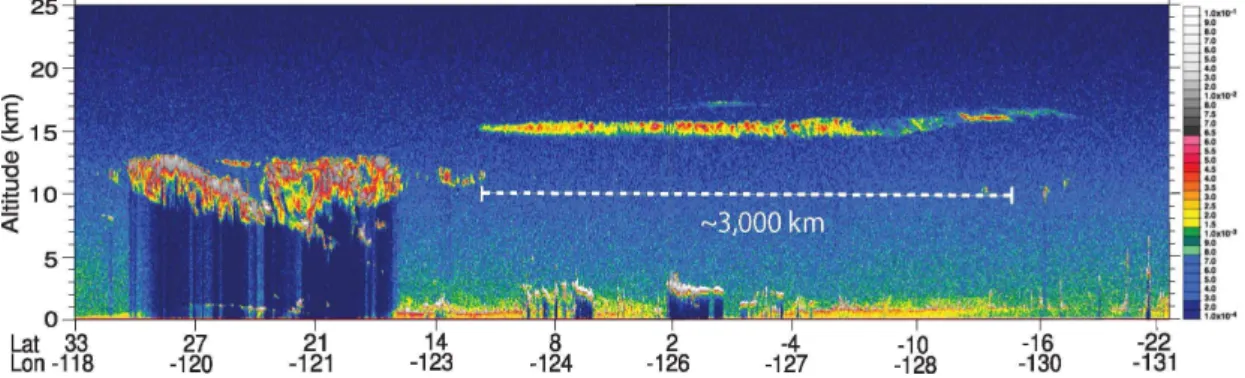
An isolated, horizontally extensive, and vertically thin cirrus cloud in the TTL was de-tected by CALIPSO on 27-29 January, 2009 in the Tropical Eastern Pacific region. At it’s most extensive, observations indicate that the cloud is close to 3000 km in length along the CALIPSO orbit track, extending from approximately 15◦S to 10◦N (see Fig. 1). Although the cloud vertical profile varies from orbit to orbit, the cloud
25
appears to only be≈500–700 m thick, extending from≈15–15.7 km altitude in Fig. 1.
ACPD
11, 15745–15774, 2011Cirrus cloud-temperature
interactions
J. R. Taylor et al.
Title Page
Abstract Introduction
Conclusions References
Tables Figures
◭ ◮
◭ ◮
Back Close
Full Screen / Esc
Printer-friendly Version Interactive Discussion
Discussion
P
a
per
|
Dis
cussion
P
a
per
|
Discussion
P
a
per
|
Discussio
n
P
a
per
|
the entire cloud, the integrated attenuated backscatter is nearly identical at both wave-lengths of the CALIOP LIDAR. This results in a color ratio of close to unity, which is expected for cirrus clouds composed of ice crystals much larger than the CALIOP ob-servation wavelengths (Tao et al., 2008). Similarly, the depolarization ratio is almost constant at 0.4, indicating that the cloud is comprised of ice-particles (Hu, 2007).
Al-5
though the optical depth varies across the cloud, it is primarily<0.1, confirming that this is indeed a thin cirrus cloud. Figure 2 does not show evidence of coherent small-scale spatial structure (e.g. wave-like activity) embedded within the 3000 km cirrus cloud.
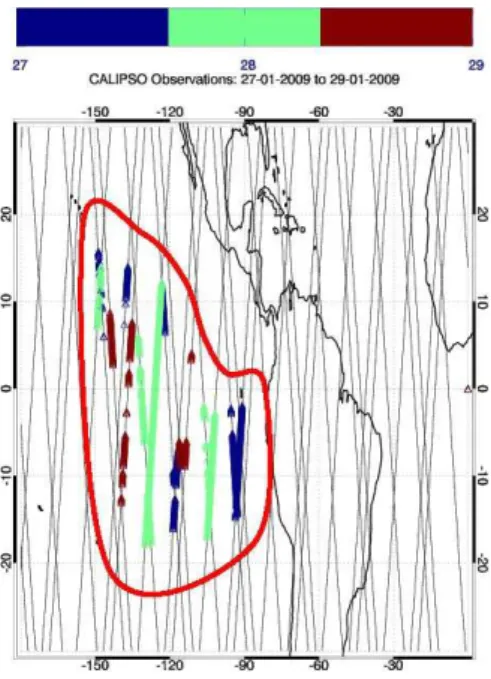
The observations from CALIPSO (snapshots along the orbital tracks) were used to identify the space-time structure of this extensive cirrus event. A compilation of
obser-10
vations over this three day period suggests that the cloud covers approximately 90◦W to 150◦W and have no underlying clouds in the 5–13 km range (see Fig. 3). Because there are no other observations of this area during this three day period, it is impossible to determine whether the cloud extends between all of the orbital tracks. As the obser-vations appear to not always be continuous along the tracks, it is likely that the optical
15
thickness of the cloud sufficiently decreases in some regions, resulting in a “patchy” appearance. It is also possible that the cloud may migrate toward the west with time, but this may merely be an artifact of the sparse sampling projected upon the evolution of the cloud.
The daily altitude distribution of the observations of this cloud over 27–29 January
20
2009 are shown in Fig. 4. CALIPSO along-track (5 km) observations are counted within 200 m vertical bins, with cloud counts in the Eastern Pacific between 90◦W to 150◦W and 20◦S to 15◦N totaling 1013, 1571, and 548 on 27, 28, and 29 Jan, 2009, re-spectively (i.e. the occurrences seen in Fig 4). The approximate peak altitudes of the normalized distributions are at 15.2 km, 15.4 km, and 16.0 km on 27, 28, and 29
25
ACPD
11, 15745–15774, 2011Cirrus cloud-temperature
interactions
J. R. Taylor et al.
Title Page
Abstract Introduction
Conclusions References
Tables Figures
◭ ◮
◭ ◮
Back Close
Full Screen / Esc
Printer-friendly Version Interactive Discussion
Discussion
P
a
per
|
Dis
cussion
P
a
per
|
Discussion
P
a
per
|
Discussio
n
P
a
per
|
these daily distributions could suggest that the cloud is slowly moving upward over its lifetime. However, an alternative explanation is that the lower portion of the cloud is slowly sedimenting over the course of the three day period, resulting in an apparent vertical shift and the altitude distribution becoming narrower.
To assist in understanding the evolution of this tropical cirrus cloud, coincident
obser-5
vations from COSMIC were used to monitor the background temperature conditions. Coincidences were defined as occurring on the same day within the same region of the Eastern Pacific: 90◦W to 150◦W and 20◦S to 15◦N (see Fig. 5). Due to the orbital geometry and configuration of the radio occultation measurements, COSMIC has an irregular sampling pattern that makes temporal coincidence definition difficult. As such,
10
all temperature observations within the region on a given day were included (there are typically 50 observations/day).
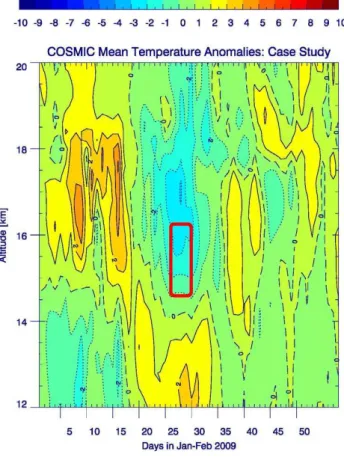
A height-time section of daily temperature anomalies observed within this region is shown in Fig. 6. Anomalies were determined by subtracting the monthly mean temper-ature profile within this region and then calculating the daily mean difference. Figure
15
6 shows a cold anomaly of approximately 2–3 K occurs from 25–31 January 2009, spanning altitudes 15–18 km, roughly coincident with the cloud occurrence. The 3 day duration of the observed cirrus cloud lies in the middle for this 6 day cold anomaly and is consistent with the timing of the coldest temperatures. It is of interest to note that the cloud appears at 15–15.5 km altitude, while anomalies at the cold point (≈17 km)
20
are 2 K colder than at this altitude. It is also interesting to note that the temperatures directly below the cloud (14 km and lower) are anomalously warm and are likely tied to the dynamical structure of the event (as discussed below).
The longitudinal distribution of daily-mean temperature anomalies on 28 January (see Fig. 7) confirms the localized nature of this anomaly. The cold anomaly is
re-25
ACPD
11, 15745–15774, 2011Cirrus cloud-temperature
interactions
J. R. Taylor et al.
Title Page
Abstract Introduction
Conclusions References
Tables Figures
◭ ◮
◭ ◮
Back Close
Full Screen / Esc
Printer-friendly Version Interactive Discussion
Discussion
P
a
per
|
Dis
cussion
P
a
per
|
Discussion
P
a
per
|
Discussio
n
P
a
per
|
highlights that the cold temperature anomalies in the Eastern Pacific (90◦W to 130◦W are linked with patterns in the subtropics; note the minimum near 15◦S). This behaviour is distinct from centered temperature anomalies linked to equatorially-trapped waves, such as the Kelvin wave pattern seen over longitudes ≈0◦–120◦E in
Figs. 7–8 (Randel and Wu, 2005, e.g.). The overall latitudinal and vertical structure of
5
the Eastern Pacific temperature anomalies is more consistent with an intrusion from the Southern Hemisphere subtropics which is consistent with the associated potential vorticity patterns derived from NCEP reanalysis (figures not shown). The associated temperature anomalies extend across the equator and fill the Eastern Pacific region of investigation. Intrusions of this nature are not uncommon in this region and typically
10
persist for 5–6 days, consistent with the observed cold period (Waugh and Polvani, 2000).
Circulation in this region was further investigated using NCEP reanalysis. The evo-lution of 150 hPa winds (the approximate pressure level of the cloud) during the six day cold period indicate that this region was essentially stagnant at this time. Calculated
15
trajectories of air parcels within the cloud observed on 28 January 2009 (see Fig. 1) were seen to only move≈200 km over 2 days. The only fresh air that comes into this region is at the extreme southern end of the cloud; south of≈17◦S. In Fig. 1, this por-tion of the cloud is somewhat different from the rest of the cloud, possibly due to the in-mixing of fresh air.
20
4 Discussion
We hypothesize that the cloud must have formed in situ when the midlatitude intrusion generated a large cold anomaly in the Eastern Pacific TTL. The decrease in tempera-ture caused the air in this region to become supersaturated and the cirrus cloud formed. This is consistent with the coldest temperatures, and longest anomaly, occurring
coin-25
ACPD
11, 15745–15774, 2011Cirrus cloud-temperature
interactions
J. R. Taylor et al.
Title Page
Abstract Introduction
Conclusions References
Tables Figures
◭ ◮
◭ ◮
Back Close
Full Screen / Esc
Printer-friendly Version Interactive Discussion
Discussion
P
a
per
|
Dis
cussion
P
a
per
|
Discussion
P
a
per
|
Discussio
n
P
a
per
|
which is consistent with the statistical behavior of clouds in this region (Fueglistaler, 2009). The lower altitude of the cloud is consistent with the COSMIC temperature anomalies (Figs. 6–7), while the mechanism limiting the cloud thickness is uncertain (although likely linked to the vertical structure of water vapour in this region). The apparent vertical motion suggested in Fig. 4 may simply be an artifact caused by
sed-5
imentation/sublimation at lower altitudes and higher altitude variations near the 0.003 optical depth sensitivity threshold of CALIPSO. Perhaps most surprising is the lack of observed temperature perturbation associated with the cloud (i.e. a lack of warm-ing in the cloud layer). The anticipated heatwarm-ing rates of 2–3 K/day (Hartmann et al., 2001) produce no observable signature in the COSMIC temperature timeseries,
ver-10
tical structure, or horizontal field (although close coincidences in space and time are limited by the CALIPSO and COSMIC observations).
To the best of the authors’ knowledge, a cirrus cloud of this extent and duration has never been observed before. Previous observations have found thin tropical cirrus clouds with an extent as large as 1000 km (Winker and Trepte, 1998) and an area
15
as large as 100 000 km2 (Peter et al., 2003), but nothing near as large as the cloud investigated here. Cirrus clouds in the TTL have estimated average lifetimes of≈12 h
(Jensen et al., 2011) and, even the most exceptional cases, only last up to 40 h (Luo and Rossow, 2004). The primary limitations on cloud lifetime are TTL temperature variability and the rate of ice crystal sedimentation into subsaturated air.
20
There are two hypotheses that can potentially explain the long lifetime of this cloud: (1) the cooling caused by the midlatitude intrusion could result in the formation of small ice crystals with exceptionally low fall speeds, or (2) the cloud region is in a state of dynamic flux in which there is continuous or sporadic generation of new ice crystals that subsequently grow and sediment through the cold layer. The first hypothesis can
25
ACPD
11, 15745–15774, 2011Cirrus cloud-temperature
interactions
J. R. Taylor et al.
Title Page
Abstract Introduction
Conclusions References
Tables Figures
◭ ◮
◭ ◮
Back Close
Full Screen / Esc
Printer-friendly Version Interactive Discussion
Discussion
P
a
per
|
Dis
cussion
P
a
per
|
Discussion
P
a
per
|
Discussio
n
P
a
per
|
r= s
τ
No∆zQeπ, (1)
wherer is the ice crystal effective radius, τ is the cloud optical depth,No is the num-ber concentration,Qeis the extinction efficiency, and∆z is the vertical cloud thickness (Comstock et al., 2002). For the small crystals likely to exist in optically thin cirrus, sed-imentation speed can be calculated from the Stokes equation (Pruppacher and Klett,
5
1997). Assuming an average optical depth of 0.1 and a constant extinction efficiency of 2, the average ice crystal radii, fall speeds, and estimated fall times for various number concentrations are shown in Tables 1 and 2. For conditions with high number con-centration and small effective radii, ice crystals have a residence time as large as 53 h for a 700 m thick cloud and 27 h for a 500 m thick cloud. The temperature anomalies
10
shown in Fig. 6 suggests that the onset of cooling was rapid in this region. Such high ice concentrations could be produced by homogeneous freezing of aqueous sulfate aerosols if the cooling is sufficiently rapid (Karcher and Lohmann, 2002). Based on the vertical thickness of the cloud shown in Fig. 1, it is plausible that the ice crystals are sufficiently small to result in residence times of over 2 days. Given the limitations of the
15
observations, it is challenging to quantitatively address the second hypothesis; in all likelihood, there is some degree of dynamic flux achieved over a portion of this region. Alternative hypotheses require some form of sustained vertical motion to maintain the cloud at this altitude. Recent results from a three dimensional cloud-resolving model show that low thermal stability (N2<0.009) allows the radiative heating to
in-20
duce sufficient small-scale convection to maintain the cloud at a persistent high alti-tude (Jensen et al., 2011). Although conditions of low thermal stability do occur in the TTL, it is near-impossible to have uniformly low stability throughout this entire region of the Eastern Pacific. Results from a column model used to simulate conditions for extensive clouds observed in the Indian Ocean showed that an upwelling of≈5 mm/s
25
ACPD
11, 15745–15774, 2011Cirrus cloud-temperature
interactions
J. R. Taylor et al.
Title Page
Abstract Introduction
Conclusions References
Tables Figures
◭ ◮
◭ ◮
Back Close
Full Screen / Esc
Printer-friendly Version Interactive Discussion
Discussion
P
a
per
|
Dis
cussion
P
a
per
|
Discussion
P
a
per
|
Discussio
n
P
a
per
|
shift as apparent upward motion of the cloud because the altitude distribution varies from orbit to orbit and, even for small ice crystals (a few microns), the sedimentation speed is comparable to updraft speeds. While this value is consistent with the pro-posed mechanism for cloud maintenance, it is unlikely that upwelling would occur in this region. The downward portion of the Walker Cell dominates the large-scale
cir-5
culation over the Eastern Pacific and clear sky radiative heating calculations suggest near-zero vertical motion near 15 km (Yang et al., 2010, e.g.).
While the first hypothesis of small ice-crystals having a long residence time may explain the long duration of the cloud, it does not address the lack of temperature perturbation that would be expected from longwave heating. As the trajectory analysis
10
indicates that the horizontal winds are nearly stagnant over this region, there is no obvious source of fresh moisture to stimulate the growth of new ice crystals. Therefore, some mechanism must be responsible for inhibiting sedimentation into subsaturated air below. If the apparent vertical shift in the cloud is due to sustained upwelling, this would not only inhibit sedimentation, it would mean that the cloud would move through a
15
background average temperature of≈200 K at 15 km to≈195 K at 16 km. This change of 5 K could be central to masking a longwave heating signal.
While there are a number of caveats associated with this speculation (the limited sensitivity of CALIPSO, the imprecision of the altitude distributions, the notion of large-scale sustained upwelling in the TTL over the Eastern Pacific), this hypothesis does
20
provide a plausible explanation for the 2–3 day lifetime of the cloud and the lack of response in the temperature field.
5 Conclusions
A midlatitude intrusion generated an anomalously cold region in the tropical tropopause layer over the Eastern Pacific on 26–31 January 2009. In this region, which is
charac-25
ACPD
11, 15745–15774, 2011Cirrus cloud-temperature
interactions
J. R. Taylor et al.
Title Page
Abstract Introduction
Conclusions References
Tables Figures
◭ ◮
◭ ◮
Back Close
Full Screen / Esc
Printer-friendly Version Interactive Discussion
Discussion
P
a
per
|
Dis
cussion
P
a
per
|
Discussion
P
a
per
|
Discussio
n
P
a
per
|
of order 1 km thick in the area covering 90◦W to 150◦W and 20◦S to 15◦N over an al-titude of≈15–15.5 km. The CALIOP LIDAR on board the CALIPSO satellite indicated that the cirrus cloud is composed of ice-particles and varied in optical depth between
≈0.003 and≈0.21. Over the two-three day lifetime of the cloud, the altitude distribution
changes and the peak altitude appears to ascend from 15.2 km to 16.0 km. Although
5
isolated TTL cirrus typically have calculated heating rates close to 3 K/day, coincident observations made by the COSMIC satellite system do not reveal any associated per-turbation in the temperature field.
The lifetime of TTL cirrus clouds is typically≈12 h and is limited by ice-crystal growth and sedimentation into subsaturated air below the cloud layer. The cloud described
10
here persists in the TTL for ≈2 days with no sign of sedimentation or descent. The mechanism responsible for maintaining the cloud over this large area for so long is not well understood. A previously proposed mechanism for maintaining long-lived cirrus relies on sustained vertical upwelling of≈5 mm/s, a value that is consistent with the observed change in altitude distributions. Furthermore, the change in altitude
coin-15
cides with a background temperature change of≈5 K, which could mask the
temper-ature perturbation that would be expected from cloud-induced heating. Although this provides a consistent explanation of the observations, it is unlikely to be realistic as the calculated clear-sky vertical velocity around 15 km is near zero.
This case study provides an important test of microphysics models and our
under-20
standing of cirrus cloud physics. Unfortunately, precise measurements of vertical up-welling are not available for correlative comparison. Without access to more details, these curious observations await further investigation.
Acknowledgements. The authors wish to thank the CALIPSO and COSMIC Science Teams for providing cloud and temperature data, respectively. We also thank Charles Bardeen, Steven
25
ACPD
11, 15745–15774, 2011Cirrus cloud-temperature
interactions
J. R. Taylor et al.
Title Page
Abstract Introduction
Conclusions References
Tables Figures
◭ ◮
◭ ◮
Back Close
Full Screen / Esc
Printer-friendly Version Interactive Discussion
Discussion
P
a
per
|
Dis
cussion
P
a
per
|
Discussion
P
a
per
|
Discussio
n
P
a
per
|
References
Anthes, R. A., Bernhardt, P. A., Chen, Y., Cucurull, L., Dymond, K. F., Ector, D., Healy, S. B., Ho, S.-P., Hunt, D. C., Kuo, Y.-H., Liu, H., Manning, K., McCormick, C., Meehan, T. K., Randel, W. J., Rocken, C., Schreiner, W. S., Sokolovskiy, S. V., Syndergaard, S., Thompson, D. C., Trenberth, K. E., Wee, T.-K., Yen, N. L., and Zeng, Z.:The COSMIC/FORMOSAT-3
5
Mission: Early Results, B. Am. Meteorol. Soc., 89, 313–333, doi:10.1175/BAMS-89-3-313, 2008. 15750
Barnett, J. J., Hepplewhite, C. L., Osprey, S., Gille, J. C., and Khosravi, R.: Cross-validation of HIRDLS and COSMIC radio-occultation retrievals, particularly in relation to fine vertical structure, Proc. SPIE Int. Soc. Opt. Eng., 7802, doi:10.1117/12.800702, 2008. 15751
10
Boehm, H. P.: A general equation for the terminal fall speed of solid hydrometeors, J. Atmos. Sci., 46(15), 2419–2427, 1989. 15747
Boehm, M. T. and Verlinde, J.: Stratospheric influence on upper tropospheric tropical cirrus, Geophys. Res. Lett., 27(19), 3209–3212, 2000. 15747
Bucholtz, A., Hlavka, D. L., McGill, M. J., Schmidt, K. S., Pilewskie, P., Davis, S. M., Reid, E.
15
A., and Walker, A. L.: Directly measured heating rates of a tropical subvisible cirrus cloud, J. Geophys. Res., 115, D00J09, doi:10.1029/2009JD013128, 2010. 15748
Comstock, J. M., Ackerman, T. P., and Mace, G. G.: Ground-based lidar and radar remote sensing of tropical cirrus clouds at Nauru Island: cloud statistics and radiative impacts, J. Geophys. Res., 107(D23), 4714, doi:.10.1029/2002JD002203, 2002. 15748, 15756
20
Corti, T., Luo, B. P., Fu, Q., Vmel, H., and Peter, T.: The impact of cirrus clouds
on tropical troposphere-to-stratosphere transport, Atmos. Chem. Phys., 6, 2539–2547, doi:10.5194/acp-6-2539-2006, 2006. 15747, 15748
Davis, S., Hlavka, D., Jensen, E., Rosenlof, K., Yang, Q., Schmidt, S., Borrmann, S., Frey, W., Lawson, P., Voemel, H., and Bui, T. P.: In situ and lidar observations of tropopause
subvis-25
ible cirrus clouds during TC4, J. Geophys. Res., 115, D00J17, doi:10.1029/2009JD013093, 2010. 15748
Dinh, T. P., Durran, D. R., and Ackerman, T.: The maintenance of tropical tropopause layer cirrus, J. Geophys. Res., 115, D02104, doi:10.1029/2009JD012735, 2010. 15748
Durran, D. R., Dinh, T. P., Ammerman, M., and Ackerman, T.: The mesoscale dynamics of thin
30
tropical tropopause cirrus, J. Atmos. Sci., 66, 2859–2873, 2009. 15747, 15748
ACPD
11, 15745–15774, 2011Cirrus cloud-temperature
interactions
J. R. Taylor et al.
Title Page
Abstract Introduction
Conclusions References
Tables Figures
◭ ◮
◭ ◮
Back Close
Full Screen / Esc
Printer-friendly Version Interactive Discussion
Discussion
P
a
per
|
Dis
cussion
P
a
per
|
Discussion
P
a
per
|
Discussio
n
P
a
per
|
mass flux analysis and CALIPSO lidar cloud observations, Geophys. Res. Lett., 34, L14813, doi:10.1029/2007GL030099, 2007. 15748, 15750
Fueglistaler, S., Dessler, A. E., Dunkerton, T. J., Folkins, I., Fu, Q., and Mote, P. W.: Tropical tropopause layer, Rev. Geophys., 47, RG1004, doi:10.1029/2008RG000267, 2009. 15746, 15755
5
Gettelman, A., Randel, W. J., Wu, F., and Massie, S. T.: Transport of water vapor in the tropical tropopause layer, Geophys. Res. Lett., 29(01), 1009, doi:10.1029/2001GL013818, 2002. 15747
Hartmann, D. L., Holton, J. R., and Fu, Q.: The heat balance of the tropical
tropopause, cirrus, and stratospheric dehydration, Geophys. Res. Lett., 28(10), 1969,
10
doi:10.1029/2000GL012833, 2001. 15748, 15755
Hajj, G. A., Ao, C. O., Iijima, B. A., Kuang, D., Kursinski, E. R., Mannucci, A. J., Mee-han, T. K., Romans, L. J., de la Torre Juarez, M., and Yunck, T. P.: CHAMP and SAC-C atmospheric occultation results and intercomparisons, J. Geophys. Res., 109, D06109, doi:10.1029/2003JD003909, 2004. 15751
15
He, W., Ho, S.-P., Chen, H., Zhou, X., Hunt, D., and Kuo, Y.-H.: Assessment of radiosonde temperature measurements in the upper troposphere and lower stratosphere using COSMIC radio occultation data, Geophys. Res. Lett., 36, L17807, doi:10.1029/2009GL038712, 2009. 15751
Hoskins, B. J., McIntyre, M. E., and Robertson, A. W.: On the use and significance of isentropic
20
potential vorticity maps, Q. J. Roy. Meteorol. Soc., 111, 877–946, 1985. 15753
Hu, Y.: Depolarization ratioeffective lidar ratio relation: Theoretical basis for space lidar cloud phase discrimination, Geophys. Res. Lett., 34, L11812, doi:10.1029/2007GL029584, 2007. 15750, 15752
Jensen, E., Toon, O., Selkirk, H., Spinhirne, J., and Schoeberl, M.: On the formation and
persis-25
tence of subvisible cirrus clouds near the tropical tropopause, J. Geophys. Res., 101(D16), 21361–21375, 1996. 15747, 15748
Jensen, E., Pfister, L., Ackerman, A., Tabazadeh, A., and Toon, O.: A conceptual model of the dehydration of air due to freeze-drying by optically thin, laminar cirrus rising slowly across the tropical tropopause, J. Geophys. Res., 106(D15), 17237–17252, 2001. 15747
30
ACPD
11, 15745–15774, 2011Cirrus cloud-temperature
interactions
J. R. Taylor et al.
Title Page
Abstract Introduction
Conclusions References
Tables Figures
◭ ◮
◭ ◮
Back Close
Full Screen / Esc
Printer-friendly Version Interactive Discussion
Discussion
P
a
per
|
Dis
cussion
P
a
per
|
Discussion
P
a
per
|
Discussio
n
P
a
per
|
2011. 15755, 15756
Karcher, B. and Lohmann, U.: A parameterization of cirrus cloud formation:
Ho-mogeneous freezing of supercooled aerosols, J. Geophys. Res., 107(D2), 4010, doi:10.1029/2001JD000470, 2002. 15756
Kuo, Y.-H, Wee, T. K., Sokolovskiy, S., Rocken, C., Schreiner, W., Hunt, D., and Anthes, R.:
In-5
version and Error Estimation of GPS Radio Occultation Data, J. Meteorol. Soc. Jpn., 82(1B), 507–531, 2004. 15751
Kursinski, E., Hajj, G., Schofield, J., Linfield, R., and Hardy, K.: Observing Earth’s atmosphere with radio occultation measurements using the Global Positioning System, J. Geophys. Res., 102(D19), 23429–23465, 1997. 15751
10
Lawson, R. P., Pilson, B., Baker, B., Mo, Q., Jensen, E., Pfister, L., and Bui, P.: Aircraft mea-surements of microphysical properties of subvisible cirrus in the tropical tropopause layer, Atmos. Chem. Phys., 8, 1609–1620, doi:10.5194/acp-8-1609-2008, 2008. 15748
Lilly, D.: Cirrus outflow dynamics, J. Atmos. Sci., 45(10), 1594–1605, 1988. 15747
Liu, C. and Zipser, E. J.: Implications of the day versus night differences of water vapor, carbon
15
monoxide, and thin cloud observations near the tropical tropopause, J. Geophys. Res., 114, D09303, doi:10.1029/2008JD011524, 2009. 15749
Luo, B. P., Peter, Th., Wernli, H., Fueglistaler, S., Wirth, M., Kiemle, C., Flentje, H., Yushkov, V. A., Khattatov, V., Rudakov, V., Thomas, A., Borrmann, S., Toci, G., Mazzinghi, P., Beuer-mann, J., Schiller, C., Cairo, F., Di Don-Francesco, G., Adriani, A., Volk, C. M., Strom, J.,
20
Noone, K., Mitev, V., MacKenzie, R. A., Carslaw, K. S., Trautmann, T., Santacesaria, V., and Stefanutti, L.: Ultrathin Tropical Tropopause Clouds (UTTCs): II. Stabilization mechanisms, Atmos. Chem. Phys., 3, 1093–1100, doi:10.5194/acp-3-1093-2003, 2003. 15756
Luo, Z. and Rossow, W. B.: Characterizing Tropical Cirrus Life Cycle, Evolution, and Interac-tion with Upper-Tropospheric Water Vapor Using Lagrangian Trajectory Analysis of Satellite
25
Observations, J. Clim., 17, 4541-4563, 2004. 15755
Mace, G. G., Zhang, Q., Vaughan, M., Marchand, R., Stephens, G., Trepte, C., and Winker, D.: A description of hydrometeor layer occurrence statistics derived from the first year of merged Cloudsat and CALIPSO data, J. Geophys. Res., 114, D00A26, doi:10.1029/2007JD009755, 2009. 15747, 15750
30
ACPD
11, 15745–15774, 2011Cirrus cloud-temperature
interactions
J. R. Taylor et al.
Title Page
Abstract Introduction
Conclusions References
Tables Figures
◭ ◮
◭ ◮
Back Close
Full Screen / Esc
Printer-friendly Version Interactive Discussion
Discussion
P
a
per
|
Dis
cussion
P
a
per
|
Discussion
P
a
per
|
Discussio
n
P
a
per
|
Massie, S. T., Gille, J., Craig, C., Khosravi, R., Barnett, J., Read, W., and Winker, D.: HIRDLS and CALIPSO observations of tropical cirrus, J. Geophys. Res., 115, D00H11, doi:10.1029/2009JD012100, 2010. 15747
McFarquhar, G. M., Heymsfield, A. J., Spinhirne, J., and Hart, W.: Thin and subvisual tropopause tropical cirrus: observations and radiative effects, J. Atmos. Sci., 57(12), 1841–
5
1853, 2000. 15748
Peter, Th., Luo, B. P., Wirth, M., Kiemle, C., Flentje, H., Yushkov, V. A., Khattatov, V., Rudakov, V., Thomas, A., Borrmann, S., Toci, G., Mazzinghi, P., Beuermann, J., Schiller, C., Cairo, F., Di Donfrancesco, G., Adriani, A., Volk, C. M., Strom, J., Noone, K., Mitev, V., MacKenzie, R. A., Carslaw, K. S., Trautmann, T., Santacesaria, V., and Stefanutti, L.: Ultrathin Tropical
10
Tropopause Clouds (UTTCs): I. Cloud morphology and occurrence, Atmos. Chem. Phys., 3, 1083–1091, doi:10.5194/acp-3-1083-2003, 2003. 15755
Pfister, L., Selkirk, H. B., Jensen, E. J., Schoeberl, M. R., Toon, O. B., Browell, E. V., Grant, W. B., Gary, B., Mahoney, M. J., Bui, T. V., and Hintsa, E.: Aircraft observations of thin cirrus clouds near the tropical tropopause. J. Geophys. Res., 106(D9), 9765–9786,
15
doi:10.1029/2000JD900648, 2001. 15747
Pruppacher, H. R. and Klett, J. D.: Microphysics of Clouds and Precipitation, 2d ed. Kluwer Academic, 1997. 15756
Randel, W. J. and Wu, F.: Kelvin wave variability near the equatorial tropopause
ob-served in GPS radio occultation measurements, J. Geophys. Res., 110, D03102,
20
doi:10.1029/2004JD005006, 2005. 15754
Riihimaki, L. D. and McFarlane, S. A.: Frequency and morphology of tropical tropopause layer cirrus from CALIPSO observations: Are isolated cirrus different from those connected to deep convection?, J. Geophys. Res., 115, D18201, doi:10.1029/2009JD013133, 2010. 15748, 15750
25
Robinson, G. D.: The transport of minor atmospheric constituents between troposphere and stratosphere, Q. J. Roy. Meteorol. Soc., 106, 227-253. doi:10.1002/qj.49710644802, 1980. 15746
Sassen, K. and Cho, B. S.: Subvisual-Thin Cirrus Lidar Dataset for Satellite Verification and Cli-matological Research, J. Appl. Meteorol., 31, 1275-1285, doi:10.1175/1520-0450(1992)031,
30
1992. 15747
ACPD
11, 15745–15774, 2011Cirrus cloud-temperature
interactions
J. R. Taylor et al.
Title Page
Abstract Introduction
Conclusions References
Tables Figures
◭ ◮
◭ ◮
Back Close
Full Screen / Esc
Printer-friendly Version Interactive Discussion
Discussion
P
a
per
|
Dis
cussion
P
a
per
|
Discussion
P
a
per
|
Discussio
n
P
a
per
|
2009. 15748
Schreiner, W., Rocken, C., Sokolovskiy, S., Syndergaard, S., and Hunt, D.: Estimates of the pre-cision of GPS radio occultations from the COSMIC/FORMOSAT-3 mission, Geophys. Res. Lett., 34, L04808, doi:10.1029/2006GL027557, 2007. 15751
Stephens, G., Vane, D. G., Boain, R. J., Mace, G. G., Sassen, K., Wang, Z., Illingworth, A.
5
J., OConnor, E. J., Rossow,W. B., Durden, S. L., Miller, S. D., Austin, R. T., Benedetti, A., Mitrescu, C., and the CloudSat Science Team: The CLOUDSAT Mission and the A-Train: A New Dimension of Space-Based Observations of Clouds and Precipitation, B. Am. Meteorol. Soc., 83, 1771–1790, doi:10.1175/BAMS-83-12-1771, 2002. 15749
Stubenrauch, C. J., Eddounia, F., Edwards, J. M., and Macke, A: Evaluation of Cirrus
Parame-10
terizations for Radiative Flux Computations in Climate Models Using TOVSScaRaB Satellite Observations, J. Climate, 20, 4459-4475, 2007. 15747
Takashima, H., Eguchi, N., and Read W.’: A short-duration cooling event around the
tropical tropopause and its effect on water vapor, Geophys. Res. Lett., 37, L20804,
doi:10.1029/2010GL044505, 2010. 15750
15
Tao, Z., McCormick, M. P., Wu, D., Liu, Z., and Vaughan, M. A.: Measurements of cirrus cloud backscatter color ratio with a two-wavelength lidar, Appl. Opt., 47, 1478–1485, 2008. 15752 Vaughan, M. A., Young, S. A., Winker, D. M., Powell, K. A., Omar, A. H., Liu, Z., Hu, Y., and Hostetler, C. A.: Fully automated analysis of space-based lidar data: An overview of the CALIPSO retrieval algorithms and data products, Proc. SPIE Int. Soc. Opt. Eng., 5575,
20
doi:10.1117/12.572024, 2004. 15750
Virts, K. S., Wallace, J. M., Fu, Q., and Ackerman, T. P.: Tropical Tropopause Transition Layer Cirrus as Represented by CALIPSO Lidar Observations, J. Atmos. Sci., 67(10), 3113–3129, doi:10.1175/2010JAS3412, 2010. 15750
Wang, L. and Dessler, A. E.: Instantaneous cloud overlap statistics in the tropical area revealed
25
by ICESat/GLAS data, Geophys. Res. Lett., 33, L15804, doi:10.1029/2005GL024350, 2006. 15747
Wang, P.-H., Minnis, P., McCormick, M. P., Kent, G. S., and Skeens, K. M.: A 6-year climatology of cloud occurrence frequency from Stratospheric Aerosol and Gas Experiment II obser-vations (1985–1990), J. Geophys. Res., 101(D23), 29407-29429, doi:10.1029/96JD01780,
30
1996. 15747
ACPD
11, 15745–15774, 2011Cirrus cloud-temperature
interactions
J. R. Taylor et al.
Title Page
Abstract Introduction
Conclusions References
Tables Figures
◭ ◮
◭ ◮
Back Close
Full Screen / Esc
Printer-friendly Version Interactive Discussion
Discussion
P
a
per
|
Dis
cussion
P
a
per
|
Discussion
P
a
per
|
Discussio
n
P
a
per
|
Winker, D. M. and Trepte, C. R.: Laminar cirrus observed near the tropical tropopause by LITE, Geophys. Res. Lett., 25(17), 3351–3354, 1998. 15746, 15747, 15755
Winker, D. M., Hunt, W. H., and McGill, M. J.: Initial performance assessment of CALIOP, Geophys. Res. Lett., 34, L19803, doi:10.1029/2007GL030135, 2007. 15750
Winker, D. M., Vaughan, M. A., Omar, A., Hu, Y., Powell, K. A., Liu, Z., Hunt, W. H., and Young,
5
S. A., Overview of the CALIPSO Mission and CALIOP Data Processing Algorithms, J. Atmos. Ocean. Technol., 26(11), 2310–2323, doi:10.1175/2009JTECHA1281.1, 2009. 15749 Wickert, J., Reigber, C., Beyerle, G., Konig, R., Marquardt, C., Schmidt T., Grunwaldt L., Galas
R., Meehan, T. K., Melbourne, W. G., and Hocke, K.: Atmosphere sounding by GPS radio occultation: First results from CHAMP, Geophys. Res. Lett., 28(17), 3263–3266, 2001. 15751
10
Wickert, Schmidt, T., Beyerle, G., K ¨onig, R., Reigber, C., and Jakowski, N.: The radio oc-cultation experiment aboard CHAMP: Operational data analysis and validation of vertical atmospheric profiles, J. Meteor. Soc. Jpn., 82(1B), 381–395, 2004. 15751
Yang, Q., Fu, Q., and Hu, Y.: Radiative impacts of clouds in the tropical tropopause layer, J. Geophys. Res., 115, D00H12, doi:10.1029/2009JD012393, 2010. 15748, 15757
ACPD
11, 15745–15774, 2011Cirrus cloud-temperature
interactions
J. R. Taylor et al.
Title Page
Abstract Introduction
Conclusions References
Tables Figures
◭ ◮
◭ ◮
Back Close
Full Screen / Esc
Printer-friendly Version Interactive Discussion
Discussion
P
a
per
|
Dis
cussion
P
a
per
|
Discussion
P
a
per
|
Discussio
n
P
a
per
|
Table 1.Estimates of effective ice crystal radius (r), subsequent fall speeds (vo), and the time required to fall through the thickness of the cloudt∆z. Calculations are made for three different number concentrations (No) and assume a cloud thickness (∆z) of 700 m.
No[number/cm3] r[µm] vo[cm/s] t∆z [hours]
0.1 15 3.5 5.6
0.4 7.5 0.92 21
ACPD
11, 15745–15774, 2011Cirrus cloud-temperature
interactions
J. R. Taylor et al.
Title Page
Abstract Introduction
Conclusions References
Tables Figures
◭ ◮
◭ ◮
Back Close
Full Screen / Esc
Printer-friendly Version Interactive Discussion
Discussion
P
a
per
|
Dis
cussion
P
a
per
|
Discussion
P
a
per
|
Discussio
n
P
a
per
|
Table 2.Same as Table 1 but for a cloud thickness (∆z) of 500 m.
No[number/cm3] r[µm] vo[cm/s] t∆z [hours]
0.1 17 4.5 3.1
0.4 8.9 1.3 11
ACPD
11, 15745–15774, 2011Cirrus cloud-temperature
interactions
J. R. Taylor et al.
Title Page
Abstract Introduction
Conclusions References
Tables Figures
◭ ◮
◭ ◮
Back Close
Full Screen / Esc
Printer-friendly Version Interactive Discussion
Discussion
P
a
per
|
Dis
cussion
P
a
per
|
Discussion
P
a
per
|
Discussio
n
P
a
per
|
Fig. 1. Extensive cirrus cloud observed by CALIPSO on 28 January 2009 at approximately
ACPD
11, 15745–15774, 2011Cirrus cloud-temperature
interactions
J. R. Taylor et al.
Title Page
Abstract Introduction
Conclusions References
Tables Figures
◭ ◮
◭ ◮
Back Close
Full Screen / Esc
Printer-friendly Version Interactive Discussion
Discussion
P
a
per
|
Dis
cussion
P
a
per
|
Discussion
P
a
per
|
Discussio
n
P
a
per
|
Fig. 2. Variation of the cirrus cloud parameters retrieved from CALIPSO at 15.5 km, for the
ACPD
11, 15745–15774, 2011Cirrus cloud-temperature
interactions
J. R. Taylor et al.
Title Page
Abstract Introduction
Conclusions References
Tables Figures
◭ ◮
◭ ◮
Back Close
Full Screen / Esc
Printer-friendly Version Interactive Discussion
Discussion
P
a
per
|
Dis
cussion
P
a
per
|
Discussion
P
a
per
|
Discussio
n
P
a
per
|
Fig. 3. The horizontal extent of the isolated TTL cirrus cloud over 27–29 January 2009.
Col-ors indicate the presence of a cirrus cloud over altitudes 13–18 km, with no clouds from 5– 13 km. Blue, green,and red symbols represent observations on the 27, 28, and 29 January, respectively. The cloud shown in Figs. 1 and 2 can be seen in the middle of the region (long, continuous, green track), extending continuously from≈15◦
ACPD
11, 15745–15774, 2011Cirrus cloud-temperature
interactions
J. R. Taylor et al.
Title Page
Abstract Introduction
Conclusions References
Tables Figures
◭ ◮
◭ ◮
Back Close
Full Screen / Esc
Printer-friendly Version Interactive Discussion
Discussion
P
a
per
|
Dis
cussion
P
a
per
|
Discussion
P
a
per
|
Discussio
n
P
a
per
|
Fig. 4. Normalized distribution of cloud altitudes detected by CALIPSO in the Eastern Pacific
ACPD
11, 15745–15774, 2011Cirrus cloud-temperature
interactions
J. R. Taylor et al.
Title Page
Abstract Introduction
Conclusions References
Tables Figures
◭ ◮
◭ ◮
Back Close
Full Screen / Esc
Printer-friendly Version Interactive Discussion
Discussion
P
a
per
|
Dis
cussion
P
a
per
|
Discussion
P
a
per
|
Discussio
n
P
a
per
|
Fig. 6.Timeseries of daily mean temperature anomalies observed by COSMIC within the area
ACPD
11, 15745–15774, 2011Cirrus cloud-temperature
interactions
J. R. Taylor et al.
Title Page
Abstract Introduction
Conclusions References
Tables Figures
◭ ◮
◭ ◮
Back Close
Full Screen / Esc
Printer-friendly Version Interactive Discussion
Discussion
P
a
per
|
Dis
cussion
P
a
per
|
Discussion
P
a
per
|
Discussio
n
P
a
per
|
Fig. 7.Temperature anomalies as a function of longitude on 28 January 2010 over 15◦N–15◦S.
ACPD
11, 15745–15774, 2011Cirrus cloud-temperature
interactions
J. R. Taylor et al.
Title Page
Abstract Introduction
Conclusions References
Tables Figures
◭ ◮
◭ ◮
Back Close
Full Screen / Esc
Printer-friendly Version Interactive Discussion
Discussion
P
a
per
|
Dis
cussion
P
a
per
|
Discussion
P
a
per
|
Discussio
n
P
a
per
|
Fig. 8.Temperature anomalies on 27–29 January 2010 on the 16 km altitude surface.