THIS REPORT WAS PREPARED BY “STUDENT’S NAME”, A MASTERS IN FINANCE STUDENT OF THE NOVA SCHOOL OF BUSINESS AND ECONOMICS, EXCLUSIVELY FOR ACADEMIC PURPOSES.THIS REPORT WAS SUPERVISED BY ROSÁRIO ANDRÉ WHO REVIEWED THE
VALUATION METHODOLOGY AND THE FINANCIAL MODEL. (SEE DISCLOSURES AND DISCLAIMERS AT END OF DOCUMENT)
See more information at WWW.NOVASBE.PT Page 1/32
M
ASTERS IN
F
INANCE
E
QUITY
R
ESEARCH
A high yield proposition. YieldCos are in the spotlight nowadays and appear as an attractive investment alternative for yield-seeking investors. Saeta Yield, the first and only European YieldCo (excluding UK), has been outperforming its US peers. TP €11.30, Buy. We initiate coverage with a FY16 Target Price of €11.30 and a Buy recommendation. The stock offers an upside of 33% to current prices and a dividend yield of 6.69%. Low risk and high growth. With stable and predictable cash flows and a low-risk profile, all eyes are in the potential for dividend growth that ROFO assets can bring. The first two ROFO dropdowns are going to be executed in the near-term.
Strong asset base. Notwithstanding the ROFO assets, Saeta has a young low-risk asset base which gives high visibility to the company and represents 92% of our Target Price, while ROFO assets represent the remaining 8%.
Spanish regulation entails some uncertainties. The Spanish remuneration framework is the source of the main risks for Saeta, once the majority of its revenues come from incentives. The exposures to pool prices and interest rates are partly mitigated by the regulatory system of caps and floors and derivatives contracts.
Company Description
Saeta Yield is the first and only European YieldCo (ex-UK), with a portfolio of renewable assets comprised by 16 wind farms and 3 solar thermal plants, which amounts to 689 MW capacity in Spain. Saeta went public on February 2015 and is sponsored by ACS and GIP, with whom it maintains a ROFO agreement since January 29, 2015, on a basket of assets representing 554 MW capacity.
S
AETA
Y
IELD
C
OMPANY
R
EPORT
U
TILITIES
8
J
ANEIRO2016
S
TUDENT
:
C
AROLINA
T
EIXEIRA
[email protected]
Taking the Lead on Yields
Tough
Regulation Can’t Stop the Sun
Shine
Recommendation: BUY
Vs Previous Recommendation -
Price Target FY16: 11.30 €
Vs Previous Price Target -
Price (as of 05-Jan-16) 8.52 €
Reuters: SAY.MC, Bloomberg: SAY:SM
52-week range (€) 7.72 - 10.06
Market Cap (€m) 695.04
Outstanding Shares 81,576,928
30-Day Average Volume 102,639
Source: Bloomberg
Source: Bloomberg
(Values in € millions) 2014 2015E 2016E
Revenues 215.9 223.2 224.3
Wind 97.2 105.3 105.5
CSP 118.7 117.9 118.8
EBITDA 152.4 157.1 157.8
Net Income 35.4 19.7 56.7
EPS 0.43 0.24 0.70
DPS - 0.43 0.62
Payout Ratio - 178% 89%
Debt-to-Equity 359% 246% 223%
SAETA YIELD COMPANY REPORT
PAGE 2/32
Table of Contents
Executive Summary ... 3
YieldCos ... 4
YieldCos: Going Deeper ... 4
Why YieldCos are Underperforming ... 5
Company Overview ... 6
Introducing Saeta Yield ... 6
Initial Assets: a Strong Asset Base ... 7
ROFO Assets: Potential for Growth ... 9
Shareholder Structure, Sponsors and Management ...10
Financing Structure and Taxes: Leverage is Key ...10
Dividends and Yields ...11
The Sector ...12
Energy Market: Brief Overview ...12
Renewables: a Bet in the Future ...12
Spanish Tariff Deficit ...15
Spanish New Regulation ...16
Peers ...18
Valuation ...19
Initial Assets ...19
Initial ROFO Assets ...22
SOTP Valuation ...25
Cost of Capital ...25
Valuation Models - Some Remarks ...27
Multiples ...27
Sensitivity Analysis ...28
Scenario Analysis ...29
Appendix ...30
Appendix 1: Balance Sheet -
Initial Portfolio of Assets (€ mn)
...30
Appendix 2: Income Statement -
Initial Portfolio of Assets (€ mn)
31
Appendix 3: Unlevered FCF -
Initial Portfolio of Assets (€ mn)
....31
SAETA YIELD COMPANY REPORT
PAGE 3/32
Executive Summary
Saeta Yield, the first and only European YieldCo (excluding UK), appeared as an attractive investment alternative for yield-seeking investors. The YieldCo’s concept was shaped in the US in July 2013 and have experienced a fast growth due to the low interest rate macroeconomic outlook and the ability of these companies to offer high yields to their investors.
Saeta has a portfolio of assets comprised by wind farms and CSP plants located in Spain, with a total installed capacity of 688MW. These assets offer flat revenues due to the regulatory framework in Spain and generate stable and predictable cash flows, associated with a low-risk profile. Furthermore, one of the main features of YieldCos is their potential to achieve sustainable growth throughout the Right of the First Offer agreement (i.e. ROFO), which gives preferential rights to the YieldCos over some of the sponsor’s assets. In Saeta’s case, its sponsors are ACS and GIP, and the ROFO portfolio comprises assets with a total installed capacity of 554MW. Therefore, with the increase of its portfolio through the acquisition of the ROFO assets, Saeta can also increase its dividend stream. Nevertheless, YieldCos have low costs of capital which allows them to have highly leveraged financing structures and benefit from tax shields. These low costs of financing can be achieved due to the fact that the assets are acquired after the development phase (in which the main risks are faced); consequently they are partially de-risked by the time they are incorporated in the company’s portfolio. All in all, this business and financing structure allows YieldCos to distribute a high portion of their Cash Available for Distribution through dividends - Saeta has a dividend yield of 6.69% (@ IPO Price of €10.45).
We initiate coverage with a Buy recommendation and a target price for the YE16 of €11.30 (33% upside potential), of which €10.45 corresponds to the initial portfolio of assets. Only some of the ROFO assets were accounted for the valuation (the ones which have call options embedded) as we believe the visibility on their final execution is substantially higher. In our opinion, the stability and low risk of its cash flows, the potential for growth and high dividend yield, associated with the environment that presents clear opportunities for renewable energy companies, makes this an attractive investment opportunity. Additionally, the fact that the company does not develop the assets, the low sensitivity to pool prices (due to the regulatory Spanish framework that establishes caps and floors) as well as to interest rates (once the company has 75% of its bank borrowing hedged), decrease substantially its business risk. Furthermore, it is important to stress that the announcement made by the company of the first two ROFO dropdowns on the near term, gives credibility to Saeta’s growth strategy.
Highly leveraged financing structure with
low costs of financing. Low-risk initial portfolio
with potential for high sustainable growth.
Low sensitivity to pool prices and interest rates.
First ROFO dropdown... Price Target and
SAETA YIELD COMPANY REPORT
PAGE 4/32
YieldCos
YieldCos: Going Deeper
Yield-paying companies are a relatively new type of company, which appeared in the US and experienced a fast growth during 2013 and 2014. YieldCos are typically used in the utilities sector, more specifically in renewable energy and appeared as a way of reducing investor’s risk associated with investing in renewable energy sources. Due to the weather conditions, renewables are riskier than other energy types and YieldCos can partially mitigate that problem.
The main purpose of YieldCos is to explore its long-term contracted operating assets which generate stable and predictable cash flows, and distribute to shareholders a meaningful portion of the cash flow available for distribution (80-90%) throughout dividends. Their revenue stream is supported by regulation or long-term Power Purchase Agreements (PPAs) which contributes to the predictability of their cash flows. This kind of companies are considered as being attractive to investors, not only due to their commitment to distribute dividends but also due to their low-risk yields which are expected to increase over time with the acquisition of new assets (i.e. dividend growth). As previously mentioned, YieldCos partially mitigate the risk associated with investing in renewables, once the assets are usually acquired when they are already developed and in the operating stage. Thus, considering that the main uncertainties are faced during the development stage, the acquired assets are partially de-risked when they start being controlled by YieldCos. Therefore, these companies have low-risk yields and can benefit from low costs of financing. Additionally, once the main purpose of YieldCos is to distribute dividends, aligned with the low cost of debt, these companies have highly levered financing structures which allows to benefit from tax shields (Figure 1).
Another important aspect of this asset class, is that YieldCos’ assets are mainly obtained through a sponsor – usually the largest shareholder – with whom the YieldCo has a ROFO Agreement (Right of the First Offer). Generally, YieldCos result from a spin-off from a sponsor which operates in the energy sector and have a large asset base. Hence, the YieldCo gets some of the sponsor’s assets, usually a relatively small amount, that should increase due to the ROFO agreement. This agreement is signed between both parties regarding a pipeline of the sponsor’s assets (“dropdowns”) and usually allows the YieldCo to have some kind of preferential treatment on the potential acquisition of some of the sponsor’s developed assets. Moreover, throughout the sale of those assets, the sponsor gets further sources of funds to invest in new renewable projects (i.e.
Source: Analyst’s Research
Figure 1: YieldCos Business Model
Benefits for the Sponsor:
Monetization
Investment in New Projects
Benefits for the YieldCo:
Assets are partially de-risked
Low cost of debt
High Leverage + No Equity Issuance
Tax Shields Sponsor
ROFO
YieldCo
Develops Assets
Sold
High Dividend
SAETA YIELD COMPANY REPORT
PAGE 5/32 monetization). Additionally, the sponsor has still the right to receive dividends because it is a shareholder of the YieldCo and actually it is usually the largest one (Figure 1).
However, YieldCos are not exactly a new phenomenon. This special purpose vehicle (SPV) has some similarities with other ones which are commonly used by investors, like the Master Limited Partnerships (MLP) and Real Estate Investment Trusts (REIT). On one hand, all of them provide stable and growing distributions for investors, lower cost of capital as well as tax benefits and tax shields - although tax benefits are higher in the case of MLPs and REITs. On the other hand, YieldCos are more flexible considering that there are no restrictions regarding the type of assets or income, neither concerning the payout ratio. Therefore, even though this is a new SPV used in the energy sector, the concept behind it is not completely new.
Thus, considering all of the above mentioned, it is important to stress that YieldCos are increasing their popularity among investors who seek high yield investments. Since 2013 there is a total of 19 listed YieldCos (Figure 2), the majority in the US (8), and the remaining in Canada (4), UK (6) and Spain (1). The first one, NRG Yield (USA), went public on July 2013. However, the first European YieldCo, Saeta Yield, just went public on February, 2015.
Why YieldCos are Underperforming
The market reacted positively to the appearance of the first YieldCos in 2013, with daily arithmetic returns reaching the 5%. However, during the last half year the YieldCo Index has been falling sharply (Figure 3). Saeta did not experienced the previous rally that its peers went through, once its IPO was made in February, 2015, in a context quite different from the one experienced in 2013 and 2014. There are several possible reasons to explain the drop in YieldCos’ share prices, namely:
The decline in fossil fuel prices – investors’ perception is that all energy companies are risky right now (despite renewables do not depend on oil); Some YieldCos have issued new equity to fund their growth (i.e. to purchase
ROFO assets), and markets have reacted negatively to that. However, once a huge percentage of the profits are distributed as dividends and YieldCos’ leverage is already high, they will eventually need to raise more equity; Investors were expecting a higher growth on yields, which is quite difficult to
achieve due to the already high value of those yields.
Notwithstanding, Saeta is underperforming its US YieldCo’s peers, even though its share price has fallen 18% since its IPO. This is explained by the fact that YieldCos are new, but
they are not a new
phenomenon… – ’ ’ ’ ’ ’ ’
List of YieldCos
Spain
Saeta Yield
UK
The Renewables Infrastructure Group Ltd. Greencoat UK Wind Plc
Bluefield Solar Income Fund Ltd. NextEnergy Solar Fund Foresight Solar Fund
John Laing Environmental Assets Froup Ltd.
Canada
Northland Power Inc. TransAlta Renewables, Inc. Innergex Renewable Energy, Inc. Capstone Instrastructure Corp.
USA
TerraForm Power
Broofield Renewable Enegy Partners LP Abengoa Yield Plc
Pattern Energy Group, Inc. NRG Yield, Inc.
NextEra Energy Partners
Hannon Armstrong Sustainable Infrastructure 8point3
Figure 2: YieldCos’ List
Source: Analyst’s Research
Figure 3: YieldCo Index (20/12/2013 – 06/01/2016)
SAETA YIELD COMPANY REPORT
PAGE 6/32 Saeta did not issue further equity. Moreover, it is expected that all or at least the majority of the ROFO assets can be purchased using Saeta’s liquidity and the possibility that the company still has to get further debt financing. For the first two dropdowns already announced, the company will use cash at the HoldCo level and will levering its two debt-free assets (Serrezuela and Valcaire).
Company Overview
Introducing Saeta Yield
Saeta Yield, the first YieldCo in Europe and only (ex-UK), produces energy from wind and solar sources in Spain. It is important to stress that the company is not a new player in the market - in fact it was created in May 19, 2009, with the name “El Recuenco Eólica, S.A.”. By that time, it already operated on the renewable energy sector as a subsidiary of ACS – Servicios, Comunicaciones y Energía, S.L. Group, managing the portfolio of assets that currently it still has. With the appearance of the first YieldCos in the US in July 2013, El Recuenco has been through some changes regarding its legal and shareholder structure, which also included the change of its name in November, 2014. Its IPO was made on February 16, 2015, with 81,576,928 listed shares on the Spanish Mercado Continuo, at a value of €10.45/per share. In relation to Saeta’s IPO, it is important to stress that this transaction was value accretive for ACS’s shareholders. In fact, considering all the cash flows estimations and valuation methods used to value Saeta Yield during this research, we assessed Saeta’s equity value as of 15th of February 2016, including both the value of the initial portfolio as well as the Initial ROFO Portfolio (i.e. Extresol 2, Extresol 3 and Manchasol 1). We have reached an equity value of €10.02/per share, which means that the shares were sold at a 4% premium regarding the equity value of Saeta at that time, and consequently this transaction was value accretive for ACS’s shareholders. The main reason that led the market to overestimate Saeta, is related with the growth prospects of the company. The perception of growth and its consequent valuation differs a lot among investors, which gives room to some distortions regarding the true value of the company.
After the IPO and as it is usual on YieldCos, the main shareholders of the company remained ACS SI and GIP (Global Infrastructure Partners) with whom Saeta maintains a ROFO and Call Option Agreement since January 29, 2015. The expertise of ACS as a world leading construction and engineering group aligned with the financial support of GIP, makes these sponsors highly capable to offer excellent dropdowns (i.e. investment opportunities) which can contribute to the company’s growth. Once renewable energy assets offer flat revenues, growth Saeta went public on
February, 2015.
The IPO was value accretive for ACS –Saeta’s
SAETA YIELD COMPANY REPORT
PAGE 7/32 can only be achieved throughout acquisitions. Hence, the ROFO Agreement can be the main catalyst of growth - it includes several assets (wind farms, solar thermal plants and one transmission line) located in several different countries, which can improve Saeta’s geographical diversification. However, Saeta is also searching for additional growth opportunities through third-party acquisitions. The company expects 75% of its future growth to come from the ROFO Agreement, and the remaining 25% from third-party acquisitions.
Initial Assets: a Strong Asset Base
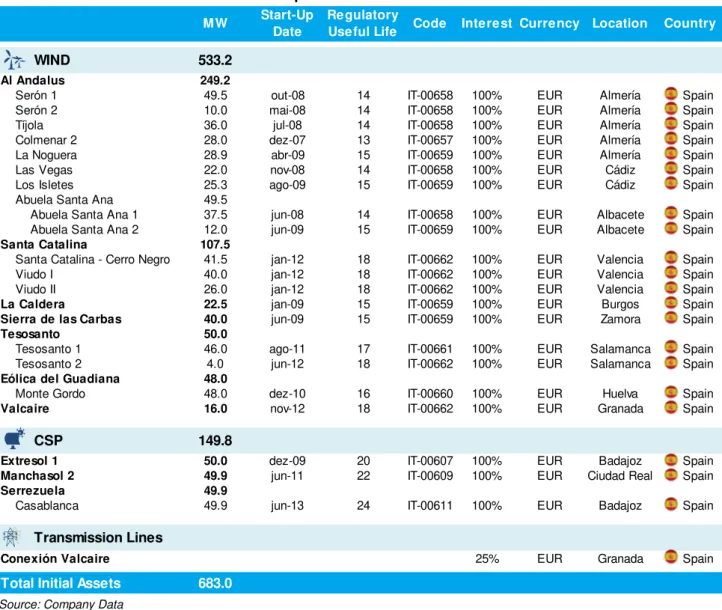
The initial portfolio of assets owned by Saeta is comprised by 16 wind farms (538 MW), 3 solar thermal plants (150 MW) located in several regions of Spain and a 25% interest in a transmission line. These assets are organized among the 10 totally owned subsidiaries of Saeta Yield and represent an installed capacity of 688 MW (a maximum authorized capacity of 683 MW). Further details are presented in the table below (Table 1).
Table 1: Saeta Yield - Initial Assets Description
Source: Company Data
WIND 533.2
Al Andalus 249.2
Serón 1 49.5 out-08 14 IT-00658 100% EUR Almería Spain
Serón 2 10.0 mai-08 14 IT-00658 100% EUR Almería Spain
Tíjola 36.0 jul-08 14 IT-00658 100% EUR Almería Spain
Colmenar 2 28.0 dez-07 13 IT-00657 100% EUR Almería Spain
La Noguera 28.9 abr-09 15 IT-00659 100% EUR Almería Spain
Las Vegas 22.0 nov-08 14 IT-00658 100% EUR Cádiz Spain
Los Isletes 25.3 ago-09 15 IT-00659 100% EUR Cádiz Spain
Abuela Santa Ana 49.5
Abuela Santa Ana 1 37.5 jun-08 14 IT-00658 100% EUR Albacete Spain
Abuela Santa Ana 2 12.0 jun-09 15 IT-00659 100% EUR Albacete Spain
Santa Catalina 107.5
Santa Catalina - Cerro Negro 41.5 jan-12 18 IT-00662 100% EUR Valencia Spain
Viudo I 40.0 jan-12 18 IT-00662 100% EUR Valencia Spain
Viudo II 26.0 jan-12 18 IT-00662 100% EUR Valencia Spain
La Caldera 22.5 jan-09 15 IT-00659 100% EUR Burgos Spain
Sierra de las Carbas 40.0 jun-09 15 IT-00659 100% EUR Zamora Spain
Tesosanto 50.0
Tesosanto 1 46.0 ago-11 17 IT-00661 100% EUR Salamanca Spain
Tesosanto 2 4.0 jun-12 18 IT-00662 100% EUR Salamanca Spain
Eólica del Guadiana 48.0
Monte Gordo 48.0 dez-10 16 IT-00660 100% EUR Huelva Spain
Valcaire 16.0 nov-12 18 IT-00662 100% EUR Granada Spain
CSP 149.8
Extresol 1 50.0 dez-09 20 IT-00607 100% EUR Badajoz Spain
Manchasol 2 49.9 jun-11 22 IT-00609 100% EUR Ciudad Real Spain
Serrezuela 49.9
Casablanca 49.9 jun-13 24 IT-00611 100% EUR Badajoz Spain
Transmission Lines
Conexión Valcaire 25% EUR Granada Spain
Total Initial Assets 683.0
Start-Up Date
MW Regulatory
SAETA YIELD COMPANY REPORT
PAGE 8/32 The assets belonging to the initial portfolio are relatively new, with start-up-dates (SUD) from 2007 until 2012 (Figure 4), but with an already proven solid track-record. In what concerns to wind assets, Saeta has the youngest wind asset base when compared with its peers, which contributes for these assets to be considered more valuable than older ones. In fact, the new Spanish Regulation establishes that wind assets prior to 2004 don’t receive any investment incentive, once it is considered that the incentives established by the previous regulation allowed those assets to recover already the initial investment (i.e. incentives were higher and the assets could already reach an IRR higher than 7.4%, therefore more incentives aren’t needed). Moreover, the assets post-2008 have significant higher remunerations, as a consequence of the same reasoning. As a result, the older the asset the lower the attributed incentives, and consequently the lower the revenues. Consequently, once incentives constitute the majority of the revenues, the value of older assets are lower than newer ones.
As previously mentioned, Saeta’s assets are relatively new, with an average of 3 years old in the case of CSP assets (with a maximum of 7.5 hours of storage capacity), and 5 years old in the case of wind assets. Additionally and in accordance with the RD 9/2013, the regulatory useful life for CSP assets is 25 years and for wind assets is 20 years (vs 25 years of actual useful life for wind assets). Thus, it is expected that Saeta’s CSP assets still have 22 operating years, and wind assets 20 operating years (but only 15 years receiving incentives). Those values have been used to our forecasts, which will be further detailed on the valuation section of this research. Additionally, it is important to refer that the company has a proven track-record, with high load factors (Figure 5 and 6), that are above the thresholds established by Spanish regulation (12% for wind assets and 19% for solar assets). Moreover, it is important to highlight the high availability of Saeta’s wind farms (98.50% in 2014) and high average performance ratio1 of its solar thermal plants (112.30% for 2014).
Saeta’s initial assets offer high and predictable revenues, due to the regulatory framework in Spain that establishes the attributable remuneration for each type of asset. Even though some variations can occur due to unpredictable movements on energy prices, they are corrected at the end of the each half-statutory period, as it will be further explained in the “Spanish New Regulation” section of this research. Although all eyes are in the ROFO dropdowns, this initial portfolio assets already gives high visibility for the company, associated with a low-risk profile due to their age (i.e. they are already operating and not in the development stage).
1 Measures the plant's real production versus the theoretical production based on existing weather conditions. Figure 6: Load Factor of
Saeta’s solar assets
(2010-14)
Source: Company Data
Figure 5: Load Factor of
Saeta’s wind assets
(2008-14)
Source: Company Data
Figure 4: Saeta’s Assets (by start-up-year)
SAETA YIELD COMPANY REPORT
PAGE 9/32
ROFO Assets: Potential for Growth
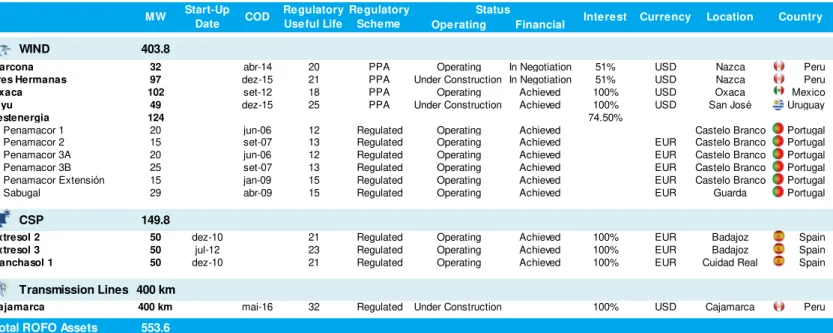
The ROFO and Call Option Agreement signed in January is comprised by 10 wind farms (404 MW) organized throughout 5 subsidiaries, 3 solar thermal plants (150 MW) and one transmission line (400km), that can be acquired during the period 2015-2017 (Figure 7). These assets are located in several different countries but all of them have their revenues references in euros or American dollars, which partially mitigate the foreign-exchange risk (i.e. FX risk). The majority are already in operation or expected to start operating in the near-term. Additionally, it is important to highlight that the majority of these assets are fully regulated (some of them have PPAs signed for more than 20 years), which makes them more stable in terms of revenues. However, these assets were not included in the YieldCo’s portfolio before, once they were perceived as being more risky due to the following reasons: i) the majority of these assets were in the development phase or they still didn’t have a proven operating track-record due to their young age, which increased the risk of operating default; ii) some of them haven’t reach any agreement yet regarding its financing; iii) the majority are situated in other countries rather than Spain and the company still needs to consolidate its position in Spain before going internationally. Initial ROFO assets are further detailed in the table below (Table 2).
Table 2: Saeta Yield - ROFO Assets Description
Source: Company Data
Firstly, it is important to stress that Saeta has call options and co-control on the 3 CSP plants, with strike prices ranging from €245m - €275m, depending on the year in which they are exercised (i.e. 2015-2017). In fact, two of the call options (Extresol 2 and Extresol 3) will be exercised until year-end, accordingly to the
Operating Financial
WIND 403.8
Marcona 32 abr-14 20 PPA Operating In Negotiation 51% USD Nazca Peru
Tres Hermanas 97 dez-15 21 PPA Under Construction In Negotiation 51% USD Nazca Peru
Oxaca 102 set-12 18 PPA Operating Achieved 100% USD Oxaca Mexico
Kiyu 49 dez-15 25 PPA Under Construction Achieved 100% USD San José Uruguay
Lestenergia 124 74.50%
Penamacor 1 20 jun-06 12 Regulated Operating Achieved Castelo Branco Portugal
Penamacor 2 15 set-07 13 Regulated Operating Achieved EUR Castelo Branco Portugal
Penamacor 3A 20 jun-06 12 Regulated Operating Achieved EUR Castelo Branco Portugal
Penamacor 3B 25 set-07 13 Regulated Operating Achieved EUR Castelo Branco Portugal
Penamacor Extensión 15 jan-09 15 Regulated Operating Achieved EUR Castelo Branco Portugal
Sabugal 29 abr-09 15 Regulated Operating Achieved EUR Guarda Portugal
CSP 149.8
Extresol 2 50 dez-10 21 Regulated Operating Achieved 100% EUR Badajoz Spain
Extresol 3 50 jul-12 23 Regulated Operating Achieved 100% EUR Badajoz Spain
Manchasol 1 50 dez-10 21 Regulated Operating Achieved 100% EUR Cuidad Real Spain
Transmission Lines 400 km
Cajamarca 400 km mai-16 32 Regulated Under Construction 100% USD Cajamarca Peru
Total ROFO Assets 553.6
Status
Country COD Regulatory
Scheme Currency Location MW Start-Up
Date
Regulatory
Useful Life Interest
Figure 7: Installed Capacity Addition with the ROFO
SAETA YIELD COMPANY REPORT
PAGE 10/32 management team. The strike prices accordingly with the year in which the call options are exercised, are presented in the table on the left (Table 3):
Secondly, for the remaining assets Saeta has just the right to make a first bid. This right is not a firm commitment, which means that ACS may accept it or not. However, if both parties can’t reach any agreement, ACS SI can only sell those assets after 18 months and at a higher price. The ROFO agreement has a term of 5 years and can be automatically extendable for 3 more years if Saeta would have acquired at least one of the ROFO assets in the preceding 2 years. Moreover, in the case of Marcona and Tres Hermanas ACS’ shareholders have the right of first refusal, a tag along, a drag along and a call option on ACS’ stake.
Shareholder Structure, Sponsors and Management
Nowadays, Saeta has a total number of shares of 81,576,928, listed on the Spanish Mercado Continuo. The company has two main shareholders: Energía y Recursos Ambientales, S.A., which belongs to the ACS Group, and Global Infrastructure Partners (GIP), with 24.21% and 24.01% ownership of Saeta, respectively. The remaining is free float (Figure 8).
In order to adapt its business model to the YieldCo model, Saeta’s stock has already gone through some major changes since the beginning of 2015:
The stock splitting in a ratio of 10/1, on January 20;
The capital increase fully paid and subscribed by Energía y Recursos Ambientales, S.A., on January 27 (disbursement on February 12);
The IPO made on February 16, with ACS as the selling shareholder;
The entry into force on April 23 of the Sales and Purchase Agreement made with GIP during January, which allowed the last to acquire 24.01% of Saeta and also a 49% stake in DevCo. DevCo is a joint venture between ACS and GIP which develop greenfield renewable projects and some of them are incorporated in the ROFO Agreement;
Three dividend payments made on May 29, August 29 and November 27 amounting to €6.69m, €14.25m and €14.25m, respectively (Figure 9).
Moreover, it is relevant to make a highlight to the management team of Saeta, which has a top executive management with past experience in several companies in the sector. Although the company went public only on February 2015, the expertise of the management team acquired in previous jobs can contribute to a good performance.
Financing Structure and Taxes: Leverage is Key
One of the main advantages of YieldCos compared with the regular renewable energy companies, regards their financing structure. YieldCos are highly Figure 8: Shareholder
Structure
Source: Company Data Source: Company Data
Table 3: Call Options on ROFO Assets
2015 2016 2017
Extresol 2 €265m €255m €245m Extresol 3 €275m €265m €255m Manchasol 1€275m €265m €255m
CSP Call Option (EV)
Figure 9: Target and Distributed Dividends
Source: Company Data
€14.25m €0.1747 €57m €0.699
Target Dividends (2015-16)
€14.25m €0.1747
€6.69m €0.082
€35.19m €0.4314
3Q: November 17, 2015
2Q: August 29, 2015
1Q: May 29, 2015
Until Now
Total Dividend
SAETA YIELD COMPANY REPORT
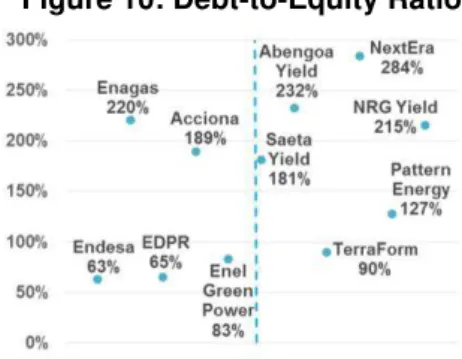
PAGE 11/32 leveraged companies, which use debt as their main source of financing. Contrarily, regular renewable energy companies have lower debt-to-equity ratios and the majority are mainly financed throughout equity (Figure 10). Therefore, YieldCos can enjoy higher tax shields than usual, which is an additional source of value for these companies.
However, what allows a YieldCo to have such a high amount of debt without entering in financial distress is the fact that its cost of financing is relatively low for such a high leveraged structure. As previously mentioned, YieldCos are less risky than normal renewables, due to the fact that they buy the assets after the development phase - consequently, their costs of capital are lower (especially their cost of equity - Figure 11). Also, YieldCos use several different techniques in order to optimize their cost of debt (e.g. project-level debt, tax-equity investments, etc), but the corporate leverage is not typically used. In Saeta’s case, all its debt is at the project-level, which means that debt is related to each project itself and not to the overall company and consequently, creditors cannot claim the whole corporation in case of default. It is also important to mention that in the case of Saeta the interest rates on those loans are indexed to the Euribor 3M. In order to partially mitigate interest rate risk, Saeta use financial derivative instruments with long-term maturities, more specifically interest rate swaps, which cover around 75% of the Group’s external bank borrowings.
Regarding fiscal matters, Saeta has several mechanisms to avoid paying corporate taxes in the near term. Firstly, it enjoys the Spanish Tax Consolidated Regime that allows to pay Corporate Income Tax (CIT) as a single taxpayer; hence, Saeta can offset all profits and losses from its subsidiaries as long as it has stakes above 75% on those subsidiaries. Secondly, it has tax losses carryforwards in the plants that didn’t belong previously to ACS. Thirdly, Saeta expects to benefit from free tax depreciation from 2016 onwards (i.e. accelerated depreciation tax regimes). In conclusion, the company expects to pay taxes in 2015, but it does not expect to pay CIT from 2016 to 2021. If Saeta acquires some of the ROFO assets in the near-term, it can benefit from further tax deductions.
Dividends and Yields
One of the main goals of YieldCos as total-return companies, is to distribute high dividends. Therefore, dividend payments and respective yields are critical for YieldCos’ investors. Accordingly to the IPO Prospectus filed on CNMV in January 30, Saeta expects to distribute a minimum of €57m during 2015 and 2016 (80-90% of CAFD), achieving an expected dividend yield of 6.69% (considering the IPO price on February 16, 2015, of 10.45€). This yield is substantially higher than Figure 12: Dividends
Distributed and Remaining
Source: Company Data
Figure 11: Cost of Equity
and Project’s Phases
Source: Analyst’s Research
Figure 10: Debt-to-Equity Ratio
SAETA YIELD COMPANY REPORT
PAGE 12/32 the main US YieldCos, which contributes for the attractiveness of Saeta. Until now, the total dividends paid amount to €35m distributed in three quarterly payments, as previously mentioned (Figure 9). These payments represent nearly 62% of the target dividends, which puts Saeta on-track to accomplish the target value (Figure 12).
The Sector
Energy Market: Brief Overview
The Spanish Energy Market closed in 2014 with a total installed capacity of 102,259 MW and a yearly production of 253,724 GWh. Spain has been facing a significant trend regarding the increase of the contribution of renewables to the overall energy production through the last years. In fact, renewable energies represented 42.8% of the overall Spanish energy production in 2014, compared with 35.3% in 2010 (Figure 13). It is important to stress that Spain is assuming a leading role in Europe, comparing the 42.8% value of Spain to the 15% European average of renewable energy contribution to the overall European’s energy production. Even though this average is still low, Europe is committed to change this paradigm and offers good prospects for renewable energy, supported by its target for 2020 and 2030 (Figure 14). Moreover, among the renewable sources in Spain, wind is the one with higher installed capacity, representing 22% of the overall Spanish installed capacity (Figure 15).
Additionally, there is a global trend regarding the increase of electricity’s weight on the energy mix (i.e. electrification of the economy). Hence, it is needed to explore new ways of producing it that do not require the consumption of so many limited resources, in order to guarantee that all power demand will be supplied in the future. Also, these new energy sources can guarantee some degree of energy independence and consequently a breakup with the current paradigm that gives so much importance to petrol and their owners.
For Saeta, this strong bet that the world and particularly Spain has been doing on clean energy presents a clear opportunity, especially if we take into account that this new outlook is not a temporary trend: it came to stay. Therefore, we believe the future belongs to renewables, as it will be further explained on the next section – “Renewables: a Bet on the Future”.
Renewables: a Bet in the Future
We believe the future belongs to renewables, due to several reasons. The most important one is that there is an increase of the awareness regarding environmental sustainability. Governments around the world are showing their Figure 14: EU Targets for final
energy consumption from renewable energy sources
Source: European Central Bank
Figure 13: Renewable and Non-Renewable Energy Production in Spain (2010-2014)
Source: REE
Source: REE
SAETA YIELD COMPANY REPORT
PAGE 13/32 willingness and commitment to change the current unsustainable outlook. For instance, the United States have recently extended the Production Tax Credits (PTCs) and the Investment Tax Credits (ITCs)2 and have put into force the Clean Power Plan3, which are clear measures that favour renewable energy companies and reinforce its commitment to renewables. But this phenomena is not only going through the United States. All countries are starting implementing more and more these kinds of measures. In fact, during December 2015, a new global agreement was discussed in Paris, on the Conference of the Parties to the United Nations Framework Convention on Climate Change (COP21). This agreement is broader than the 1997 Kyoto Protocol and is a step forward to reduce CO2 emissions in a world that is about to reach an historical maximum regarding temperatures. Though it is a step forward, more actions are required once no specific sanctions were agreed. Thus, the COP21 is not an agreement itself, but it sends a clear diplomatic message to investors and governments: it is needed to shift away from non-renewable sources, especially coal. The new package of measures include goals in: temperature, fossil fuels, transparency to measure the emissions of every nation, provisions for emergencies, and financing.
Despite all the environmental advantages of clean energies, there are a general concern regarding the profitability of renewable energy companies once they are still not self-funded. Nevertheless, this situation is expected to be reverted in the short-term, for several reasons. Firstly, technology has been evolving, allowing load factors to increase and consequently the overall productivity of the energy sector has been also increasing. Secondly, the average costs has been decreasing and the gap between the costs to produce energy from pollutant and green energy sources has been decreasing. In fact, if we consider the levelized cost of electricity of different energy sources, it is expected that, by 2020, wind become the cheapest energy source, with a levelized cost of USD 73.6, compared with the USD 95.1 of the conventional coal (Figure 16, on the next page). This metric allows to calculate in comparable terms the costs to build and operate plants that use different technologies to generate electricity, once it accounts for all costs needed (i.e. capex, fixed and variable O&M and fuel costs). Thus, this metric represents the whole cost of the plant per unit of electricity produced throughout the whole life of the asset.
2 The 10-year PTCs of $0.023/kWh given to wind energy producers, expired at the end of 2014. The Congress has agreed on December, 2015, to extend this incentive applying the $0.023/kWh wind PTCs to 2016 and 2015 (i.e. with retroactive effects), after which it would decline each year until 2020. The ITCs of 30% given to solar energy producers were also extended on that date, maintaining the current value of 30% until 2019, after which it will decline until 2022. 3 Plan approved on August 3, 2015, that establishes standards to reduce carbon dioxide emissions by 32% from 2005
levels by 2030. The plan provides several options to achieve the target result but all of them pass by shifting away from coal-fired power. Consequently, since non-renewable sources are cheaper, the reduction of their contribution to the energy mix will led to an increase in pool prices.
Load factors have been
increasing…
…. And average costs
SAETA YIELD COMPANY REPORT
PAGE 14/32 Figure 16: Estimated Levelized Cost of Electricity and variations for plant type, 2020 (USD)
Source: US Energy Information Administration (EIA)
Thirdly, the CO2 cost is increasing - even though this is a theoretical concept
and until now it is not significantly high, this concept is assuming an important role with the increasingly awareness regarding the world’s sustainability. Besides, it is expected that wind energy will play a key role on the new energetic outlook mainly because of its competitive cost level. On the other hand, solar thermal plants have substantially higher costs but also give higher revenues mainly because their subsidies are higher.
In addition, it is important to stress that the storage of energy has been in the spotlight - investigations regarding it have been increasing and some developments have already been made. It is already possible to store some energy, but still for short periods of time. However, if some new developments are made on the near-term, this can mitigate the main drawback of renewables: the fact that they are highly dependent on weather conditions and its production cannot be adjusted to demand.
SAETA YIELD COMPANY REPORT
PAGE 15/32
Spanish Tariff Deficit
During the last years the Electricity Tariff Deficit has been a hot topic on the energy sector, which has motivated several regulatory changes especially from 2011 onwards. The origins of this deficit come up to 2000, with regulated tariffs that were not cost-oriented - therefore, revenues were unable to cover all system’s costs (Figure 17). In fact, by 2008 the Tariff Deficit already rounded the €20bn. Several reasons contribute to this snowball of increasingly deficit:
The abrupt increase of oil prices in 2005 and consequent increase of costs; The recession period started in 2008 that led to an abrupt decrease of demand
which put into risk all the demand projections made beforehand by the Government - the regulated tariffs were established accordingly with those projections, thus the Government paid significantly higher tariffs than the energy sold at the market;
The boom of renewable companies in 2010 which had higher incentives than non-renewable sources and consequently also increased the tariff deficit;
With the elections of 2011 and a raising concern towards the sustainability of the electricity system, the new Government started a complete reform of the whole system. This reform had the goal to guarantee the future sustainability of the system without passing-through all cost to consumers, as well as correcting the existing imbalances by that time. Therefore, part of those costs were passed-through to the energy companies, using the following mechanisms. Firstly, it has been created a tax on generation of 7%. Secondly, the premium paid to renewables has been eliminated since these kinds of companies were the ones enjoying bigger Government’s financial support. In fact, renewables supported a significant portion of the burden to eliminate the Spanish tariff deficit. Thirdly and lastly, the implementation of a new remuneration framework mainly for regulated activities that will be further explained and has major impacts on Saeta’s revenues.
Accordingly to CNMC, the system is expected to generate a tariff surplus from 2015 onwards (Figure 17), due to: i) a decrease in costs caused by the regulatory changes; ii) an increase in demand and consequent increase in revenues. More precisely, the forecasts made by CNMC point out to a tariff surplus of €36mn for 2015, although until September the tariff deficit was -€1.050mn4. Even though at the first sight it seems to exist some inconsistency on the forecasted and realized values for the 9 months and the whole year (i.e. it was forecasted a tariff surplus
4 Accordingly to the “Informe sobre la Liquidacón Provisional 9/2015 del Sector Eléctrico”, the Tariff Deficit for the first 9
months of 2015 amounted to -€1.050, which is above the forecasted Tariff Deficit for the same period of -€1.542. Figure 17: Spanish Tariff
Deficit (2000-15), yearly (€bn)
SAETA YIELD COMPANY REPORT
PAGE 16/32 for 2015 and a tariff deficit for the 9 months), CNMC points out a solution with this new regulatory framework: the unbalance between revenues and costs will be afforded by all players of the system, proportionally to the monthly incentives that they receive. As a result, the tariff surplus for 2015 can be still achieved, especially if we take into account that the value for these 9 months was, in fact, better than expected.
To conclude with, for Saeta Yield all the regulatory changes have impacted negatively the revenues due to the strong weight that incentives have on Saeta’s revenues (Figure 18). In fact, and as the majority of the energy companies, the previous feed-in tariff regime originated higher revenues than the regulated payments that they receive under this new regime.
Spanish New Regulation
The new remuneration framework approved by the Royal Decree 413/2014 introduced major changes for regulated activities and particularly to renewable energy companies. The major pillar of this regulatory framework is the concept of “reasonable rate of return”. Accordingly to the legislators, renewable energy producers that were already operating and receiving incentives at the time of the Royal Decree are entitled to receive what they consider being a reasonable rate of return, through their regulatory life. This rate corresponds to a pre-tax return of 7.398%, and was set taking into account the 24 months average of the 10-year Spanish bond (which, by that time, was 4.398%), plus 300 basis points.
In order to achieve this return, each plant receive three major remunerations (Figure 19) which, summed up, allow the company to achieve the 7.4% IRR: A Market Remuneration (€/MWh produced) that corresponds to the sale of
the renewable energy production, at the wholesale market price.
An Operating Remuneration (€/MWh produced) in the case of solar thermal plants, to allow them to recover all O&M costs that were above the expected market price, up to a cap of production hours. The reasoning behind is that the operating remuneration per unit added to the wholesale market price, equals the O&M cost per unit.
A Return on Investment (€/MW of installed capacity) which enables the producer to cover the investment costs that cannot be recovered throughout the sale of energy on the market.
Figure 18: Weight of Incentives and Market
Revenues on Saeta’s Total
Revenues (2014)
Source: Company Data
Figure 19: Remuneration Framework
Source: Company Data
Market Component Remuneration to Operation + Remuneration to Investment System of Caps
SAETA YIELD COMPANY REPORT
PAGE 17/32 Figure 20: System of Caps and Floors and Adjustments
Source: Analyst’s Research
For the calculation of each of the three remunerations, this new framework has identified more than 1500 standard facilities in the IET/1045/2014. For each standard plant and considering they are well managed, it has been identified the standard values for: the initial investment, O&M costs per unit, number of operating hours (annually), regulatory useful life, Commercial Operation Date (COD), estimates for the future revenues and estimates for the future O&M costs. Based on all these values, it has been attributed a specific operating remuneration and investment remuneration for each standard facility, that could allow it to achieve the reasonable rate of return. However, if the company is more efficient it can beat the 7.4% IRR. Also, it is important to stress that all calculations were based on the Government’s estimates of future pool prices. Aligned with these estimates, it has been introduced a compensation mechanism for deviations between the estimated market prices and the real ones, using a system of caps and floors which limits the company’s exposure to electricity prices (Figure 19 includes the stipulated values for caps and floors until 2017). Hence, if pool prices surpass the first cap or the first floor, the company needs to pay or is entitled to receive a given amount (Figure 20). This system decreases substantially the exposure of the company to the volatility in pool prices.
Furthermore, this remuneration framework sets statutory periods of 6 years (first statutory period: 2013-2019) and each statutory period is divided into two half-periods of 3 years (first half-period: 2014-2016). At the end of each of the statutory half-periods, the Government may amend potential differences between the estimated and realized pool prices, as well as estimate the future ones. However, at the end of each statutory period, the Government can change the rate of return, the estimated operating costs and remuneration to investment. Although some estimations can be revised in December 2016, the main threat for Saeta is actually what is going to happen after December 2019. Right now,
2017
60
56
48
44
5 52
35 40 45 50 55 60 65
2014 2015 2016 2017
C2
C1
F1 F2 Pool Price
No Adjustments
- 50% * (C1 - Pool Price)
- 50% * (C1 - C2) + (C2 - Pool Price)
- 50% * (F1 - Pool Price)
SAETA YIELD COMPANY REPORT
PAGE 18/32 Spanish Government 10-year bonds had a major fall, reaching values rounding the 1.5% (far below the 4.4% used by the Government to calculate the target rate of return established by the current legislation), as it is possible to see on the graph on the left (Figure 21). However, if we consider the main purpose of all this new remuneration framework – i.e. eliminate the tariff deficit without passing-through the costs to customers – the goal is being achieved at the current values. The yearly tariff deficits are decreasing (and it is even expected the first tariff surplus since 2000), and prices kept its competitiveness (i.e. the costs above the revenues are being supported by the companies and not by increases in pool prices and, consequently, supported by consumers). Additionally, it is important to emphasise that this framework is already exceptionally tough for energy companies; decreasing even more the incentives would seriously put into risk the profitability of the sector – which, for sure, is not the purpose of the Spanish Government. Moreover, there are some automatic stabilizers included in this framework that are triggered when deficits reach certain thresholds. Therefore, it is quite unlikely that even more austerity measures are undertaken. Notwithstanding, we contemplate this possibility in our scenarios which are incorporate in our target price, as it is further explained on this report.
Peers
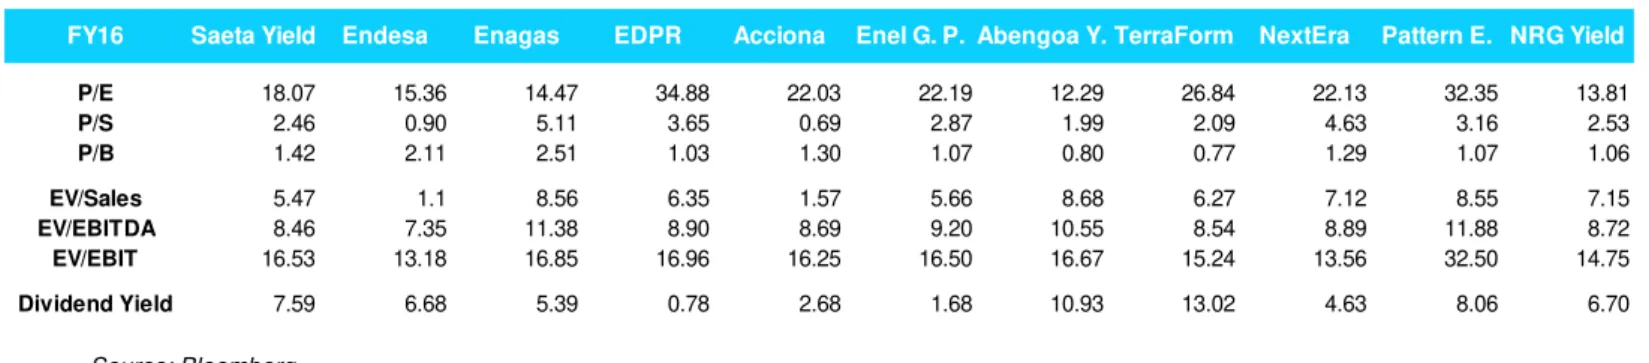
Concerning Saeta’s Peers, there are two possible groups to be considered. Firstly, Saeta’s Spanish Peers which also produce renewable energy – Endesa, Enagás, EDPR, Acciona and Enel Green Power (the Spanish business). Secondly, the rest of the YieldCos, from the US – Abengoa Yield, TerraForm, NextEra, Pattern Energy and NRG Yield. However, neither of them can be considered a proper comparable. The first ones operate in the same business and in the same market but with a quite different financing and business models. The second ones, have the same model attending to the fact that they are also YieldCos, but operate in the US – a really different market at all levels. Consequently all comparisons need to be carefully made and taking into account these factors.
Figure 21: Generic Spanish 10-Year Government Bond (2012-16)
SAETA YIELD COMPANY REPORT
PAGE 19/32
Valuation
Initial Assets
For the valuation of the initial portfolio of assets it has been used a discounted cash flow model for each of the assets, more specifically an Adjusted Present Value model (APV)5, with a 2.8% unlevered cost of equity (RU) and a 3.5% cost of debt (RD). Further on this report, it will be explained the calculations used for the cost of capital and the reasons supporting the choice of the APV model (Sections: “Cost of Capital” and “Valuation Models - Some Remarks”).
Additionally, it has been forecasted the free cash flows for the whole useful life of each of the assets (i.e. 25 years for both CSP and wind farms) - Appendix 3. However, after those assets reach the end of their useful lives, Saeta will need to decide whether it should proceed with their repowering or not (i.e. make the investment needed to re-build those assets in order to put them in operation again). A hypothetical exercise had been made to contemplate this possibility in order to access if this future investment would be value accretive or value destroyer for the company, as it is further explained on this report. Nevertheless, this hypothesis was not included in the overall company’s valuation, so no terminal value of the initial portfolio of assets had been assumed. The main reason supporting this choice is the fact that there are a lot of uncertainty regarding all values used on these calculations, once we are trying to forecast a future that will happen 20 years from now - there are no indication regarding the future capex cost, energy prices, O&M costs, etc. Although this value has been calculated based on some assumptions, but considering that those assumptions are discussable and somewhat unrealistic, a more conservative approach had been adopted and this value were not considered for the company’s valuation.
Moreover, it is also important to stress that some assumptions regarding the key value drivers have been made to forecast the free cash flows of the initial portfolio of assets, namely:
The remuneration framework would be maintained until the end of the regulatory asset’s lives, due to the fact that we believe renewables will play an important role in the future and Government will keep supporting renewable energy companies;
5 It has been forecasted all the unlevered free cash flows per asset and they were discounted at the R
SAETA YIELD COMPANY REPORT
PAGE 20/32 The wholesale market prices from 2017 onwards would be adjusted to the
inflation rate;
Regarding all the items of the Balance Sheet (Appendix 1) and Income Statement (Appendix 2), they have been forecasted based on the corresponding contracts or the remaining available information;
Recalling the difference between the regulatory useful life of wind assets (20 years) and their true useful life (25 years), it is important to highlight that during the last 5 years these assets only receive their market remuneration (through the sale of energy on the market) and are not entitled to receive any incentive, accordingly to the RD 413/2014;
As previously mentioned, the company have flat revenues, which are only slightly adjusted due to a small loss of the available production hours after the ramp-up phase of the assets (0.5% in the case of wind and 0.2% in the case of CSP assets).
Nevertheless, regarding the main risks and uncertainties that Saeta could face, it is important to stress that the company is subjected to a strict regulation that establishes caps and floors for pool prices and so it has a limited exposure to market price volatility. Additionally, 75% of the company’s bank borrowings is hedged through derivatives contracts (interest rates swaps), and interest rate risk is softened due to this. As regards to the O&M costs, the existing assets rely on well-proven technologies and the company have long-term contracts with several subsidiaries of ACS (like Cobra) – Saeta pay a specific price indexed to inflation and the last assume the maintenance capex needed (e.g. in the case of wind assets - scheduled and unscheduled turbine maintenance, supply of spare parts, monitoring and reporting services; in the case of CSP assets – ACS guarantees a predetermined annual efficiency). Because of the connection with ACS, one of the sponsors and main shareholders, there is some kind of reassurance that the assets will keep having a strong performance and high availabilities. In fact, the contracts also include penalties to the supplier if the availability decreases below a determined threshold, which strengthen the previous sentence. Additionally, it is also important to refer that it is not expected the company to incur in significant capital expenditures unless new regulation comes out6 - the maintenance capex is assumed by ACS and all plants are already in operation.
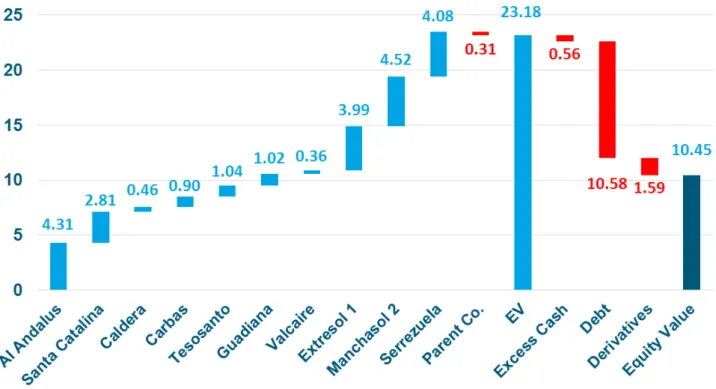
The detailed valuation of the initial portfolio is presented on the Table 4, at left, and Figure 22, on the next page:
6 "Future capital expenditures in 2015 will adapt the Al Andalus, La Caldera, Sierra de las Carbas, Tesosanto, Monte
Gordo, Santa Catalina and Valcaire wind farms to AENA (Aeropuertos Españoles y Navegación Aérea) requirements (navigation light systems) and adapt the Santa Catalina wind farms to reactive power requirements by the distribution company" (IPO Prospectus) - the company will incur in capex of €8mn in 2015.
Table 4: Valuation Initial Portfolio
Equity Value
Equity Value per MW
Al Andalus 79,042 317
Santa Catalina 107,331 998
Caldera 6,783 301
Carbas 20,717 518
Tesosanto 24,339 487
Guadiana 29,764 620
Valcaire 28,365 1,773
Extresol 1 103,526 2,071
Manchasol 2 146,994 2,946
Serrezuela 330,882 6,631
Parent Co. (25,504)
Total 852,239 1,248
Total per Share 10.45
SAETA YIELD COMPANY REPORT
PAGE 21/32 Figure 22: Sum-of-the-Parts Initial Portfolio
Source: Analyst’s Estimates
Considering all the above mentioned, considering the value of each asset which belongs to the initial portfolio, their sum gives a total value for the initial portfolio of 10.45€/per share (i.e. represents 92% of the target price). Therefore, the initial portfolio in a standalone basis offers a 23% upside potential (considering the last price of €8.52 at January 5, 2016). Therefore, even if the company would not acquire any of the ROFO assets, the Buy recommendation would still prevail.
Repowering the Initial Assets
The Initial Portfolio will continue operating 19 to 24 more years, depending on the asset. When the useful life of the assets ends, the company has two possibilities: proceed to the repowering of the plants, or drop those assets (which would worth nearly nothing by that time - only the land of Extresol 1 and Manchasol 2 belong to the company). A hypothetical calculation of the repowering of these plants has been made for future comparison purposes, considering that the investment and cash flows generated would be the same as the ones that Saeta had/will have. Even though these assumptions are quite unrealistic, they allow to assess whether Saeta would create or destroy value with the repowering (ceteris paribus).
Based on this assumptions, the IRR of this project (i.e. repowering the assets) would be 4.57%, which is above the RU of 2.8% and the project should be undertaken. If so, it would generate a Net Present Value of €145m, and if
Source: Analyst’s Estimates
SAETA YIELD COMPANY REPORT
PAGE 22/32 considered on the valuation it would represent €1.78 per share (Figure 23). However, this is just a hypothetical exercise and, as previously mentioned, a more conservative perspective has been assumed and this value has not been taken into account for the overall valuation.
Initial ROFO Assets
The initial ROFO portfolio of assets presents clear growth opportunities for Saeta to expand its current asset’s portfolio, as it is composed by other quality assets and can greatly act as a catalyst for the stock. As mentioned before, the initial assets owned by Saeta offer flat revenues and growth can only be achieved throughout acquisitions (i.e. third party acquisitions or acquisitions contemplated on the ROFO agreement). Therefore, the current agreement between Saeta and ACS/GIP, as well as the ability of the last ones to develop new high quality assets and include them in the ROFO agreement, can be a source of growth for Saeta.
Regarding the initial ROFO, the majority of the current ROFO assets just gives Saeta the right of making a first bid that can be accepted or not, as previously mentioned. The only ones which present true commitments on the sponsors’ side are the call option agreements. Thus, for Saeta’s valuation we just took into account the three assets in which Saeta Yield has call option agreements with ACS and GIP (i.e. Extresol 2, Extresol 3 and Manchasol 1) once the visibility on their final execution is substantially higher than on the remaining assets of the ROFO. In fact, the exercise of the first two call options has already been announced by Saeta’s management team on the 9M15 Results’ conference call.
These three assets don’t have public available information regarding its financial statements, so the methodology adopted for the initial portfolio of assets could not be followed on this case. The only information available is the one given by Saeta on the 9M15 results conference call: i) the expected CAFD before the costs of financing of €13m for the two assets; ii) the cost of financing of 9.30% which includes interests and the debt repayment; iii) the acquisition would be financed using the €43m cash available on the HoldCo and a debt level ranging between €50m and €100m - which would imply levering the debt-free assets that Saeta currently owns (Valcaire and Serrezuela). Therefore, for the valuation of these two call options, it has been assumed: i) a debt level of €100m; ii) it has been used a Flow-to-Equity model7; iii) a 5.8% cost of equity (RE). In fact, the RE used to discount these ROFO assets is the same of Saeta’s, because the
SAETA YIELD COMPANY REPORT
PAGE 23/32 systematic risk is similar to the ones belonging to the initial portfolio (expressed throughout the same βU), and it is expected that the financing structure of these assets will also be similar. However, regarding this last variable there are no available information in what concerns the exact value of the debt-to-equity ratio of the ROFO assets once the financial statements of these two assets are not publicly available, as previously mentioned.
For the third call option (i.e. Manchasol 1), it has been assumed that the CAFD level, debt and cost of financing would be equivalent to Extresol 3. These assets have the same strike prices, installed capacity and both are located in Spain. However, due to the fact that the available information regarding the value of Extresol 2 and 3 is given in a consolidated basis (i.e. the total CAFD of €13mn
and debt of €100mn are not split among both assets), it has been assumed that these values would be split throughout a weighted average based on the strike prices of Extresol 2 and 3 (i.e. €265mn and €275mn correspondingly)8. This assumption implies that higher strike prices are a consequence of higher equity values.
The detailed valuation of the initial ROFO portfolio is presented on the Table 5, at left, and Figure 24, below:
Figure 24: Sum-of-the-Parts Initial ROFO Portfolio
Source: Analyst’s Estimate
Considering all the above mentioned, the ROFO portfolio value is only 0.86€ of the target price (i.e. represents 8% of the target price). Thus, even though the ROFO assets bring clear growth opportunities for Saeta to expand its business and increase yields, it should not be the only focus due to the small contribution it has for Saeta’s Value.
8 Based on this methodology, the weights of Extresol 2 and 3 to the overall CAFD are 49% and 51%, respectively. Therefore, if Extresol 3 is used as a proxy of Manchasol 1, the CAFD before costs of financing is €6.62mn, and the debt level is €50.9mn. Following the same methodology and considering the same RE, the value of this call option is €23m or €0.29/per share.
Table 5: Valuation Initial ROFO Portfolio
Equity Value
Equity Value per MW
Extresol 2 22,923 458
Extresol 3 23,788 476
Manchasol 1 23,198 464
Total 69,910 466
Total per Share 0.86
SAETA YIELD COMPANY REPORT
PAGE 24/32
Potential for ROFO Additions
As previously referred, the initial ROFO portfolio can be a source of growth for Saeta, but it is equally relevant the ability of ACS/GIP to develop new assets and include them in the future on the ROFO agreement in order to fuel future growth. As explained before, on the section “Renewables: a Bet on the Future”, the future presents clear opportunities to renewables due to their increasingly profitability and strong bet made by Governments. Thus, the development of those kinds of assets is needed and their demand will increase in order to expand the installed capacity of renewable energy sources as well as to substitute the existing ones when they have reached the end of their useful lives. Therefore, it is expected that ACS/GIP can create value in the future with the development of these assets, due to the possible increase demand for such assets and ACS’s expertise as a world leading construction group.
Regarding Saeta, notwithstanding the benefits of all potential ROFO’s portfolio additions, there are no available information concerning potential ROFO additions or whether the future projects developed by ACS/GIP will be added. However, it is important to stress that on one hand sponsors have strong incentives to fuel Saeta’s growth, as long as it is beneficial for ACS and GIP shareholders (i.e. selling those assets to Saeta is capable to create higher value for ACS/GIP shareholders than selling them to other companies). On the other hand, for Saeta this agreement is profitable as long as it is value creative (i.e.
generates a positive NPV due to ROIC>RU). Hence, there is a trade-off between how much ACS/GIP can get if they sell those assets to other companies and how much additional value they can get from selling them to Saeta.
Therefore, it is expected that ACS/GIP will extend the pool of assets covered by the ROFO, as long as what they receive as dividends is higher than the difference between how much they could have received if they would have sell those assets to other companies and what they actually received from selling them to Saeta9. The dividends’ amount will depend on the value generated by tax shields and lower cost of debt (i.e. Saeta’s financing structure). Additionally, it is
expected that ACS/GIP will share with Saeta the absolutely minimum value needed to keep the YiedCo’s growth and shareholders satisfied. Thus, for Saeta this agreement should be value creative (in order to grow, as it is expected), even though not as much as for ACS/GIP.
Due to the lack of information regarding future ROFO additions, no additional value from this component has been considered for the calculation of the overall company’s value.