THIS REPORT WAS PREPARED BY FABIEN ARNAUD, A MASTERS IN FINANCE STUDENT OF THE NOVA SCHOOL OF BUSINESS AND ECONOMICS, EXCLUSIVELY FOR ACADEMIC PURPOSES. THIS REPORT WAS SUPERVISED BY ROSÁRIO ANDRÉ WHO REVIEWED THE
VALUATION METHODOLOGY AND THE FINANCIAL MODEL. (SEE DISCLOSURES AND DISCLAIMERS AT END OF DOCUMENT)
See more information at WWW.NOVASBE.PT Page 1/33
M
ASTERS IN
F
INANCE
EQUITY RESEARCH
We initiate the coverage of Pernord Ricard S.A. with a
HOLD recommendation. The price Target for the FY15 is 93.60€,
which represents an upside 5.74% of 5.08 EUR against the current
price. Including the expected dividends of 1.38€, the total expected return will be 7.30%
.
The year 2014 has been hard for the alcoholic beverage.
The new anti-corruption law in China have impacted the sales of premium like never before. As a result the sales in Asia were massively down for the biggest actors of the sector (Pernod Ricard net sales -13%).
However, first regain of growth is already visible in Q1 2015 in Asia Pacific and the Americas, sales are respectively up 4% and 3%, while the poor economic conditions continue to impact the EMEA region, -1% in sales.
Emerging market will keep bringing incremental sales,
as the purchasing power increases and consumer’s habit are changing, much higher sales are expected. Competition in this market will also be strengthen as it will be the fastest growing markets.
Company description
Pernod ricard was born in 1975 from the two French giants of that time the
companies Penord and Ricard. The company has since then accumulated the
success story by growing at an impressive pace, mainly driven by tactical and
strategical acquisitions. Seagram in 2000, Allied Domecq in 2005 and more recently Vin&Spirit in 2008 are the major names that got acquired by Pernod Ricard, each of
them bringing a consequent portfolio of well-known brands in the sector.
P
ERNOD
R
ICARD
C
OMPANY
R
EPORT
A
LCOHOLIC BEVERAGE
06/01/2015
S
TUDENT
:
F
ABIEN
A
RNAUD
[email protected]
Emerging market dependent
Complexity of increasing market share in a very
competitive environment
Recommendation: HOLD
Price Target FY15: 93.60 €
Price (as of 6-Jan-15) 88.52 €
Reuters: RI.PA, Bloomberg: RI:FP
52-week range (€) 78.82-96.23
Market Cap (€Bn) 23.35
Outstanding Shares (m) 263.31
Source: Bloomberg
Source: Bloomberg
(Values in € billion) 2013 2014 2015E
Revenues 8,58 7,95 8,19
EBITDA 2,41 2,02 2.22
Net Profit 1,21 1,03 1,13
Net Margin 14.1% 12.9% 13.8%
ROE 10.7% 9.0% 10.0%
ROA 4.2% 3.7% 4.1%
ROIC (%) 7.7% 6.7% 7.2%
EPS 4.58 3.90 4.30
P/E 19.1 22.2 22.0
PERNOD RICARD COMPANY REPORT
PAGE 2/33
Table of Contents
EXECUTIVE SUMMARY ... 3
COMPANY OVERVIEW ... 4
COMPANY DESCRIPTION ... 4
SHAREHOLDER STRUCTURE... 6
KEY DRIVERS ... 7
INCREASING CONSUMPTION PER CAPITA ... 7
DEMOGRAPHIC TREND ... 9
GAINING MARKET SHARES OVER DIRECT COMPETITION AND OTHER BEVERAGES ... 9
MERGERS AND ACQUISITIONS ... 9
ECONOMIC CONJUNCTURE ... 10
SEASONALITY EXPOSURE ... 11
STRENGTHENING COMPETITION ... 11
COMMODITY AND UTILITY PRICE ... 11
WORKFORCE COSTS ... 11
REGIONAL ANALYSIS ... 12
PERNOD RICARD ASIA PACIFIC ... 13
PERNOD RICARD AMERICA ... 14
PERNOD RICARD EMEA ... 15
THE SECTOR : BEVERAGES ... 16
SECTOR OVERVIEW ... 16
SPIRITS SUB SECTOR EVOLUTION ... 16
SPIRITS AND WINES SUB SECTORS OVERVIEW ... 16
SPIRITS SUB SECTOR MARKET SHARES... 18
WINES SUB SECTOR MARKET SHARES ... 20
COMPARABLES ... 21
PERNOD RICARD VERSUS PEERS ... 21
PERNOD RICARD RIVAL : DIAGEO ... 22
FINANCIALS ... 23
PROFITABILITY RATIO ... 23
COVERAGE RATIO ... 24
LEVERAGE RATIO ... 24
COMPANY RATING ... 24
VALUATION ... 25
VALUATION & WACC METHODOLOGY ... 25
GROWTH ASSUMPTIONS ... 26
SALES SENSITIVITY TO DEMOGRAPHIC GROWTH ... 27
GDP AND CONSUMPTION PER CAPITA GROWTH ... 28
SCENARIO ANALYSIS ... 28
FINANCIAL STATEMENTS ... 31
PERNOD RICARD COMPANY REPORT
PAGE 3/33
Executive summary
This report has the main objectives of developing a comprehensive analysis of the company Pernod Ricard S.A. and providing an investment recommendation based on the actual price and the possible return in the period of 12 months. Our valuation implies an upside potential of 7.30% leading to a HOLD recommendation. We used the sum of parts approach to obtain this result. Even though the core business stays the same through the different regions we believe that the potential growth and outlook for each region is inherently heterogeneous and required an individual valuation for a more accurate estimation. Therefore each region was individually assessed using the discounted cash flow methodology.
The analysis has highlighted some key components that will definitely play a wide
role in Pernod Ricard’s upcoming performances.
First of all after a deceiving year for the alcoholic beverage industry, mostly due to China new regulations toward opulent gifts and a moribund economic conjuncture, the first sales report have already highlighted a change for the better in the most dynamic market.
Emerging markets will play a larger role as most of historical core market for Pernord Ricard are already extremely mature and undergoing severe economic conditions. Emerging markets tend to westernize their consumptions habits as the country develop and thus bring more incremental sales to the sector. Moreover, more dynamic on a demographic standpoint the potential market consumer base is also growing at fast pace.
The capacity of Pernod Ricard to innovate its products, packaging and to offer alternative experience through digital communications will be the key of success in the years to come. The competition is fierce and the recent acquisition of UB group beverage division by the world leader of the sector Diageo will with no doubts change the game in Asia Pacific. M&A in the food and beverage industry is a quick way to grow market share and similar acquisition may occur in the upcoming year.
PERNOD RICARD COMPANY REPORT
PAGE 4/33
Company overview
Pernod ricard was born in 1975 from the two French giants of that time the companies Penord and Ricard. The company has since then accumulated the success story by growing at an impressive pace, mainly driven by tactical and strategical acquisitions. Seagram in 2000, Allied Domecq in 2005 and more recently Vin&Spirit in 2008 are the major names that got acquired by Pernod Ricard, each of them bringing a consequent portfolio of well-known brands in the sector. Therefore Pernod Ricard has been able to significantly increase its sales and market shares in the last ten years (figure 1 & 2).
Nowadays the company is the world co-leader of the wines and spirits market. French born, the company realizes now over 90% of its activities overseas where it has grown a strong brand network. Pernod Ricard has for long publicly affirmed its intention to become leader of the sector, and to do so the company bets on the premium segment, main driver of the spirit consumption growth worldwide (where Pernod Ricard is already the leader), and on 5 strategic leverages to ensure the sustainability of the business. The shift in policy toward more premium beverage can already be seen as the operating profit has strongly increased over the last decade (figure 3).
Company description
To ensure the consistency of its business Pernod Ricard has opted for a decentralized organization, giving the opportunity to each of its vessels to refocus on its core business.
The brand companies:
Each brand belonging to Pernod Ricard portfolio is overseen by a brand company. These companies are in charge to define the global strategy and brand standards to ensure the consistency of the brands. Moreover they also strongly interact with the market companies (see below) to adapt global strategy to local marketing. From an operation standpoint these companies are in charge of the production, and of their industrial facilities.
The market companies:
Market companies are 80 companies linked to region, Pernod Ricard Asia-Pacific, Pernord Ricard Americas, Pernod Ricard EMEA (figure 4 & 5). (Except for the two French market companies Pernod and Ricard). These companies have for main target to activate the global brand strategy within their region and also to supervise the regional and local brand activity.
Operating profit/Net sales
Europe
21,38%
America
27,03%
Asia Pacific
29,17%
Figure 1 : source Pernord Ricard Annual reports
Figure 2 : Pernord Ricard Annual reports
Figure 4 : Pernod Ricard Annual reports
PERNOD RICARD COMPANY REPORT
PAGE 5/33
The holding:
The holding defines the group strategy over three main axes: -Governance functions
-Cross-functional initiatives -Share resources
A well-structured Brand portfolio:
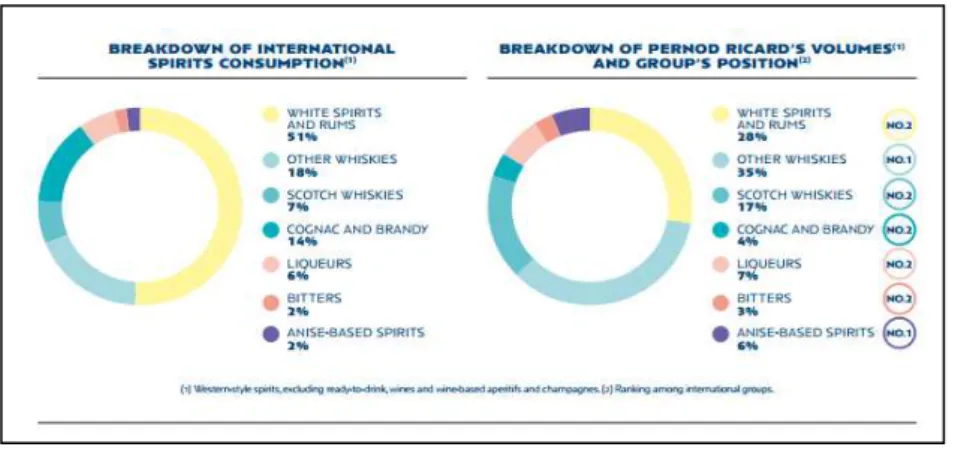
The primary aspect of the brand portfolio (figure 6&7) is to respond to what the consumer needs, each country has developed through time specific consumptions habits and even though these habits tend to change in some areas, it is a slow process and therefore not being able to offer the most demanded product would be a handicapped toward competitors.
Pernod Ricard has, mostly through M&A, extended its brand portfolio to match with consumers habits, and is now able to offer a wide variety of spirits and wines worldwide. The company on a global scale either stand in 1st or 2nd position for
each category of spirits (figure 7).
As part of Pernod Ricard premiunisation strategy the company has grown a wider portfolio in high end products, becoming the worldwide leader of the premium sector (figure 8).
Figure 7 : Pernord Ricard Annual reports Figure 6 : Pernord Ricard Annual reports
PERNOD RICARD COMPANY REPORT
PAGE 6/33
Shareholder structure
Pernod Ricard shareholder structure is composed of investment advisors and corporations. The structure over time has been quite stable and no major changes have occurred unless there was a major event such as an acquisition. The dividend payout to shareholers since the crisis has slightly increased years after years (figure 11), mostly as a result of better operating performances (payout ratio staying more or less stable over time, around 35.5%). The dividend still stand far from pre crisis level but after many years of consequent acquisition Pernod Ricard is now trying to reimburse its debt as fast as possible and to do so reduced the payout to shareholders. Moreover having more liquidity in the company is also a buffer against potential downside in a tumultuous market. We believe that this is the right strategy to ensure a sustainable business for the years to come.
The management team of Pernord Ricard is well known for its ability to perform, in less than decade the company has grown from a major regional player to global leader of the industry. The current CEO Pierre Pringuet (arrived in 2000 to co-lead with Patrick Ricard and then in 2005 after the acquisition of Allied-Domenecq became the CEO) has been a strong vector of this success story. Strong background and deep knowledge of the business (around 30 years in Pernord Ricard), we believe he is a gage of stability for the company.
Institutional Ownership Distribution % of ownership
Investment Advisor 64,17%
Corporation 18,01%
Holding Company 9,68%
Government 5,53%
Others 2,61%
Countries % of ownership
United States 42,14%
France 27,54%
Belgium 10,13%
Japan 7,21%
Norway 3,45%
Luxembourg 2,45%
Switzerland 1,65%
Others 5,43%
Geographic Ownership Distribution
Ownership Statistics % of ownership Shares Outstanding (M) 265,4
Float 76,7%
Ownership (Institutional) 62,77%
Ownership (Retail & Other) 37,02%
Ownership (Insider) 0,21%
Holder Name % of ownership
RICARD DANIELE 0,10%
PRINGUET PIERRE 0,09%
RICARD ALEXANDRE 0,01%
GERARD FRANCOIS 0,01%
GIRON CESAR 0,00%
Top insiders Figure 9 : Bloomberg
Figure 11 : Bloomberg
Figure 10 : Bloomberg
Figure 13 Bloomberg
Figure 14 Bloomberg
PERNOD RICARD COMPANY REPORT
PAGE 7/33
Key drivers
Increasing consumption per capita
Recorded consumptions per capita in occidental countries have shown to be stable over times and is mostly based on habits and traditions. As we can clearly analyze south Europe is mostly adept of wines while Eastern Europe is more spirits oriented. As for North America spirits and beers happen to be the leaders even though the growing production of wines in the U.S have made wine much more popular in this region of the world.
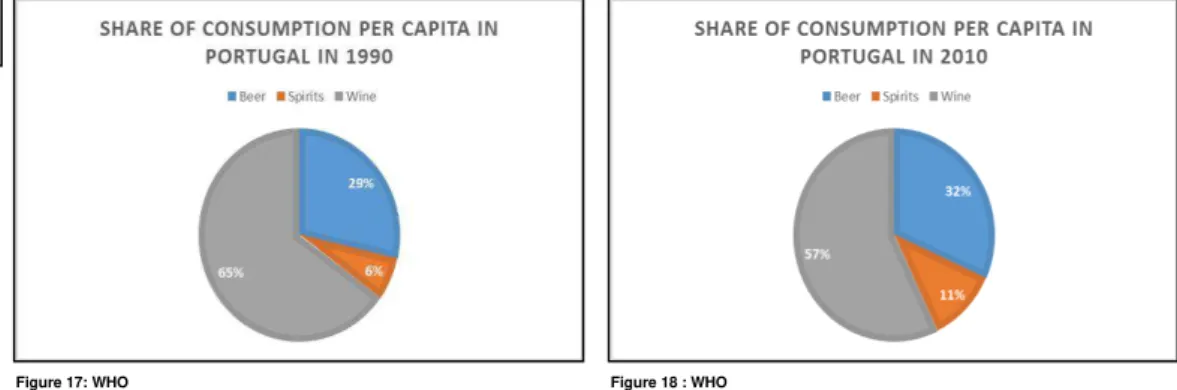
Taking three countries with known very different cultural heritage, Portugal, Russia and Germany we clearly see the differences in consumptions behavior (figure 16).
Enlarging the scope on Portugal over the two last decades we can see that the consumptions pattern did not change much, this pattern is also visible on most of the European countries and countries that were among the most developed in
the 90’s.
Mature markets are not expected to tremendously change their habits as this consumptions behavior can be observed over the last decades. The only countries that could see a drastic change of consumptions habits are the ones having significant inflow of migrants coming from the south. The outcome could either be a significant decline in consumption per capita or a strong change in consumptions pattern depending of the migrant’s origins.
The real opportunity comes from the emerging markets. It is nearly impossible to rely on the data from these countries as a significant part of the local consumptions is not recorded. Nevertheless as these markets have been so far underpenetrated we do expect significant growth in these regions (e.g. Asia & Africa). What we can also affirm is that middle and upper class from these regions tend to westernize their habits and thus their alcohol consumptions. Which lead obviously to incremental sales for the sector. For instance the current
Figure 15 : WHO
Figure 16 : WHO
PERNOD RICARD COMPANY REPORT
PAGE 8/33
consumptions per capita in Asia for spirits is estimated at 1.4 liter of pure alcohol while in Europe 2.5 is estimated1.
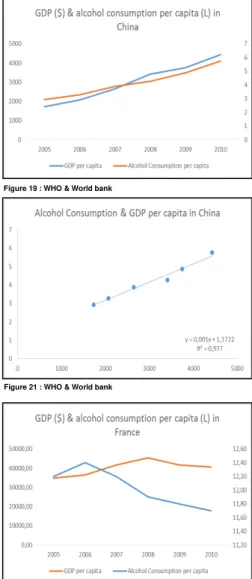
Taking as an example China, we can clearly see in figure 19 & 20 the increase in alcohol consumption per capita over the years being strongly correlated to the increase of GDP per capita over the same time period.
However one must not think that this behavior is unlimited in time and that by only projecting GDP per capita we could have a perfect metric to estimate the future alcohol consumption per capita. As mentioned above the GDP per capita and alcohol consumption relation is not linear on the long run. The increase in wealth will increase consumption to a certain point only. This fact is visible on figure 21 where we can clearly see that in France despite an increase in national revenue per capita recorded a decrease in consumption.
Lack of historical data and huge diversity of consumption behavior for alcoholic beverage between countries make it impossible to estimate a universal ceiling point where increase in income would not generate extra consumptions, one could therefore easily think that the behavior of food consumptions described in
Engel’s law could apply to alcoholic beverage consumptions, it is indeed partially true but need to be nuanced.
We should always bear in mind that we are talking about intrinsic consumptions
here and not about value or premium consumptions, as Engel’s law describe the
expenditures for food tend to grow slower than the increase of income past a certain level of income. The big difference between food and alcoholic beverage is the upscale potential of the products. For instance while a bottle of wines can
be bought for as cheap as 2€ it can also cost up to 15000€2 (Henri Jayer
Richebourg Gran Cru, Cote de Nuits), same goes for the best whiskeys which can be sold at more than 37 000€3 (The Maccalan Lalique 60 years old single
Malt Scotch). This represent a multiple of 7500 for the wines and roughly 3700 for the whiskey. Meanwhile, when we compare with premium food items the
multiple are much lower, 200gr of Kobe beef costs around 205€4 while a value
steak of 200gr would costs between 1.5 to 3€ giving us a multiple around 100. The conclusion is therefore that as food, alcohol expenditure would on average increase slower than the increase in income for developed countries (as the consumption per capita cannot increase to perpetuity). However due to the higher potential upscale on premium product, a shift from value to premium
1 Source : WHO
2 Source : http://www.wine-searcher.com/ 3 Source : http://www.wine-searcher.com/ 4 Source : http://www.steak-enthusiast.com/ Figure 19 : WHO & World bank
Figure 21 : WHO & World bank
PERNOD RICARD COMPANY REPORT
PAGE 9/33
products in developed markets would keep increasing the revenues of Pernod Ricard.
Demographic trend
As previously described, the consumption per capita can only grow to some extent, and even though the premiumisation would bring higher sales, if an economy is stagnant and does not increase the disposable income of its citizen there cannot be an increase of revenue for the company other than gaining market shares.
Therefore it is extremely important to also look at the demography of a country. Assuming a reproduction of the consumption behavior (as explained previously) an increase in demography represent a direct increase of the market size and therefore potentially an increase in revenue.
The global world population is expected to grow by 1.01% per year for the 20 years to come. Moreover the consumer base (+15 years old individual), as the world is ageing, is also expected to increase bringing an even larger number of potential consumers from 5.3 bn people today to 6.1 bn in 2025,+13% (figure 22). We will take a deeper dive into the regional numbers when we get to the regional outlook for Pernod Ricard.
Gaining market shares over the direct competition
and other beverage
One of the key of the upcoming years for Pernod Ricard is going to be its capacity to innovate and offer the consumers new products. The ways of doing so are limitless, starting from new trendy packaging up to tasty new flavors. Though a distinction need to be made for the premium segment that returns higher margin for the company. Here customers are expecting high end product with the finest quality. Innovation impact should thus play a major role on this segment sales.
Mergers & Acquisitions
As per the Food sector the beverage sector grows mostly through mergers and acquisitions. It is for the companies an easy way to quickly grow their brand portfolio and achieve strong synergies within their organizations.
The synergies gained through M&A allow more than often company to restructure their workforce around the usually shared cross functional department such as finance, HR, IT, global services and supply chain. In the beverage industry there is in most of the cases no gain made in the production process (beside raw
PERNOD RICARD COMPANY REPORT
PAGE 10/33
materials and transportation, where the company can through global tenders reduce its costs) because to keep the guarantee quality label you need to maintain the production in the same facilities and location. For instance buying a vineyard in California will not reduce the costs linked to the production process of your vineyards in France, while it can decrease your overhead G&A expenses.
When we look at Pernod Ricard’s costs over the last decade and we compare them to the revenues the group generated, knowing all the M&A operations Pernod Ricard did on this period of time (Allied Domecq, Vin&Spirit…), we clearly see the gains that these acquisitions brought to the company.
Furthermore, and it is certainly here that lies one of the best upside of doing M&A in the beverage sector, M&A transactions are regularly used to enter safely a new market. Meaning that by buying local, regional brands already known to the customers you spare the huge cost of a marketing campaign and remove a lot of uncertainty regarding the potential success of the products. Moreover the production, storage facilities and distribution network being already organized it is also easier and cheaper to later on introduce another product from your brand portfolio.
Mergers and acquisitions therefore bring huge incremental sales, and significant
cost cutting that enhance the company’s profitability.
Economic cunjuncture
Present in more than 80 countries, the group perfomance are correlated to the economic conditions of its main market, especially th U.S., China and France. In most of the countries the consumptions tend to decrease in recession period (figure 20), with high unemployment, inflation, and de facto reduced consumptions expenses. Moreover the currency volatility against the euro can strongly impact the final financial performance. During the last year part of the decrease in net sales also came from an adverse curency effect (-199 millions EUR). Even though Penord Ricard has shown resilience during the last crisis, it does not mean that further decrease in conditions in some core markets would
not heavily impact the company’s performance. For instance poor economic
conditions does not always mean reduced sales volume but can generate a shift in demand toward less premium items.
Figure 23 : Pernod Ricard annual reports
2005 2006 2007 2008 2009 2010 2011 2012 2013 2014
PERNOD RICARD COMPANY REPORT
PAGE 11/33
Seasonality exposure
By analysing the sales flow throughout the year we realized that Pernord Ricad is strongly dependant of the winter period results, many festivities throughout the globe coupled with gifts traditions have made this season crucial for the group performance. We believe that a deceitful season due to macro event could singularly endanger the group performances.
Strenghtening competition
The ongoing war for market shares in mature markets and the increasing competition in the emerging market has made it harder for Pernord Ricard to stand out of the pack. The competition pressure is expected to keep growing and would therefore results for Pernord Ricard in increasing marketing and advertisment expenses. We believe that this effect will undermined Pernod
Ricard’s profitability in the years to come.
Commodity & utility price
Pernord Ricard is exposed to the volatility of commodities and utilities such as oil, electricity and gas. A high increase would either result in a higher final price to the customers, thus decreasing the products attractivity, or a lower margin. Both situation would have a negative impact on Pernord Ricard’s perfomance. The huge decline in oil price seen recently, if it lasts, will with no doubt increase
Pernod Ricard’s margin as its carriers will accordingly decrease their prices. Regarding agricultural commoditiy, Pernord Ricard has an advanced hedging strategy that offset most of the risks. However like for currency exchange rate the company is not completely protected against strong market change.
Workforce costs
We strongly believe that increasing purchasing power in emerging countries will also lead to an overall increase in payroll for Pernod Ricard’s workforce located in these countries.
Cost center % of total price
Liquid costs 15% Packaging costs 55% Direct costs 10% Indirect costs 20%
Spirit average cost structure
Figure 24 : Remy Cointreau report
PERNOD RICARD COMPANY REPORT
PAGE 12/33
As long as the increase in payroll is made accordingly to the variation in
purchasing power there will be no incidence on Pernod Ricard’s profitability.
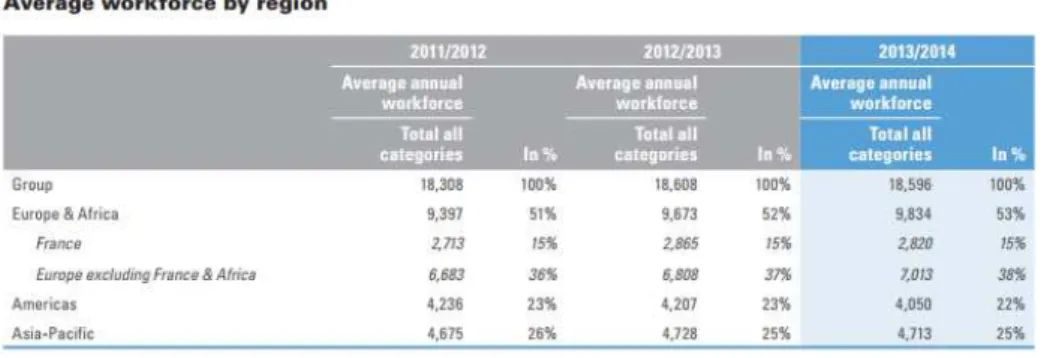
However, at the moment the workforce in Asia represent around 25% of the total workforce but only 22% of the payroll (figure 26). Recent uprising regarding worker conditions in many emerging countries led us believe that minimum wages should increase in the years to come.
The institution of a minimum wage or its sudden increase, would most likely be offset locally by the increase in purchasing power. However, as there is no possibility for the company to relocate production site (for the reasons mentioned above) the increase in labor in one country would decrease the margin on the products when it comes to exportation (purchasing power does not increase at the same pace everywhere around the globe). Pernod Ricard would also have the possibility of increasing its price, giving the adverse effects already discussed.
Regional analysis
Pernod Ricard relies on its core product to perform worldwide, either with its value or premium brands.the company also use a wide portfolio of local/regional brand target more specific market.
In the last years Pernod ricard has been heavily challenged on its main core markets. As a result Pernod Ricard has lost market share in the early 2010 before stabilizing for the past 3 years at a constant level. Market share are not widely volatile and are only strongly impacted when an event that could be qualified being a game changer occurs (i.e. major acquisition of a competitor).
Figure 26 Pernod Ricard annual reports
PERNOD RICARD COMPANY REPORT
PAGE 13/33
Currently Pernord ricard stands in the top 3 market holders for spirits in North America and Europe (respectively 3rd and 2nd position)5.The maturity of these
markets makes it difficult to significantly grow sales. However both of these market present opportunities of acquisitions.
Pernod Ricard Asia Pacific :
Net
sales 2014/2013 -13%
Despite a moribund economic conjuncture Pernod Ricard has for the past years shown resilience especially when it comes to Vodka (Absolut +38%), Champaign (Perrier-Jouët +26%) and Whiskey (Jameson +14%). This market has an extremely high potential on the short and long term. First for its demography expected to grow at yearly rate of 1.8% for the 20 years to come and the increase of its consumer base (+15 years old inhabitant) by 2.56% from 75.03% to 77.59% on the same time period (figure 29). Moreover, the incredible GDP growth most of the countries within this region enjoy shall result in a strong increase in disposable income for the populations, thus generating extra sales. However for the first time in 10 years Pernod Ricard sales have slow downed, due mainly to destocking and the new Chinese policy regarding extravagant expenses. To regain momentum the company now bets on two trends, the increasing influence of women clientele and the increasing opportunity of consumptions during the meals. The women clientele has drastically increase its purchasing power over the least years and is more and more a vector of decision when it comes to picking alcoholic beverage. As a result Pernod Ricard has recently launched many new products with fruity taste to seduce these new customers. Moreover, Pernod Ricard has been for long studying how it could better match its products and the Asian cuisine. Therefore Pernod Ricard has decided to launch new spirits and wines with tastes being more in adequacy with Asian traditional cuisine.
Results are already visible, sales in the last report (Q1 2015) were up by 4%, however the upcoming celebrations of Chinese New Year will definitely tell us a lot more about the sustainability of the sales for the year 2015.
Meanwhile in the Pacific, Pernod Ricard keeps increasing its sales, mostly supported by the success of local/regional brand but also by adapting global brand to the local market by doing strong and meaningful co-branding (i.e. Absolut Oz).
The outlook for the region is extremely positive, the fast growing demography coupled with the adapted marketing strategy should ensure the company sales growth for the years to come. Competition however is fierce and the recent
5 Source : Bloomberg
Figure 28 : Pernod Ricard annual reports
PERNOD RICARD COMPANY REPORT
PAGE 14/33
acquisition of UB group beverage division by Diageo may makes the region even more complex.
Pernod Ricard America :
Net sales 2014/2013 -7.51%
Pernod Ricard Americas hold certainly the most complete portfolio of the entire business. Based on strong global and local brand it has achieved for the past years satisfying growth. The complexity of the region composed of countries with a very diviersified level of development is a challenge for the company. In the most mature markets Pernod Ricard has been pushing hard using digital technologies to strenghten sales. While on the other markets the strategy stays more based on local or regional brands.
Strong demographic growth is forecasted, especially for south America, overall the region is expected to grow 1.23% per year for next 20 years and increase its consumer base by 2.04% from to 61.25% 63.29% (figure 31).
The outlook for the region is positive, in North America the company will keep betting on its core brands and innovation to enlarge market shares, meanwhile in South America the company is targetting key campain to fidelise its clientele. The latest sales result (Q1 2015) were hilighting a 3% increase in sales.
Penord Ricard EMEA :
Net Sales
2014/2013 -1.91%
Europe is in a tumultuous mutating process, the trend of living healthier is stronger than ever and many countries are already implementing significant regulations to limit the consumption of alcohol (i.e. new tax on final customers, lowered alcohol limit while driving, limited distribution of alcohol selling licenses…). In response to this hostile environment the strategy of Penord Ricard has been driven by three main axes, premiunisation, innovation and digitalisation.
The premiunisation of the portfolio is the creation, or acquisition of new brand having a higher quality and therefore higher prices. These products generate more margin and as we previosuly discussed, on a mature market since it is impossible to increase more the intrisic consumption per capita Pernod Ricard needs to make the customers shift toward more high-end products and also try to conquer new market shares.
Innovation can either be a brand new product or a new packaging design. Packaging is more than crucial for customers, not many customers are experts when it comes to spirits or wines differences and therefore presenting innovative packaging is a key to attract more customers.
Figure 30 : Pernod Ricard annual reports
Figure 31 : WHO
PERNOD RICARD COMPANY REPORT
PAGE 15/33
Digitalisation is the latest trend seen in the economy with the capability of the companies to get fresh insights straight from their customers through social media. The ability of Pernod Ricard to manage these key datas will be crucial as its future strategy will heavily depends on the analytics based on these datas.
Strongly impacted by the 2008 financial crisis Western Europe is now starting to retrieve some stability. It is still too early to speak about full recovery, in south Europe for instance sales are not expected to increase strongly anytime soon. However North Europe have started showing up some signs of recovery with the U.K. as spearhead, while France and Germany seemed to have mostly recovered but are now stagning.
After many years of strong sales growth in Eastern Europe, mainly due to the westernization of the middle class, the sales growth now is closer to western Europe. The Ukrainian crisis and the current bad shape of the Russian economy (driven by the international sanctions) have been a huge blow to the sales in Eastern Europe and any escalation of the conflict could have disastrous consequences.
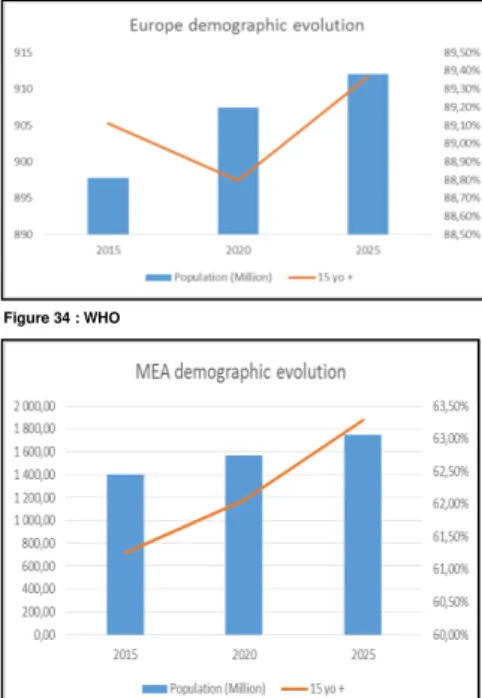
With its economies crippled by debt Europe is heading toward hard times, the demography forecasts are betting on a really small growth (0.15% yearly, figure 33) of the current population and for some countries the curves of number of birth and death have already crossed. Many countries only stay afloat thanks to a strong migration inflows but even with that will not be able to hold a significant demographic growth. However part of the region revenues come from a much more economically and demograpically dynamic region, MEA. Untill now, Africa remained an underpenetrated market, which with the growing average disposable income per capita (4.7% average GDP growth in 20136) coupled with
the strongest expected demographic gowth for the years to come (2.55% yearly growth expected) will drastically increase the consumer base and thus incremental sales. We believe that Pernod Ricard due to historical facts is one of the most well placed actor of the sector to take advantage of this growth. We based this assumptions on the fact that most of the subsaharian countries were french colonies and still use french as official language. Moreover there are specific trade partnerships undergoing between these countries and Europe7 that
would help Pernod Ricard to implement its business.
The outlook for the region is for the short term stable (most recent sales report (Q1 2015) was showing -1% in sales), decreasing tension with Russia and recent signs of improvement in Ukraine have led us think that eastern Europe growth
6 Source : World Bank
7 Source : Cotonou Agreement Figure 34 : WHO
PERNOD RICARD COMPANY REPORT
PAGE 16/33
should soon be back. However Western Europe should not show any improvement on the short run. On the long term the increasing potential of the MEA countries is definitely going to be a game changer and could redefine the world spirits & wines producer hierarchy.
The sector: Beverages
Sector overview
The beverage sector can be broken down in 3 sub-sectors:
Sodas: This sub-sector is mostly dominated by the North American giant such as Coca-Cola, Dr. Pepper and Monster Beverage.
Beer: The actors of this sector are more spread over the globe and is mainly driven four leaders: Anheuser-Bush, SABMiller, Heineken and Carlsberg.
Spirits: Ruled by big companies owning big brand portfolio. The main player of this sub sector are Diageo, Pernod Ricard and UB Group.
Spirits sub sector evolution
The sub sector has grown despite poor economic conditions. Since 2010 a growth of 49.88% of the stock prices have been recorded. However, even though the sector recovered really quickly from the crisis in 2008, and over performed the S&P 500 from 2010 to the end of 2013, a big slowdown driven by a catastrophic year in China and the saturation of the most developed market has undermined the returns over the period.
Spirit & wine sector overview:
The global alcohol consumption has been strongly challenged lately, as a result of many global factors. Consumptions per capita has only slightly increase since 2000 (4.74 liters per capita in 2000, 5.21 liters per capita in 20108). The weak
consumer spending in some major markets still impact the sales. Even in the countries having the most recovered from the previous crisis the spending are not higher than they used to be and thus do not offset the loss from struggling markets. High unemployment rates combined to decreased consumer confidence are two factors that may hinder the sector growth for the years to come. The major hopes comes from developing countries that could bring incremental spending for the sector.
8 Source : WHO
Figure 35 : Bloomberg
PERNOD RICARD COMPANY REPORT
PAGE 17/33
The world population is slowly becoming more and more health conscious. In the most mature market a decrease or stagnation in consumption per capita has already been noticed (figure 37). Tighten budget policy have pushed forward the government to advertise a healthier way of living to reduce the diseases linked to junk foods and overconsumptions of alcohol. According to the world health organization, up to 5.1% of the total diseases are linked to alcohol consumptions. This directly threatens the global consumptions that could start now globally decreasing.
Religious belief have a huge role to play on the global consumptions as well, as the regain of extremisms have been seen in most of the world main religions lately. We expect it to have a negative impact on the world global consumptions. Mostly due to the fact that every major religions condemn the consumptions of alcohol or allocate a specific place for it.
Politic actions are also expected to be taken, advertisement of alcohol is already strongly regulated and further steps could be taken to decrease the public exposure to alcohol marketing. For instance in France advertisement for alcoholic beverage is strongly regulated by the law Evin (Article L.3323-2 of the code of public health). Moreover raising tax on specific alcoholic like it has been done in France again (i.e. Beer taxes) is also a threat that needs to be taken into account. Increasing tax and reduce the market exposure of alcohol beverages would have the double effect of helping the countries having troubles stabilizing their budget and also reduce the alcohol consumptions, thus decreasing the diseases linked to alcohol and therefore the healthcare expenses linked to alcohol diseases.
The non-recorded consumption (home production) is expected to decrease in developing markets as the consumer purchasing power increase. However strong political actions taken against alcohol could stimulate the rise of non-recorded consumptions in more mature markets.
Finally, counterfeiting, as the sector will rely more and more on emerging markets to grow its sales, is facing major risks. The consumers are new to most of the products and are easily fooled into buying counterfeited products. The lack of connoisseurs will handicap the sales in this country for the years to come until the public develop a better knowledge of the products.
As a result of all of the above we could easily imagine a worst case scenario where countries threat to put a ban on alcohol (i.e. Indonesia in 2013). Either motivated by health issues or religious beliefs.
Figure 37: WHO
2000 2005 2010 France 13,63 12,20 11,70 Germany 12,91 11,68 11,21 Portugal 12,13 12,06 10,84 Russia 10,12 11,56 11,12 United Kingdom 10,78 11,23 10,21 United states of America 8,21 8,52 8,55
PERNOD RICARD COMPANY REPORT
PAGE 18/33
Spirits sub sector market shares
Spirits: Global market share
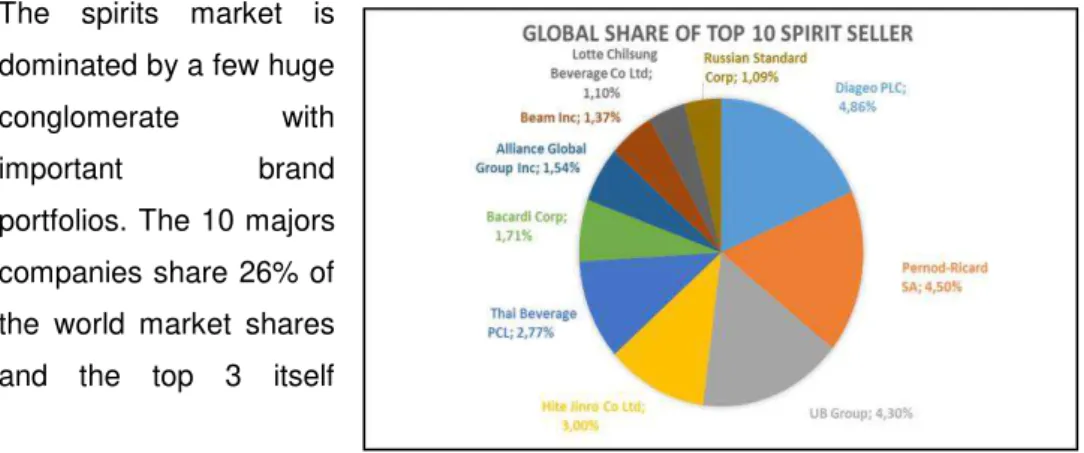
The spirits market is dominated by a few huge conglomerate with
important brand
portfolios. The 10 majors companies share 26% of the world market shares and the top 3 itself
represents 13.66%. The other actors of the sector are usually either single brand companies or have a limited portfolio. These smaller companies are often targeted by the larger conglomerates for potential acquisitions. Either because the small companies own successful brands or underexploited brands. Acquisition are often use for new country entry because brand exposure within a
market is key to sustain sales and on the other hand it’s a huge saving in terms
of marketing expenses.
Spirits: Europe Pan
market share
In Europe the picture is different, we have fewer companies having larger market shares. Europe being a mature market,
company to be
competitive have to cut
cost down and try to find synergies through M&A. The top 10 companies here capitalized 46.46% of the market shares, and the top 3, 30.39%. In this market the main players are Pernod Ricard and Diageo, as they represent 26% of the full market.
Figure 38 : Bloomberg
PERNOD RICARD COMPANY REPORT
PAGE 19/33
Spirits: North America market share
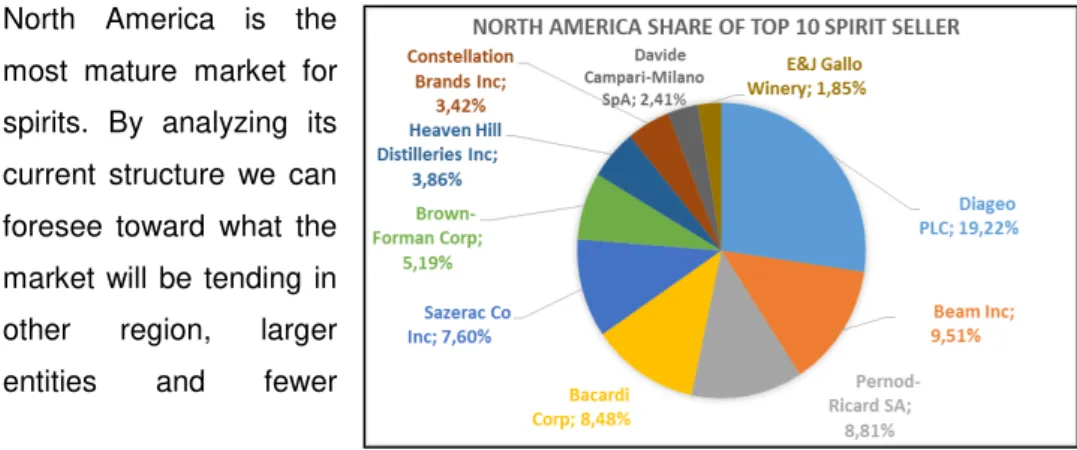
North America is the most mature market for spirits. By analyzing its current structure we can foresee toward what the market will be tending in other region, larger entities and fewer
smaller competitors. The top 10 companies represent 70.33% of the total market and the top 3 only 37.53%. This market is heavily dominated by Diageo and its 19.22% market share.
Spirits: Asian-Pacific market share
The Asian-Pacific market
offers the best
opportunities of growth in the sector. Composed of many emergent country there is a lot to gain from increasing purchasing power and change in
customer’s consumption habits. The top 10 companies represent 31.78% of the
total market and the top 3 17.61%. The market is led by 3 major companies, UB group (acquired by Diageo in May 2014), Hite Jinro and Thai beverage.
Wines: Global market share
The wine market is much more homogeneous than the spirit one. The top 10 brands cumulate around 12.77%, while the top 3 cumulate 6.43%.
Figure 40 : Bloomberg
Figure 41 : Bloomberg
PERNOD RICARD COMPANY REPORT
PAGE 20/33
Wines sub sector market shares
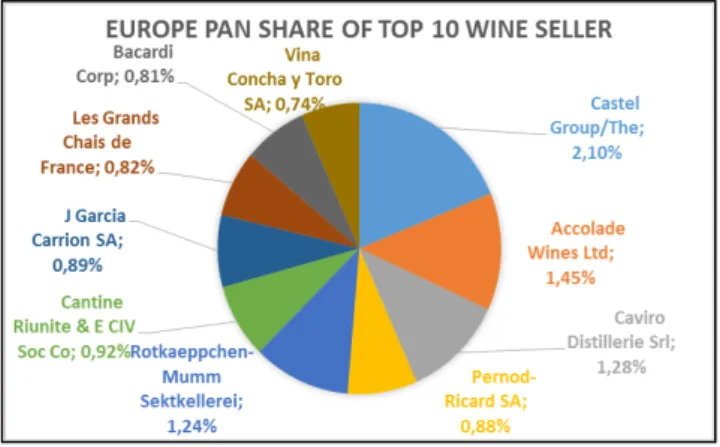
Wines: Europa Pan market share
The top 10 companies gather 11.13% of the total market share. The top 3 companies. 4.83%
Wines: North America market share
North America wine market is composed of larger companies. The 3 market leader in North America are also the global leader. The top 10 companies represent 64.66% of the market, and
the top 3 46.42%
Wines: Asia Pacific
market share
Top 10 companies represent 12.87% of the full market. The top 3 companies represent 5.61%
Figure 43 : Bloomberg
Figure 44 : Bloomberg
PERNOD RICARD COMPANY REPORT
PAGE 21/33
Comparable
Pernod Ricard is with Diageo the most global company of the sector. Both companies are the only ones to figure among the top 10 performing companies in all the regions. Moreoever Diageo and Pernod Ricard are also very similar on their offer as they both enjoy a really complete brand portfolio made of some of the most recognized brand in the beverages sector.
Other companies of the sector do not fully compare to Pernod Ricard, as they are usually more regionally oriented and thus present a brand portfolio less developped. However some companies have shown in the recent years some interesting growth on their local market and seeing them expanding worlwide in the years to come would not be surprising.
Pernord Ricard versus peers
We start the comparable analysis with an outlook of the peers market perfomance since the end of 2012 (figure 46). Brow-Forman is the company that have the most performed over the last two years returning over 50.24%. Remy Cointreau has been the lowest performer with a strong negative return -28.43%, its sales have been crippled by a really low performance of Cognac in China. Pernod Ricard arrives in second position with a return of 13.98%.
Looking at the P/E ratio of the sector (figure 47) we realize that Pernod Ricard is below the sector average (25 versus 46.2) but stands close to its peers. Higher P/E ratio are suppose to translate in higher expected earning growth for the future, which explains why company having strong position in Asia and south America tend to have higher P/E ratios (Silver Base Group is for instance a growing distillers in China). Higher expected futur revenues can also be explained by companies being leader in a certain type of alcohol and that have not given full visibility of the product yet on a wider scale.
Within its market Pernod Ricard is a company that, thanks to its wide a well built brand portfolio, can target every type of customers on the various kind of wines and spirits. However it is also true that Pernod Ricard do not propose super value product and on average its product mix is considered being premium (from standard brand like ABSOLUT, to more premium brand like Martell). This gives Pernod Ricard a clear advantage on more developped market with higher purchasing power. As a result and it is visible on figure 48 Pernod Ricard presents one of the strongest operating margin of the industry. This is mostly explained by its premium strategy but also its ability to manage costs efficiently. However we also notice that the difference between Pernod Ricard Operating
Figure 46 : Bloomberg
Description P/E ROE %
Silver Base Group 86,7 2,92%
Rémy Cointreau 52,3 5,22%
Beverages - Wineries & Distillers 46,2 17,00%
Corby Distilleries 29,8 10,84% Brown-Forman Corporation 29,4 34,14% Thai Beverage PLC 27,7 22,72%
Pernod Ricard 25,0 8,95%
PERNOD RICARD COMPANY REPORT
PAGE 22/33
margin and Net margin is among the highest of the industry. This is due to higher taxes and a more levered capital structure than the competition (average D/E9 in the industry being 27.56% and average tax rate 10.72%10, while Pernod
Ricard D/E stands at 65.88% , and tax rate at 20.06%11).
Pernod Ricard faces a strong competition on every market and sub sector (see chaper : Sub sectors). The competition however varies a lot depending on the location and the type of products, for instance in France Pernod Ricard biggest competitor is Remy Cointreau, while on an european scale Remy Cointreau is much smaller than Pernod Ricard. There is at the moment in the alcoholic beverage industry only one peer that can fully compare to Pernod ricard which is Diageo. Diageo represents 4.86% of global share on the spirit sector, to which should be added 4.30% coming from UB group beverage division (Diageo acquired the division), totalizing therefore 9.16% and making it the world leader of the spirit market. For comparison Pernod Ricard stands in 2nd position with
4.50% of the global shares while Hite Jinro stands 3rd with 3%.
Pernod Ricard rival : Diageo
Diageo (LSE: DGE; NYSE: DEO)
Diageo is an English company and currently the worldwide leader of the spirits market. The company was created in 1997 after Grand Metropolitan and Guinness PLC merged. Mostly spirit oriented the group also own major beer and wine brands.
Diageo as the rest of the sector has suffered during the last year with a 9.25% decrease in sales. However due to a good cost management the current year still resulted with a higher EBITDA versus 2013. Overall the profitability of the
9 Where D is considered being only long term debt 10 Source : Bloomberg
11Source : Analyst’s estimates
Brand Portfolio
Beer Bourbon Gin Rhum Tequila Vodka Whisky Wines Others
Guinness Bulleit Gordon's Captain Morgan Don Julio Smirnoff George Dickel Sterling Vineyards Baileys
Red Stripe Tanqueray Bundaberg José Cuervo Cîroc Crown Royal Beaulieu Vineyards Archers
Smithwick's Pirate Island Johnnie Walker Blossom Hill Pimm's
Harp J&B
Kilkenny Figure 49 : Bloomberg
Figure 50 : Diageo annual reports
Figure 48 : Yahoo finance
Pernod Ricard Diageo Remy Cointreau Thai Beverage Constellation
Brand Inc. Hite Jinro
Profit Margin (2014) 12,79% 21,92% 5,90% 13,55% 6,57% 2,86%
PERNOD RICARD COMPANY REPORT
PAGE 23/33
company in terms of margin stayed stable while ROE, ROIC, ROC and ROA were down due to poor operating performance.
When comparing with Pernod Ricard we notice that Diageo has a much higher Net Margin (figure 48), which with higher sales translate in significant higher earnings. Diageo enjoys stronger sales in mature market such as the U.S. and Western Europe than Pernod Ricard and used to be less present in developing countries region like Asia-Pacific and Africa. However the recent acquisition of United Spirits Limited, the Indian powerful distiller shows that Diageo is now looking toward Asia and will be a serious competitor in the area (UB accounted for 7.46% of the spirit market share in Asia Pacific).
Financials
Profitability ratio
Pernord Ricard financials performance has shown to be resilient to economic bad conjuncture since 2008. Its sales only really contracted twice since the crisis, in 2010 and in 2014 (figure 52 & 54). However this has to be nuanced due to the fact that in the year 2008 Pernod Ricard acquired Vin&Spirits, bringing therefore incremental sales compare to prior years.
Nevertheless Pernod Ricard did not suffered too much from this economic turmoil and was much more impacted by the change in gift policy made by China last year. Pernod Ricard in China is strongly positioned on premium products,
for instance with its Cognac brand Martell. Since 2013 the Chinese government,
successively denounced to be corrupted, has put in place a list of “do’s and
dont’s” also referred to as the anti-extravagance policy. This basically restricts the members of the communist party from offering lavish gifts to their guests. The impact on Pernod Ricard has been a diminution of its sales on its more premium items (-9% on Martell12).
As part of the company’s plan to become more profitable we clearly see that the
gross margin has positively evolved through time and should keep improving in the years to come (figure 53). Pernod Ricard has made pushing costs down one of its top priority and results were already visible until 2013. However as previously mentioned the terrible results of the Asia-Pacific division has crippled
12 Source : Pernod Ricard annual report 2014
Diageo financial results (USD)
2014 2013 2012
Turnover 16,7 17,7 17,1
Growth YoY -0,1 0,0
-Gross Profit 10,1 10,8 10,3
Gross Margin 60,73% 60,91% 60,41%
EBITDA 6,1 5,9 5,7
Margin 36,57% 33,28% 33,43%
Net income 3,7 4,0 3,3
Net margin 22,18% 22,56% 19,35%
Adjusted EPS 1,6 1,6 1,5
Figure 51 : Bloomberg (Bn USD)
Figure 53 : : Bloomberg Figure 52 : Bloomberg
PERNOD RICARD COMPANY REPORT
PAGE 24/33
the profitability in 2014. In reaction, Pernod Ricard had cut down its workforce by 5%, around 900 jobs13.
Return on assets is stable over time (figure 55) which when considering the change in economic conditions highlights the robustness of Pernord Ricard. Return on equity has been decreasing over the period (figure 54) this due to a strong increase in retained earnings. Pernod Ricard aims to reduce its financing by debt and as a result would rather use internal financing when possible.
Coverage ratio
14Pernord Ricard is a rather liquid company but does face risk when it comes to short term liquidity. Even in hard times Pernod Ricard current ratio stayed at least above one (figure 56), meaning the company would be able to repay fully its short term liabilities. However the quick ratio highlight that a significant part of Pernod Ricard current assets are inventories. This is logic regarding Pernod
Ricard’s industry as many products need to mature before being sold, which
means that they will not be available for sales before a given time period. This exposes Pernod Ricard to liquidity risk as the company needs to pays the costs of this products way before selling them in the market.
Leverage ratio
As previously mentioned Pernod Ricard aims to reduce long term debt in its capital structure, as a result we clearly see an improvement of its leverage ratios since its latest acquisition in 2008-2009 (Vin&Spirit). Meaning that the equity size tend to grow in the capital structure, increasing the value for shareholders.
Pernod Ricard is a healthy company that does not struggle to generate enough cash to pay its interests (figure 57). With the current trend and what has been announced by the company’s upper management the leverage ratio should slightly decrease and then stabilize. However we believe that in case of an acquisition Pernod Ricard would with no doubt see its leverage ratio increase as it happen in 2009 after Vin&Spirits acquisition.
Company rating
Due to its past performances and the resilience it has shown Pernod Ricard has been awarded with good rating by the rating agencies. The current rating reflect
Pernod Ricard’s capacity to meet its financial recquirements but also highlight as
13 Source : The Wall Street Journal (August 28th 2014)
14 Measure the company capability to meet its financial obligations Figure 55 : Bloomberg
Figure 56 : Bloomberg
PERNOD RICARD COMPANY REPORT
PAGE 25/33
mentionned previously that its business stays strongly correlated to economic cunjuncture and that in case of a significant choc the company woulf face tangible difficulties to keep meeting its financials recquirements.
Valuation
Valuation & WACC methodology
In order to assess the value of Pernod Ricard we decided to use the sum of parts
approach (SOP). We have evaluated each region of Pernod Ricard’s business
and used the discounted cash flow methodology to arrive to a final valuation. We believe that due to independently inherent factors the business in each region, even though they share more or less the same core products, are strongly heterogeneous. By studying the main key drivers in each region we have come to the conclusion that the perspective of evolution were too far apart to evaluate the entire company only based on a common expected growth. We therefore for each region used the discounted cash flow (DCF) approach, discounting all the estimated future cash flow at different WACC15.
We started the analysis by using the unlevered beta of the sector 0.91 (average based on 19 companies, levered beta being 1.14 with D/E ratio of 27.56% and average tax rate of 10.72%).
Based on the sector average we were able to estimate the levered betas for each part of the company depending on its D/E ratio.
We then computed the CAPM to find Re, for the risk free asset we considered a
long term euro bond, as Pernod Ricard’s core business is still located in Europe, 10 years AAA bond with a 2.242% coupon. For the market premium we used 5.80% in accordance with literature.
15
S&P BBB- Date 03-10-2011 Outlook STABLE
Moody's Baa3 Date 08-09-2011 Outlook POSITIVE
Fitch BBB- Date 23-10-2012 Outlook STABLE
Figure 58 : Bloomberg
Figure 59 : Analyst’s estimates
Pernod Ricard
1,39012
EMEA division
1,42555
ASIA-PACIFIC division
1,31149
PERNOD RICARD COMPANY REPORT
PAGE 26/33
Therefore after computing the CAPM we obtain the following Re:
Pernod Ricard has expressed its target to keep a stable debt/equity ratio over time and therefore the debt/equity ratio of 2014 for each region have been used to compute the WACC. Moreover Pernod Ricard tax rate has been stable around 20% for the last years and we therefore considered the final rate of 20.06% (2014) to compute the WACC. Regarding the cost of debt we used the average coupon of long term bonds corrected with RR, giving us 5.47% for Rd.
Growth assumptions
In order to estimate the potential final value of Pernod Ricard we have conducted many analysis to forecast sales and costs, using the most important key drivers described initially. Namely for the sales, consumption per capita, demographic growth, revenue per capita (represented here by GDP per capita) and market share. We have then submitted to various scenarios these drivers to give a more realistic reflection to the final valuation.
Before starting the analysis and the valuation, see below the metrics for the year 2014 per region
Figure 60 : Analyst’s estimates
Figure 61 : Analyst’s estimates
Re
Pernod Ricard
10,48%
EMEA division
10,69%
ASIA-PACIFIC division
10,03%
AMERICA division
10,63%
WACC
Pernod Ricard
6,98%
EMEA division
6,65%
ASIA-PACIFIC division
7,21%
AMERICA division
6,85%
*Europe and MEA are considered together ** Europe and MEA are considered together ***No data
****No data
Figure 62 : WHO, World bank, Analyst’s estimates
Population 15+ GDP per capita (USD) Market share* Sales 14/13
(Bn EUR)**
Spirit consumption (liter of pure alcohol)
per capita***
Wine consumption (liter of pure alcohol)
per capita****
EUROPE 898 926 561,00 27 143,49 12,65% 2,80 2,50 2,50
ASIA-PACIFIC 3 919 449 712,00 5 179,30 8,81% 3,03 1,40 0,40
AMERICA 966 684 505,00 25 344,36 2,57% 2,14 2,90 0,70
-PERNOD RICARD COMPANY REPORT
PAGE 27/33
Sales sensitivy to demographic growth
The analysis below is made for the solely purpose to give an indication of the sensitivity of each region to the demographic growth. In order to only see the incremental impact of demography, the consumption,GDP per capita and market shares are assumed constants. The advantage of demography relies mainly in the forecast accuracy compare to other variable as for instance market shares that are subject to much more uncertainty.
EMEA
The forecast of the world health organization for both Europe and MEA are respectively 0.13% and 2.55%. We therefore believe that the value
hilighted in figure 63 would be the most likely to occur, giving Pernord a yearly average growth of 1.3% of its sales for the 5 years to come.
ASIA-PACIFIC
The WHO forecast is betting on a 1.08% demographic growth for this region which would translate for Pernod Ricard as it is visible in figure 64 to an average yearly growth of its sales in the region of around 0.80%. Of course for Asia-Pacific this would
be a really bearish forecast as the region is undergoing huge changes in consumptions habbits and income per capita.
AMERICA
WHO forecasts are estimating a growth of 1.23% for the years to come, second most dynamic demography after Africa mostly driven by a strongly emerging south America. Therefore the forecast yearly growth for America would be
0.96%. Which as well as for Asia Pacific would be bearish taking into account the
Figure 63 : Analyst’s estimates
Annual growth in MEA Annual growth in Europe Estimated sales 2015 Bn EUR
Estimated sales 2020 Bn EUR
2015 vs today 2020 vs today 1,50% 0,02% 2,83 2,93 0,91% 4,66% 1,70% 0,04% 2,83 2,95 1,03% 5,34% 1,90% 0,06% 2,83 2,97 1,16% 6,03% 2,10% 0,08% 2,84 2,99 1,29% 6,71% 2,30% 0,10% 2,84 3,01 1,42% 7,41% 2,50% 0,12% 2,84 3,03 1,54% 8,11% 2,70% 0,14% 2,85 3,05 1,67% 8,81% 2,90% 0,16% 2,85 3,07 1,80% 9,52% 3,10% 0,18% 2,85 3,09 1,93% 10,23% 3,30% 0,20% 2,86 3,11 2,06% 10,95%
Figure 64 : Analyst’s estimates
Figure 65 : Analyst’s estimates
Annual growth in America
Estimated sales 2015 Bn EUR
Estimated sales 2020 Bn EUR
2015 vs today 2020 vs today 0,20% 2,14 2,16 0,20% 1,00% 0,40% 2,15 2,18 0,40% 2,02% 0,60% 2,15 2,20 0,60% 3,04% 0,80% 2,16 2,23 0,80% 4,06% 1,00% 2,16 2,25 1,00% 5,10% 1,20% 2,17 2,2715 1,20% 6,15% 1,40% 2,17 2,29 1,40% 7,20% 1,60% 2,17 2,32 1,60% 8,26% 1,80% 2,18 2,34 1,80% 9,33% 2,00% 2,18 2,36 2,00% 10,41% Annual growth
in Asia Pacific
Estimated sales 2015 Bn EUR
Estimated sales 2020 Bn EUR
PERNOD RICARD COMPANY REPORT
PAGE 28/33
economic potential of south America and the recent regain of dynamism of the United states.
GDP & consumption per capita growth
As we discused previously in the chapter Key Drivers, GDP growth for emerging countries is strongly stimulating the average consumption of alcohol per capita up untill a certain point. For the analysis we have tried to estimate the relation of GDP and average consumption per capita using a different approach.
Our assumptions are the following :
-Current level of consumption shown in Europe cannot be overpassed even with higher GDP per capita.
-Emerging countries tend to westernize their consumption habbits.
Therefore we used the model presented in figure 66 to estimate the futur consumption per capita by forecasting GDP for the areas.
The consumption per capita is a critical factor. It is with demography the two determinents of a market size. Assuming a constant demography and market share, a doubling consumption per capita would de facto double the sales.
Scenario analysis
We have defined three scenarios that could happen in the years to come. Each of the scenario has been attributed a probability depending of the likeliness of occurrence of all its factors.
The first scenario has a 0.7 probability of occurrence, this scenario that we will qualify being neutral in its approach has been estimated with the following inputs: -Demographic growth: has been assumed to be conform to the WHO estimations -GDP per capita: Emerging Asia has developed on the last decade at a yearly growth of 6.4%16 we assumed this rate to be plausible for the years to come.
Americas have grown at a pace of 2% during the last decade and are likely to grow at the same pace in the upcoming years. Nevertheless we raise our concern regarding the economic health of the U.S and some southern American countries if the price of oil would stay at its level or decrease even further
(today’s price $47.65 per barrel). As we are assuming Europe to be at its
maximum average consumption per capita we did not judge necessary to estimate GDP per capita to forecast the average consumption.
16 Source : http://www.worldeconomics.com/
Figure 66 : Analyst’s estimates
Asia-Pacific America
2014 1,8 3,6
2020 2,1 4,1
Consumption of alcohol per capita
Figure 69 : Analyst’s estimates
Figure 67 : Analyst’s estimates
PERNOD RICARD COMPANY REPORT
PAGE 29/33
-Market share: After analyzing in deep Pernod Ricard’s strategy and its evolution through the last years we believe that Pernod Ricard is most likely to conserve its market position in every region for the upcoming years.
-Profitability: We assumed that the potential increase in costs, driven by payroll, commodities and utilities would not pose huge threats. Indeed an increase in payroll could be translated by an overall increase in living standard within the area and thus could be offset by an increase in price to the consumers. Regarding utilities and commodities we believe that Pernod Ricard has so far been successful in its hedging strategy and thus should not be significantly exposed to volatility in commodities and utilities. However due to the recent restructuration after the bad performances in 2014 we believe Pernod Ricard’s workforce to be now more in adequacy with the business needs and therefore estimated with all the parameters above an increase in the EBIT margin for the years to come.
The second scenario that would be considered being more optimistic, bears a probability of 0.1 of occurrence.
There is no difference in terms of macroeconomic input and the only variation will come here from a revised estimation of the market share from Pernod Ricard. We do believe that Pernod Ricard is an active player on its market and has sufficient knowledge of its core business to take advantage of the opportunities. A key point for us is that Pernod Ricard has one of the highest operating margin of the sector, and could easily sacrifice some margin to maximize its presence in the media (moreover, even though the profit margin is just above sector average the decreasing outstanding long term debt will benefit Pernod Ricard and unlock more cash that could be used to enhance marketing presence globally). Furthermore we believe that from a marketing standpoint Pernod Ricard is already well advanced on the track of digitalization compare to its peers.
Therefore we have estimated the potential market shares that Pernod Ricard could be capturing in the year to come in every market.
Our third and last scenario has a 0.2 probability of occurrence and was estimated based on the worsening economy. Recent news regarding the once again trembling Eurozone has led us to think that 2015 would be a tough year for the European economies. Moreover the conflict in Ukraine, after having shown signs
2015
2016
2017
2018
2019
2020
EMEA
12,8%
12,9%
13,0%
13,2%
13,3%
13,4%
ASIA PACIFIC
3,1%
3,3%
3,7%
3,8%
4,3%
4,4%
AMERICA
9,1%
9,2%
9,6%
9,7%
9,9%
10,0%
Figure 72 : Analyst’s estimates
Figure 70 : Analyst’s estimates
Figure 71 : Analyst’s estimates