THIS REPORT WAS PREPARED BY “STUDENT’S NAME”, A MASTERS IN FINANCE STUDENT OF THE NOVA SCHOOL OF BUSINESS AND
ECONOMICS, EXCLUSIVELY FOR ACADEMIC PURPOSES.THIS REPORT WAS SUPERVISED BY ROSÁRIO ANDRÉ WHO REVIEWED THE
M
ASTERS IN
F
INANCE
E
QUITY
R
ESEARCH
We have initiated our coverage with a price target of €6.32
per share, corresponding to a BUY recommendation as there is an upside potential of 54% relative to today´s price.
The company´s focus in the regulated business is highly justifiable as it provides a stable and sustainable business. Reinforcing the presence in Brasil and strength domestic, UK and USA networks will produce resilience cash flows.
Iberdrola seems to already recognize the liberalized activities as the less attractive business due its excessive volatility (more exposed to market risks). The business has been excessively exposed to lower demand and lower prices in some countries as well as the current regulatory framework in Spain and UK suggests lower growth projects.
In line with the energy trends (investments of low CO2 energies), Iberdrola will be very committed in the upcoming years on the strengthening of its worldwide leadership in renewable energies. This segment is expected to produce the most dynamic growth in the next years: EBITDA CAGR of 6% during 2012-2019. Even though Iberdrola is still very focused on cost-cutting, investment slowdown and disposal plan to reduce costs and debt level we strongly believe the current capital structure is manageable. However, the ability to deleverage the balance sheet while retaining more cash flow generation than asset disposals will be the key point to unlocking Iberdrola´s fair valuation.
Company description
Iberdrola is a Spanish-based electric utility engaged on four main segments: regulated, liberalized, renewables, and other businesses. In 2001 the company implemented its growth and international expansion plan which has become Iberdrola as the Spain’s largest energy group by market capitalisation, the global leader in wind energy and one of the world’s largest utilities by market capitalization.
I
BERDROLA
C
OMPANY
R
EPORT
U
TILITIES SECTOR
7
J
ANUARY2012
S
TUDENT
:
V
ASCO
C
ONCEIÇÃO
[email protected]
The Future is Renewable
Dynamic growth opportunities in the renewables
Recommendation: BUY
Price Target FY13: 6.32 €
Upside Potential 54%
Price (as of 4-Jan-13) 4.11 €
Reuters: IBE.MC, Bloomberg: IBE SM
52-week range (€) 2.63-4.63
Market Cap (€m) 25.230,85 Outstanding Shares (m) 6.138,89
Source: Bloomberg
Source: Bloomberg
(Values in € millions) 2011 2012E 2013F Revenues 31.648 34.412 35.869
EBITDA 7.650 8.037 8.444
EBITDA Margin 24.2% 23.4% 23.5%
EBIT 4.505 4.868 5.171
Debt/Assets 0.65 0.66 0.66
Net Debt/EBITDA 4.25 4.11 4.11 Net Debt/Equity 0.98 0.98 1.02 EBITDA/Interest Expenses 5.2 5.0 5.0
ROCE 6.6% 7.1% 7.3%
IBERDROLA COMPANY REPORT
Table of Contents
COMPANY OVERVIEW
... 3
COMPANY DESCRIPTION ... 3
SHAREHOLDER STRUCTURE ... 4
REGULATED BUSINESS
... 5
SPAIN:“NEW REMUNERATION MODEL PLAYS A ROLE” ... 5
UK:“LOW RISK, MATURE AND STABLE BUSINESS” ... 7
USA:”SIGNIFICANT CHALLENGES OVER THE NEXT YEARS” ... 10
BRAZIL:“STRENGHTENING IN A FASTEST GROWING COUNTRY” ... 13
VALUATION ... 15
SENSITIVITY ANALYSIS ... 16
LIBERALIZED BUSINESS
...18
SPAIN (PORTUGAL):“PRESSURED BY INNEFICIENT TECHNOLOGIES” ... 18
UK:“CARBON TAX POSES A CHALLENGE” ... 20
MEXICO:“STABLE BUSINESS –PPAAGREEMENTS” ... 21
VALUATION ... 22
SENSITIVITY ANALYSIS ... 22
RENEWABLE BUSINESS
...23
VALUATION ... 24
SENSITIVITY ANALYSIS ... 25
SUM-OF-THE-PARTS
...26
VALUATION ... 26
WORST CASE SCENARIO (15%PROBABILITY) ... 29
RISK FACTORS ... 31
THE PROBLEM OF TARIFF DEFICIT
...32
FINANCIALS
...34
APPENDIX
...35
BALANCE SHEET (BASE SCENARIO) ... 35
INCOME STATEMENT (BASE SCENARIO) ... 36
STATEMENT OF CASH FLOWS (BASE SCENARIO ... 36
HOLDINGS ... 37
COMPARABLES ... 37
IBERDROLA COMPANY REPORT
Company overview
Company Description
Iberdrola is a Spanish-based listed company in the Madrid Stock Exchange being one of the Spanish´s main companies on the Ibex 35 by market capitalization. The company was founded in 1992 as a result of the merger between Hidroeléctrica Española and Iberduero. Currently, it is one of the most important Spanish companies representing the Spain’s largest energy group, the world leader in wind energy and a major player in the power industry worldwide over the past few years. The international expansion has been a key major driving force behind Iberdrola´s performance since it went through its growth and international expansion plan in 2001. Iberdrola primarily operates through its four main business segments: regulated business, liberalized business, renewable energy business, and other businesses. The regulated business comprises not only the energy transmission and distribution businesses but also those of any other regulated nature, originating in Spain, United Kingdom (UK), United States of America (USA) and Brazil. The liberalized business encompasses energy generation and supply activities related to the selling of energy to deregulated customers carried on by the group in Spain, Portugal, UK and Mexico. The renewable business includes activities relating to renewable energies in Spain, UK, USA and the rest of the world, and the gas trading and storage businesses in USA. Last but not least, the other businesses are the engineering and construction businesses, non-power businesses and gas activities in Canada. Historically, the regulated business has been the most relevant contributor to Iberdrola´s earnings before interest, taxes, depreciation and amortization (EBITDA) followed by the liberalized and the renewable business (see Graph 1).
Over the last years, Iberdrola has shifted from the predominante domestic business to become a different company with activites all over the world. The expansion has not only been organic but also non-organic, which includes several key acquisitions: Scottish Power (SP) in UK, Energy East in USA, and Elektro in Brazil. In what concerns organic growth, Iberdrola has strongly bet on renewable energies being the first electric utility in the world that strongly invested on the development of renewables which has allowed the company to become the number one in wind energy. There were two main growth phases: the 1st phase (from 2001 to 2006) included the growth of renewable energies and
generation in countries such as Spain, Mexico and Brazil while the 2nd phase (beginning in 2007) was characterized by the internationalization with the acquisitions of SP, Energy East and Elektro representing the key milestones as well as the streghtening of its worldwide leadership in renewable energies. Non-organic growth included
several key acquisitions
There were two main stages on its growth plan
Graph 1: Segment Contribution to EBITDA (2011)
(Source: Iberdrola, Analyst Estimates) (Source: Iberdrola)
IBERDROLA COMPANY REPORT
Shareholder Structure
ACS (formally Actividades de Construcción y Servicios), a leading construction company in the world with projects in many countries worldwide, is the biggest shareholder representing the most significant shareholding in the company. The company owned approximately 14,90% of the company´s ownership. The remaining important shareholding blocks are: Kutxabank, Qatar Investment Authority and Bankia (Bancaja) (see Figure 2). The remaining 66,20% constitute
free-float which has been listed for trading in the Madrid Stock Exchange. Lately, overhang concerns have arisen due to the current macroeconomic situation. On 18th April, ACS, the Spanish construction group sold 3,69% stake under an accelerated bookbuilding process either to help cover the margin calls of the loans taken to buy the stake in Iberdrola or to help pay other debt maturities in the group. Iberdrola’s share underperformance at the time – the shares had dropped 16% in the preceding 20 days – triggered higher margin deposits in ACS’s equity swap agreements, one of the main instruments through which ACS had built up its stake in Iberdrola. Prior to the announcement of the deal, ACS had unsuccessfully attempted to take over management of the Spanish company through repeated attempts to place representatives on to the utility’s board of directors. In order to prevent ACS from gaining influence over the company, Iberdrola had been blocking shareholders' voting rights even after new corporate regulations ruled that it is illegal for companies to cap shareholders' voting rights. Given their highly leveraged structure and/or need to improve liquidity, not only ACS but also Bankia, which is struggling with financial difficulties, are on the top of the overhang risk. As mentioned before, Bankia has a stake on Iberdrola and the option to increase liquidity and strength balance sheet via asset disposals has not yet been confirmed nor denied by the company. However, several offsetting factors should be taken into consideration. Firstly, ACS announced that it has renegotiated the financial instruments to keep its stable ownership of Iberdrola for at least the next three years. Moreover, the ACS´s financial situation has improved since it sold its stake in Iberdrola. Subsequently, it disposed 10% ownership in Abertis amounting €875mn, sold seven transmission lines in Brazil for €752mn, and bank refinancing to the tune of €506mn, as well as renegotiating Iberdrola’s debt instrument mechanisms. Besides that, after the annual general meeting, in a press conference, Iberdrola´s Chairman reiterated that the company is considering buying back the shares held by state-rescued lender Bankia even though a final decision has not yet been taken. In sum, despite the fully justifiable overhang risks that ACS and Bankia could reduce their stakes the offsetting factors might be strong enough to remove the idea spread by some analysts and investors that Iberdrola presents a fragile shareholder structure. Despite some overhang risks, there
are significant offsetting factors
Iberdrola may buy back the shares held by state-rescued Bankia ACS is the biggest shareholder
Figure 2: Shareholder Structure
(Source: Iberdrola, Bloomberg)
SHAREHOLDER STRUCTURE %
ACS 14,90%
Kutchabank 5,40%
Qatar Investment Authority 8,30%
Bancaja 5,30%
IBERDROLA COMPANY REPORT
Regulated Business
The regulated business operated by the company includes the energy transmission and distribution businesses, as well as those of any other regulated nature, located in Spain, UK, USA and Brazil. As previously mentioned, it is by far the most important Iberdrola´s activity, accounting for approximately 50% of 2011 EBITDA. Since 1st January 2011, all Iberdrola´s regulated activities were integrated in a sole business area aiming to create synergies, optimize structures and to increase operational efficiency.
Spain
: “ New remuneration
model
plays a role”
Electric power transmission, a process in the delivery of electricity to consumers, constitutes the bulk transfer of electrical power. Red Eletrica Espanola (REE) carries on the transmission of electric power and is responsible for the operation of the power system along with the management of the transmission grid in order to guarantee electricity supply and proper coordination between the supply and transmission system, as well as the management of international electricity flows. As recommended by the European Commission, REE in Spain or REN in Portugal constitutes independent operators in order to ensure the appropriate competitive access to the network in a non-discriminatory, transparent and fairly priced way. In other words, it is necessary that the independence of the distribution system operators and the transmission system operators be guaranteed especially with regard to generation and supply interests1. REE's transmission grid is composed of more than 40,100 kilometres of high voltage electricity lines and more than 4,800 substation bays, and has more than 74,000 MVA of transformer capacity. As a regulated activity, the transport and distribution are not subjected to the free competition and market regime being Endesa, EDP/HC, and Gas Natural Fenosa the main players in the electricity distribution industry (see Figure 3). The National Energy Commission (CNE – Comission Nacional de Energia) is the entity responsible for the regulation and supervision of the energy sector in Spain. Since it is not an independent body from the Spanish Government, CNE is the regulatory authority that has legislative powers to regulate the energy sector. The remuneration paid for distribution activities will be set for regulatory periods of four years and will be calculated using a reference network model as a technical comparison tool. A reference network model is a model that maps out, for all Spanish territory, the areas in which each distributor is active and determines the reference distribution network needed to link up the transmission network, where applicable, and
1 Directive 2003/54/EC of the European Parliament and of the Council of 26 June 2003. Since 1st January all regulated
operations were integrated
CNE is the Spanish regulator of the energy systems
Four years will constitute the time frame for regulatory period
Figure 3: Electricity Regulated Retail in Iberia (TWh)
(Source: EDP)
Market Share 2010 2011
Endesa 31% 31%
IBERDROLA
26%
25%
EDP/HC 32% 32%
Gas Natural Fenosa 11% 11%
IBERDROLA COMPANY REPORT
Figure 4: Administrative Regulation
distribution network with the final consumers of electricity, based on their geographical location, feed voltage and demand for power and electricity2. As of December 2011, Iberdrola managed more than 10.6 million supply points and the total energy distributed amounted to 96,379 GWh. The domestic business was the largest contributor to the company´s fiscal year 2011 EBITDA accounting for approximately 41% of the total. The Spanish gas and electricity system has been subjected to a complex administrative regulation since the late 2007 with the introduction of tariffs of last resort (TLR) in both gas and electricity (in mid-2008 and mid-2009, respectively), the reform of the mechanism for the determination and recovery of the tariff deficit, the continuation of the programme of procurement auctions (CESUR) used to set the cost of energy for residential electricity customers but the discontinuation of the virtual power plant (VPP) programme applied to the largest generators, and the measures on solar subsidies and domestic coal-fired generation3 (see Figure 4). According to the Spanish network legislation, remuneration is a function of the costs incurred in the process and certain efficiency metrics. There are three main inputs to calculate the remuneration: the remuneration for investment, the remuneration for operating and maintained, and the remuneration of all costs necessary to the exercise of distribution activities which will include commercial management, network planning and energy management costs (see Figure 5). Within each
period the remuneration is then calculated by updating the base remuneration of the past year (taking into account the CPI and IPRI) and adding up the remuneration for the new investments made. Annual incentives are also set for enhancing quality and reducing losses. Due to the gap between revenues from supply and access tariffs and fees for the transmission or distribution grids and the recognized costs charged in the several different activities and regulated costs of the electricity system, the Spanish electricity market has presented a structural revenue deficit in its regulated activities for a decade now4.
Furthermore, the overall economic outlook in Spain may require additional downsize risks as there is growing concerns about the consumptions levels in the future since the general landscape as of the end of the previous year indicates us energy consumptions at 2007 levels. Adapting investments to the new regulatory framework currently in development along with maximizing efficiency may be the key aspects to generate resilience cash flows. In the 2012-2014 regulatory adaptation period to the new remuneration system , Iberdrola will invest around €750 Million (€350 Million in 2012, €200 Million in 2013 and the same amount in 2014) mostly in growth to strength its power network (the gross
2 Annual Report, Iberdrola. 2011. “Legislation applying to regulated activities”
3Giulio Federico, “The Spanish Gas and Electricity Sector: Regulation, Markets and Environmental Policies 4Please consult “The Problem of Tariff Deficit” section in this report for more information on this issue (Source: Literature Review)
Graph 2: Investment Plan (Eur m)
(Source: Iberdrola, Analyst Estimates)
Figure 5: Remuneration in Spain
IBERDROLA COMPANY REPORT
percentage) and the remaining part in refurbishment (see Graph 2). Since
regulation has produced a significant need for adaptation as well as regulatory uncertainty risk is still increasing the company will focus on efficiency improvement (workforce reduction – 250 employees, lower contractor costs, re-engineering process) obtaining savings against inflation and activity increase. Expectedly, in line with the company expectations the networks business in Spain will reflect in the next year the cut in the new remuneration similar to the countries in which Iberdrola operate. The main adjustments came from the downward revision of distribution revenues as reported in the Royal Decree 13/2012. The set of measures ruled out through the article 5 on the aforementioned legislation includes the following to take effect from 1st January
onwards5.
Assets in operation that have not been fully depreciated will be remunerated as an investment, and their net value will be taken as the basis for remunerating the investment;
The remuneration earned by distribution facilities brought into operation in year n will start to accrue from January 1 of year n+2.
In the forecasting approach, we assumed the revenues will be estimated according to the resolution laid down by the IET 3586/2011. The revenue per unit distributed will be 7% lower in the next year as a result of the cut in the remuneration and its adaptation period. Also, we maintained a steady 19.4% Operational Expenditures/Gross Margin (OPEX/GM) ratio along the valuation model which represents an approximately 1% decrease compared to the OPEX/GM ratio in 2010 and close to the ratio registered in 2011 (19.27%). In the presentation of the 1st Quarter Earnings, Iberdrola said that the cut of distribution revenues led to a decrease of €58mn in the earnings of the first quarter. We estimated the overall cut this year to be approximately €223 Million in comparison to the net income reported by the company in 2011. We assumed the energy distributed breakdown in the last year to remain constant from 2012 onwards (see Figure 6). Moreover, we extended the distribution revenue cut in 2012 to the perpetuity in our forecasting. Our valuation assumes an EBITDA margin of 77%, which is in line with the historical data.
UK: “Low risk, mature and stable business”
In its UK-regulated power business, the Spanish multinational company distributed to more than 3.4 million customers in the last year. In this country the
5 Garrigues, ”New Energy Industry Regulation in RD 13/2012 on the gap between revenues and expenses in the electricity and gas expenses”
Downward revision of distribution revenues
Figure 6: Energy Distributed Our projections indicate a 7% decrease in the revenue per unit distributed in the next year
)
SP Energy Networks distributes to more than 3.4 million customers
Energy Distributed Breakdown %
Residential 25%
Industry 40%
Services 35%
Total 100%
IBERDROLA COMPANY REPORT
set of services is offered through its fully vertically integrated energy subsidiary Scottish Power (SP) headquartered in Glasgow, Scotland. Following the privatization of the previously state-owned Scottish Electricity industry SP was founded in 1990. In 23th April 2007 Iberdrola acquired all issued ordinary shares of SP: approximately 52% in exchange for cash or loan notes and the remaining 48% in Iberdrola shares (see Graph 3). The Iberdrola´s Chairman Ignácio Gálan described the deal as the “birth of one of the largest energy companies in the world, with a total enterprise value of more than €65 Billion” effectively creating Europe's third largest utility company. In the UK, energy networks are carried out by SP Distribution, SP Transmission, and SP Manweb (part of SP, therefore itself a subsidiary of Iberdrola). A fourth asset management business is SP Power Systems which maintains and repairs the distribution networks on behalf of the owners and acts as the distribution network operator (see Figure 7). During the last year the volume of energy distributed was 35,434 GWh. In terms of operational performance, in the 2010-2011 regulatory years SP Distribution ranked 5th with a score of 4.42 while the mean score for the sector for the 12-month period was 4.37. Moreover, SP Manweb was ranked 3rd out of 14 with a score of 4.49 out of 5. In UK, the framework for regulation of the energy industry is laid down principally by sector-specific legislation – the Electricity Act 1989 (as amended) in Great Britain and the Electricity (Northern Ireland) Order 1992 (as amended) in Northern Ireland – and the licences issued under it6. However, the regulators of the electricity industry also have recourse to powers under general competition legislation – the Competition Act 1998 and the Fair Trading Act 1973. The Office of Gas and Electricity Markets (Ofgem), as the industry regulator, administers a price control regime which ensures network operators can, through efficient operation, earn a fair return after capital and operating costs while limiting costs passed onto customers7. Remuneration is a function of a model
based on the following inputs: regulatory asset base (RAB), Weighted Average Cost of Capital (WACC), allowances, and quality incentives (see Figure 8). Unlike the restless regulatory framework in Spain, important advances in the ‘design of Britain’s energy model’ in recent years has provided relative stable and predictable regulatory environment as basic pillar of the company´s presence in UK. For the upcoming years, we expect the government to put in place some of the already announced regulatory agreements in the short and long-term. In the Iberdrola’s Annual General Meeting, Ignacio Galan, Chairman of Iberdrola and SP reiterated his commitment to announce investments totalling €6 Billion over the next few years on upgrading the UK’s distribution and transmission system, as a result of the investment and regulatory certainty despite the economic
6Simmonds, Gillion. 2002 edition. “Regulation of the UK electricity industry” 7Ofgem. 2012. “Price Controls –Fact Sheet Update”
Sector-specific legislation frames the regulation in UK
Iberdrola´s presence in UK has been characterized by a stable regulatory environment
Graph 3: Iberdrola-SP deal
r)
Figure 8: Remuneration in UK
(Source: Ofgem)
Figure 7: SP Energy Networks Segmentation
IBERDROLA COMPANY REPORT
uncertainty taking place in the Eurozone. With the recruitment of new engineers and technicians, Iberdrola will create 1,500 new jobs. Furthermore, Iberdrola intend to double its RAB strengthening its networks business. The UK distribution/transmission price control Ofgem proposals define the level of revenue that a given company in the energy utility sector is allowed to recover from its customers (allowed revenues). The regulatory framework derives this from an estimate of operating expenditure, capital expenditure, financing costs and corporation tax rate for the relevant period. These inputs are used, together with the regulatory asset value i.e. the value ascribed by Ofgem to the capital employed in the regulated business, to calculate the aforementioned allowed revenue (see Graph 4). The regulatory asset value (RAV) is adjusted each year
to reflect asset additions, depreciation and the rate of inflation. The allowed revenue is then profiled across the price control period, determining the immediate change in revenues in the first year of the price control and the path of revenues over the remaining year (or ‘X’), with two key considerations being the financial profile of the businesses and the longer term trend in revenues8. In the distribution business, with the entry into force in April 2010 of the new remuneration established under the Distribution Price Control Review 5 (DPCR5) until April 2015 the compensation for regulated businesses is no longer linked to fluctuations in demand. The introduction of the latest regulatory framework has allowed Iberdrola to sustain an increased margin due to a larger RAB established under DPCR5 which resulted from the higher investments undertaken and committed. In the transmission business, the five-year formula known as RPI-X to control network prices (recognised to be a natural monopoly) is being replaced by the new RIIO framework (see Figure 9) that will form the basis for the next Transmission Price Control due to start in April 2013 covering an eight-year period through to 2020/21. RIIO‐T1 will represent a significantly huge CAPEX programme: SP Transmission will have to raise close to £3 Billion with a three‐fold increase in the RAV. According to our estimates, the headline WACC (before incentive potential) must be attractive enough to offset the current levels and regulatory decisions such as DPCR5. “RIIO-T1 will deliver significant organic growth in a low risk, mature and stable regulatory environment”, the company said in a presentation regarding the regulatory framework on electricity transmission in UK.9 Last but not least, a major construction will be the building of the first 420 km undersea cable uniting Scotland and England (being undertaken jointly with National Grid) that will create the largest project of this nature worldwide using leading-edge technology. Scottish Power announced the awarding of a £1 Billion contract to Siemens and cable manufacturer Prysmian. It
8National Grid, Investor Update December. 2007. “The UK electricity distribution price control” 9 Transmission UK, SP. 26th January 2012. “RIIO T1 Fast Track Overview”.
Iberdrola will invest €6 Billion on
Graph 4: Allowed Revenues (£ m)
Figure 9: New RIIO Framework
(Source: Ofgem)
The compensation for regulated business is no longer linked to fluctuations in demand – DPCR5
RIIO-T1 will require a capital outflow of approximately £3 Billion
Iberdrola will invest €6 Billion on upgrading UK Networks
IBERDROLA COMPANY REPORT
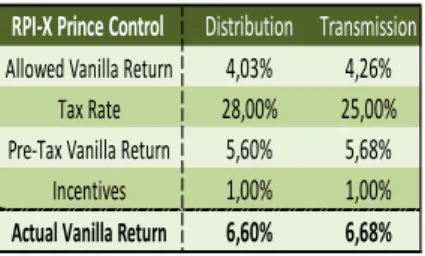
is due to be operational by 2016. According to our estimates, we believe the most relevant future investments will be placed either in UK or in US. We estimate CAPEX for the period 2012-2014 according to the company investment plan for the aforementioned years. In the next year, 58% of the capital expenditures will be used on the upgrading of the distribution networks while the remaining 42% will target the transmission business. In the period 2013-2014, transmission projects will cover most of the capital expenditures. Until the end of the explicit period we assume the percentage of capital expenditures allocated to each business to be constant from 2014 onwards in result of depreciation accumulated regarding the transmission projects already under construction as mentioned before and CAPEX will decrease in 2015 as a result of the end of the investments aforementioned. The allowances distributed were kept constant in 2012 at the value reported in 2011 but from 2013 onwards they will decrease in a linear manner (we assumed to be about 2%)10.The retail price control was assumed to growth at a constant rate (indexed to inflation) up to the end of the explicit period, except in 2012. We assumed a 10% cut in the remuneration growth rate in 2012 to reflect the adaptation period concerning the regulatory framework in course. Concerning the regulatory formula, other allowed operational expenditures will growth at the inflation rate through the explicit period, the depreciation expenditures will be based on a 20 year life basis, capital expenditures (concerning RAV – see Graph 5) will be the historical average of the period 2009-2012 assuming a 25% tax rate in the transmission business while in the distribution business will be 28% in the 2012-2019 period. The inputs to plug in the RPI-X Price Control Formula were assumed to be constant throughout the explicit period either in both segments (see Figure 10). Some final considerations should be made. Firstly, we assumed OPEX/GM ratio to decrease in a linear manner due efficiency improvements and OPEX to increase in a very equivalent pace as the evolution of RAB per year. Furthermore, GM evolves in a similar manner to the RAV and the EBITDA Margin will reach 85% in 2019 from the 82% in 2012 in result of significant investments made and operational savings (see Graph 6).
USA:
”
Significant challenges over the next years
”
Iberdrola USA (formerly Energy East) is the leading operating subsidiary of Iberdrola in USA being a super-regional energy services and delivery company with operations throughout New England and New York State. In 17th September 2008 Iberdrola completed the acquisition of Energy East to broaden its regulated activities, offering a premium of 20.2% to the American-based company´s
10 EU Legislation. “EU Emissions Trading Directive 2003/87/EC” Figure 10: RPI-X Price Control Inputs
(Source: Analyst Estimates)
Graph 6: EBITDA Margin
(Source: Analyst Estimates)
Graph 7: Energy East Deal
(Source: Analyst Estimates) Graph 5: Expected RAV (Average Value) - £
(Source: Analyst Estimates)
RPI-X Prince Control Distribution Transmission Allowed Vanilla Return 4,03% 4,26%
Tax Rate 28,00% 25,00%
Pre-Tax Vanilla Return 5,60% 5,68%
Incentives 1,00% 1,00%
IBERDROLA COMPANY REPORT
shareholders over the average share price for the 30 days prior to the offer announcement (see Graph 7). The company would be renamed as Iberdrola
USA in 2009. Regulated utilities in USA (see Figure 11), including New York
State Electric & Gas (NYSEG), Rochester Gas and Electric (RG&E) and Central Maine Power (CMP), represent approximately 98% of the Iberdrola USA´s assets. In accordance with the last year´s annual report the wholly-owned subsidiary of Iberdrola had 1.86 million electricity supply points. The energy distributed during the year was 31,201 GWh and Iberdrola USA has approximately 0.56 Million Gas Users with 30,030 GWh gas supplied during the same period. This value represents a 1.1% increase when compared to the previous year, excluding the contribution from the Connecticut and Berkshire gas companies, which were sold during the last quarter of 2010. Connecticut Natural Gas (CNG), Southern Connecticut Gas (SCG) and Berkshire Gas Company (BGC) were sold to New Haven, Connecticut-based UIL Holdings Corporation. The proceeds of the transaction (the equity value received was approximately $918 Million) were used to help finance a major upgrade of transmission lines linking Canada and New England, as will be explained later. They served a total of about 370.000 users. In line with Iberdrola´s Group strategic focus on networks, Iberdrola USA also announced infrastructure improvements in New York State investing about $73 Million in infrastructure near Ithaca, New York, and spending $55 Million on upgrades near Corning, New York. As the UK regulatory system, the American regulatory framework has provided a relative predicable environment for Iberdrola USA. In the distribution business, the conclusion of the tariff agreements (rate cases) in September 2010 provides visibility for Iberdrola USA companies for the coming years. The approved rate cases for all electric and gas distribution business lasts until December 201311, the economic incentives to operate are fully ensured and also there is obviously a relevant reduction of the volatility (protection against demand evolution, storm costs, pensions, taxes, and others). In sum, this should lead to a path of growth in results and a stronger financial and credit profile in the upcoming years. Regarding the Maine-based subsidiary, which encompasses CMP, a multi-annual rate case will be negotiated in 2013 which will come into effect in 2014. On the other hand, in the transmission business there are significant growth initiatives requiring significant capital expenditures on the way. The under construction Maine Power Reliability Program (MPRP) project, a project that will support the development of new renewable energy resources and help ensure long-term reliability for customers by increasing the capacity and efficiency of the New England's transmission grid, will require an investment of approximately $1.4
11 Iberdrola reserves the right to expand tariff agreements further in 2014 (applied to New York-based companies – NYSEG and RG&E)
The MPRP project is expected to result in an investment of approximately $1,4 Million
Graph 8: Allocation ofProjected Rate Bases
(Source: Analyst Estimates)
CNG, SCG and BGC were sold to help financing a major transmission lines upgrade
$128 Million will be soon invested in improvements and upgrades in New York State
Figure 11: Iberdrola USA Segmentation
IBERDROLA COMPANY REPORT
Billion and is expected to be completed in 2015. In the year ended in 2011 the investments associated with the project amounted to $258 Million. This is the largest energy infrastructure project in the Maine´s history, and in the last 40 years represents the first upgrade of its electricity grid. Furthermore, there is also on progress a scheme to roll out smart meters in Maine. Iberdrola USA will invest $192 Million on this project that is now nearing completion. It will benefit the 620,000 residential, commercial, and industrial customers of its subsidiary CMP. In the 3rd Quarter Presentation Results Iberdrola´s Chairman still announced that new investment opportunities are under analysis for the transmission business from 2015 onwards. In order to provide a realistic and accurate estimation with the data available and since no decision has been taken yet by Iberdrola we assumed no further capital outflows in new projects for the upcoming years. In USA, remuneration is a function of the legislation of each state and tariffs that are review in a short-time basis. The critical issue for the regulator includes how to estimate the earning drivers for regulated business, whether to add investments to the rate base (see Graph 8) as they are made or when the facilities go into service, the amount of depreciation, and whether expenditures have been prudently made and whether they relate to items that are used and useful for providing the utility service. Cost of capital is also called the allowed rate of return and is the interest that the company pays on its debt plus the return it must provide to shareholders to ensure they continue to invest in the company12. For that purpose, we assumed a return-on-equity (ROE) for each business in each subsidiary as presented in the Figure 12 matching the historical values of the past 3 years and the average ROE estimated by the company for the period 2012-2014. As mentioned before, the total revenue requirement includes the total expenses incurred as well as the net profit potential13 which is a component of the rate base14 and the return of the equity component of the rate base. Iberdrola
USA equity ratio (see Figure 13) in each subsidiary was also kept constant since
no information available so far indicates any changes in that regard. All the expenses incurred to provide the utility service were calculated assuming a given percentage rate in each case. Regarding the CAPEX estimation, the already announced projects under construction were included in the forecasted capital expenditures on upgrading and growth projects as well as the costs of refurbishment of the assets (see Graph 9). In the period 2009-2011, NOE/GM
(Net Operating Expenses/Gross Margin) has improved from 51% to 41% due reduction of external service and 20% reduction in workforce (without considering the sale of Connecticut). The company announced in its last quarter presentation
12 Mark A. Jamison, University of Florida: “Rate of Return: Regulation”
13 Net Profit Potential = Rate Base * Equity Capital % * ROE, according to the USA Networks legislation 14Rate Base is a function of the net plant, regulatory assets/liabilities and deferred taxes
A scheme to roll out smart meters in Maine is now nearing
completion costing $192 Million
Graph 9: Estimated CAPEX
(Source: Analyst Estimates) Figure 12: Projected ROE for each business
(Source: Analyst Estimates)
ROE (after tax) INPUTS NYSEG
Electricity 10,00%
Gas 10,00%
RG&E
Electricity 10,00%
Gas 10,00%
CMP
Electricty/gas 10,50%
Figure 13: Equity Ratio to set rates
(Source: Analyst Estimates)
EQUITY %
NYSEG 48,00%
RG&E 48,00%
IBERDROLA COMPANY REPORT
results the following target: NOE/GM ratio of 34% in 2014. In the projected Income Statement we do not expect Iberdrola to reach this goal even though as presented in the Graph 10 Iberdrola will be in a better position to reach its
objective which is in line with the company´s objectives to achieve all metrics avoiding penalties. In line with the approach used to value UK networks business GM evolves in a similar manner to the RAV, and the EBITDA Margin will range from 25,8% in 2012 to 24,2% at the end of the explicit period.
Brazil
: “ Strenghtening in a fastest growing country”
The Brazilian-regulated power business is offered through Neoenergia (the holding company of electricity distributors Coelba, Cosern and Celpe) and Elektro (see Figure 14). Neoenergia, which Iberdrola is the leading shareholder since the late 1990s, is the largest private sector power distributor in Brazil. Despite most of the operational decisions are taken by the Spain´s largest energy company, it shares control with two government-led investors, Previ, Banco do Brasil's employee pension fund, and Banco do Brasil. In the early 2011, in a bet that rapid growth in Latin America´s largest economy will offset its weaker domestic market Iberdrola cemented Brazilian presence as one of the key countries in its Latin American expansion with the $2.4 Billion acquisition of electricity distribution company Elektro. With 2.3 Million customers and 15,458 GWh of energy supplied in 2011, the acquisition was carried out by purchasing 99.6% of the shares of the distributor which were property of the US group Ashmore Energy. The company ranks the third position in the State of São Paulo and the 30-year concession of Elektro has begun in 1998 to be ended in the late 2028 covering an area of approximately 120.000 km2. The company has been
reinforcing its presence in one of the fastest growing economies worldwide. The acquisition of Elektro reaffirms not only Iberdrola´s commitment to expand in one of the emerging markets viewed as key to its international growth strategy but also improves Iberdrola´s geographical diversification to reduce reliance on a domestic market where demand has significantly slowed down. The Figure 15
presents the number of customers served by each distributor in the last year. Though Iberdrola is more engaged on the distribution business, the company is still investing on generation activities as will be mentioned later. Distribution wise, Iberdrola distributed 47,872 GWh in the last year15. Regarding generation,
Iberdrola´s installed capacity encompasses hydro and thermal plans. The company intends to almost triple its capacity in the next ten years investing in hydro and wind plans. The regulated tariff reviews are set by the Agência
15 Elektro: Energy Distributed from 28/4 to 31/12. Period consolidated by Iberdrola. 15,458 GWh distributed in the entire year.
(Source: Analyst Estimates)
Figure 14: Iberdrola in Brazil
Figure 15: Number of Customers by Distributor (m)
(Source: Iberdrola)
The investment on Brazilian generation activities has increased Graph 10: NOE/GM Ratio
(Source: Iberdrola)
# Customers (M) 2011
Coelba 5,08
Coserne 1,16
Celpe 3,16
Elektro 2,25
IBERDROLA COMPANY REPORT
Nacional de Energia Elétrica (ANEEL), the Brazilian regulator, throughout the different concession areas. By fixing a given tariff, ANEEL ensures the economic and financial balance in each concession area. In other words, the annual income of the distributors should cover operating costs with the services providing a suitable return on the capital invested throughout the concession period. The Figure 16 shows the various sources of income to the distribution concessionaires. In order to reflect proven significant changes in the company´s operating costs, regulated tariff is subject to regular tariff reviews and annual tariff adjustments as well as other extraordinary revisions. At approximate intervals of 3 to 5 years the periodical tariff revision is carried out in accordance with the concession contracts by calculating a suitable return upon the invested capital and an income required capable of covering efficient operational costs. On the other hand, in order to update the purchasing power of the income obtained by the distribution company in an annual basis, the annual tariff adjustment between two regular tariff reviews is carried out. Whenever an extraordinary event causes relevant changes in the company´s running costs putting at risk the financial and economic stability, the distributor company may ask ANNEL to perform an extraordinary review. ANNEL is also responsible for establishing the tariffs to the distribution and transmission systems by electricity sector's agents and the free (non-regulated) consumers. According to the energy sector legislation in Brazil, whenever a customer chooses the deregulated market instead of the regulated does not pay a regulated tariff to the local distribution company, after contracting electricity from another supplier. Instead, it will continue paying an access tariff to the local distributor16. In the distribution business, the process of defining the new rules for the 3rd cycle of tariff review, which started in 2010, has been completed after ANEEL approved the new average depreciation rates of fixed assets for Brazilian distributors. Elektro underwent its tariff review in August 201217 while
the Brazilian distributors of Neoenergia (Coelba, Celpe and Cosern) will possibly undergo their 3rd cycle of tariff review in April 2013 (see Figure 17).The new tariff methodology will create a new model for recognizing the cost of operation and maintenance (Benchmark Model), for assets retribution, regulatory depreciation, and non-payments provisions. In the next years, we expect the company to keep an attractive remuneration for distribution business in a solid and attractive country. In the generation/transmission business, a predictable and secure tendering model with fixed tariff yearly adjusted by inflation is the current regulatory framework. The regulatory environment provides not only a controlled investment risk (tendering with offer from contractor) but also access to Banco Nacional do Desenvolvimento (BNDES) financing in preferential conditions
16EDP. “Regulation and Tariffs: Electricity Tariffs in Brazil”
17 Elektro Tariff Review will have retroactive effects back to August 2011 when it should have passed the tariff review Figure 16: Several Sources of
Income to the Distributors
(Source: EDP)
Whenever an extraordinary event happens, ANNEL may perform an extraordinary review
(Source: Iberdrola)
IBERDROLA COMPANY REPORT
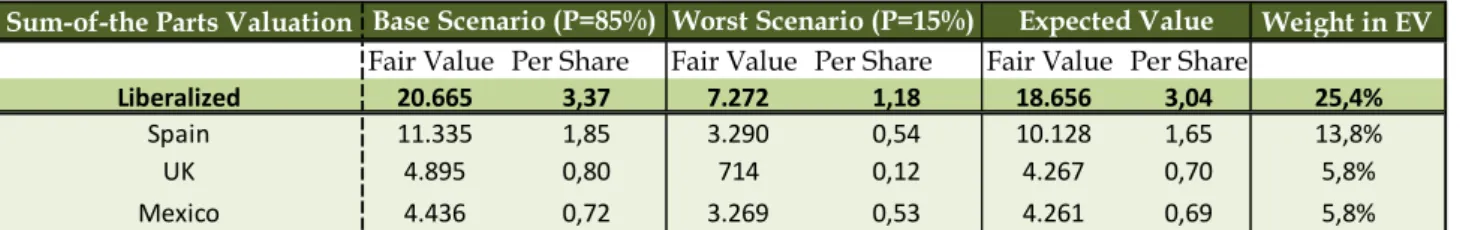
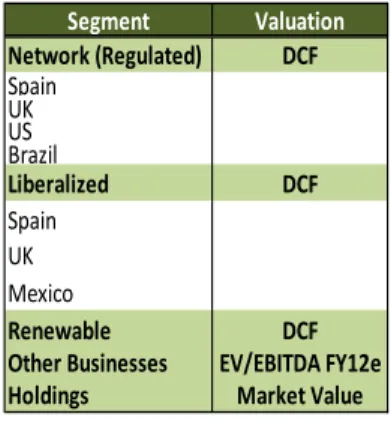
Exhibit 1: Regulated Activities Valuation
(Source: Analyst Estimates)
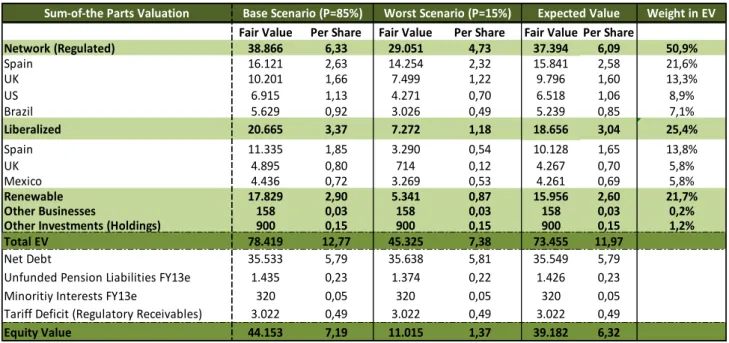
Sum-of-the Parts Valuation Weight in EV
Fair Value Per Share Fair Value Per Share Fair Value Per Share
Network (Regulated) 38.866 6,33 29.051 4,73 37.394 6,09 50,9%
Spain 16.121 2,63 14.254 2,32 15.841 2,58 21,6% UK 10.201 1,66 7.499 1,22 9.796 1,60 13,3% US 6.915 1,13 4.271 0,70 6.518 1,06 8,9% Brazil 5.629 0,92 3.026 0,49 5.239 0,85 7,1%
Base Scenario (P=85%) Worst Scenario (P=15%) Expected Value
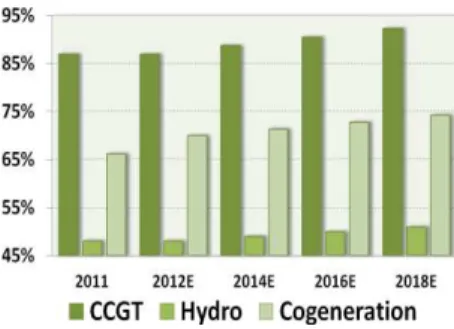
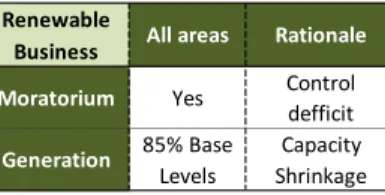
70%). The good positioning of Neoenergia matches with the high wind and hydro potential in the South American country. The company estimates investments totalling €265 Million in Elektro during the period 2012-2014 and the efficiency plan launched in 2012 is forecasted to minimize the impact of the tariff review positioning Elektro among the most efficient distributors within ANNEL´s benchmarking for the next tariff review in 2015. In 2012, the estimated savings in operational expenditures will exceed the R$ 35 Million forecasted objective reaching a value close to R$ 40 Million. Neoenergia investment plan (distribution business) predicts an amount of €565 Million invested in the period 2012-2014. The upcoming project is estimated to increase the number of customers by approximately 866,000 and the energy distributed by 19%. Regarding the generation business, Neoenergia will invest €695 Million in the same period which includes the construction of new hydro plants (Teles Pires, Baixo Iguaçu, and Belo Monte) and wind farms forecasted to double the installed capacity (from 1,600 MW to 3,000 MW). For valuation purposes, we assumed an EBITDA Margin of 31,55% and a steady 26,8% NOE/GM ratio throughout the valuation which is in line with the company´s expectations as well as represents the result of relevant efficiency improvements due the aforementioned efficiency plan launched by Iberdrola. Moreover, we considered an inflation rate of 4,5% in Brazil. Our estimations for CAPEX in the explicit period took into account not only the investment plan for the company for the 2012-2014 period and onwards but also the refurbishment costs associated to the depreciation of the Iberdrola´s Brazilian assets. Graph 11 and Figure 18 represent our assumptions to the expected load factor for each technology and the total generation, respectively.
Valuation
The regulated business was evaluated based on a DCF method valuing separately each country. Even though they are engaged on the same business nature, each country is subjected to different value drivers and associated with different levels of risk and uncertainty. Expectedly, to reflect the opportunity cost
that investors face for investing their funds in one particular country/business instead of others with similar risk we discounted our forecast of FCF by a different WACC for each country in this segment. Within the same reasoning and Graph 11: Generation – Expected
Load Factor for each technology
(Source: Iberdrola, Analyst Estimates)
Figure 18: Expected Total Generation Output (TWh)
(Source: Iberdrola, Analyst Estimates) TWh CCGT Hydro Cogen
2011 1,56 1,81 0,21
2012E 1,55 1,81 0,22
2013E 1,57 1,83 0,22
2014E 1,59 1,84 0,23
2015E 1,60 1,86 0,23
2016E 1,62 1,88 0,23
2017E 1,63 1,90 0,23
2018E 1,65 1,92 0,23
2019E 1,67 1,94 0,24
IBERDROLA COMPANY REPORT
-10% -5% 0% 5% 10%
-10% 6,03 6,03 6,04 6,05 6,05
-5% 6,17 6,17 6,18 6,19 6,19
0% 6,31 6,32 6,32 6,33 6,34
5% 6,45 6,46 6,46 6,47 6,48
10% 6,59 6,60 6,61 6,61 6,62
Energy Distributed GWh
Revenue per unit distributed
Exhibit 2: Revenue per unit distributed Vs Energy distributed
(Source: Analyst Estimates)
bearing in mind the inflation rate, we decided to establish different perpetual growth rates18. Through our analysis we reached a value of €
6.09 per share for
the regulated segment. It represents the most important contributor to our Enterprise Value (EV), representing 50.9% of it (see Exhibit 1).
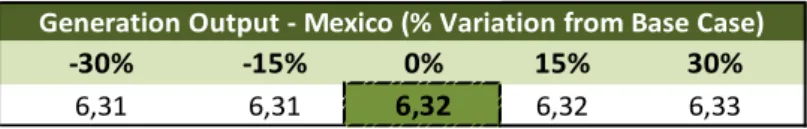
Sensitivity Analysis
Throughout our valuation we performed a sensitivity analysis for each segment in specific. Given the several key uncertainties inherent to any valuation, testing multiple changes at a time would help to prioritize strategic fundamentals as well as to deepen the understanding offered by our valuation. A sensitivity analysis also helps bound valuation range when there is uncertainty about the inputs19. In what regards the regulated segment we decided to test how company´s value in each country responds to changes in the key inputs. We firstly considered the energy distributed (GWh) and the revenue per unit distributed in Spain as the most significant variables to produce higher impact in our price target. Even though the regulated nature of this business provides certain stability on earnings, the domestic business is especially relevant in this segment and therefore an overall change of the base scenario has a significant impact on the share price. Afterwards, since the regulatory return is especially relevant in UK (through the so-called RPI-X Price Control in which Ofgem regulates the price charged to the customers) we decided to test how changes in the actual vanilla return on both businesses (distribution and transmission) would vary the actual price target of the company. Our analysis concluded that variations in those allowed returns would not change significantly the value of the company. In this segment, the USD/EUR exchange rate is especially relevant as a significant part of cash flows is strongly reliant on future exchange rates (€/USD). An increase in the exchange rate implies an appreciation of the euro against dollar, and that leads to a decrease in the price target. As most of Iberdrola´s regulated cash flows are denominated in Euros, potential fluctuations of the dollar are
18 Please consult “Sum-of-the-Parts” sections for more information on this issue
19 Koller, Goedhart and Wessels, Valuation: Measuring and Managing the Value of Companies, 5th Edition, McKinsey &Company, Wiley Finance, 2010.
(Source: Analyst Estimates)
Exhibit 3: Actual Vanilla Return - Transmission Vs Distribution
(Source: Analyst Estimates)
Exhibit 4: Exchange Rate Sensitivity
(Source: Analyst Estimates)
-20% -15% -10% -5% 0% 5% 10% 15% 20%
6,34 6,33 6,33 6,32 6,32 6,32 6,31 6,31 6,31
Exchange Rate (% Variation from Base Case)
-2% -1% 0% 1% 2% -2% 6,34 6,31 6,28 6,25 6,22
-1% 6,36 6,33 6,30 6,27 6,24
0% 6,39 6,35 6,32 6,29 6,26
1% 6,42 6,38 6,34 6,31 6,28
2% 6,45 6,40 6,37 6,33 6,30 WACC (% Variation)
Growth Rate (% Variation)
-30% -15% 0% 15% 30% -30% 6,31 6,31 6,32 6,32 6,32 -15% 6,31 6,31 6,32 6,32 6,33 0% 6,31 6,31 6,32 6,32 6,33 15% 6,31 6,32 6,32 6,32 6,33 30% 6,31 6,32 6,32 6,33 6,33
Actual Vanilla Return - Distribution (% Variation)
IBERDROLA COMPANY REPORT
IBERDROLA COMPANY REPORT
Liberalized Business
The liberalized business includes the power generation (production of energy), and electricity and gas supply (selling of energy to liberalized customers). Since the 1st January 2011 the liberalized business in Iberia, UK, and Mexico has been
integrated in a sole area with the aim of launching a new integrated management and to create a single business unit. This process integration has been created to create synergies, increase operational efficiency, and to optimize structures. The liberalized business represents the second most important contributor to our EV representing 25,4% of it.
Spain (Portuga
l): “Pressured by inneficient technologies”
Iberdrola Spanish liberalized business (which includes also the activities in Portugal) encompasses either the liberalised generation (see Figure 19) or the supply activities (see Figure 20) of the company in Iberia. The first step towards liberalization was taken in 1995, with the publication of a legislation package to transpose Directive 96/92/CE of the European Parliament and Council, of 19th December 1996. Through the liberalization customers may get access to an increased competition in the market, reflected in the level of prices due operating efficiencies and improvements in the quality of the service, which should lead to greater satisfaction on the part of electricity consumers. The distinctive characteristics of the Spanish electricity sector comprise not only the fact that any consumer can freely choose its supplier since the 1st January 2003 but also the existence of the wholesale Spanish generation market (also referred to as the “Spanish pool”). Besides that, either bilateral contracts or the forward market have become a significant portion of the market. On the other hand, in Portugal since the 4th of September 2006, all consumers have been able to choose their electricity supplier. Generation facilities in Spain (see Graph 10) operate under either the Spanish Ordinary Regime or the Special Regime. The supply of electricity is fully liberalized in Spain since the 1st July 2009 and last resort suppliers , appointed by the Spanish government, supply electricity at a regulated tariff set by the Spanish government to the last resort consumers (low-voltage electricity consumers whose contracted power is less than or equal to 10KW). Up to that point, distributors were forbidden from supplying electricity to customers. Prices are then agreed between the final customers (see Graph 11) and the
liberalized suppliers. The main source of operating expenses includes the wholesale market price and the regulated access tariffs (such as transmission, renewable, distribution energy subsidies, past tariff deficits, and others) to be paid to the distribution companies. As mentioned before, without participating in Figure 19: Electricity Production in
Iberia – ORP (TWh)
(Source: EDP)
Figure 20: Electricity Free Retail in Iberia (TWh)
(Source: EDP)
Graph 11: Final Energy Consumption
– Spain (Mtoe) (Source: EDP)
Graph 10: Electricity Generation Mix
– Spain (Twh)
(Source: EDP)
Market Share 2010 2011
Endesa 32% 33%
IBERDROLA 23% 23%
EDP/HC 15% 14% Gas Natural Fenosa 15% 13% Others 15% 16%
Market Share 2010 2011
Endesa 25% 30%
IBERDROLA 28% 25%
EDP/HC 17% 16%
Gas Natural Fenosa 17% 18%
IBERDROLA COMPANY REPORT
the wholesale market, bilateral contracts may also arise as a result of an agreement between electricity generators and liberalised suppliers or qualified consumers. In Spain (see Graph 12), the installed capacity of Iberdrola
(excluding Renewables) amounted to 19,700 MW in the last year. Iberdrola presents a highly diversified energy mix and mostly constituted by low CO2 energies. Hydro and nuclear represents more than half of its portfolio (see Figure 21) which is a guarantee of very low generation operating costs for Iberdrola. Under the ordinary regime, the production totalled 50,026 GWh and the electrical energy supplied during 2011 on the free market amounted to 41,271 million kWh. During the last year, the company supplied 10,310 GWh of gas either to domestic or industrial customers. In Portugal, Iberdrola supplied 5,118 GWh in the last year, leading the market in Medium Voltage industrial customers and coming second in supplies to Small-Medium Enterprises. Concerning the regulatory framework, the so-awaited draft bill on environmental measures and energy sustainability (a bill containing tax provisions relating to energy generation and fuels) is estimated to produce a gross impact of €580 Million per year, in addition to the current tax burden of €330 Million, according to the company. Over the last couple of years, the business has been pressured by overcapacity of inefficient technologies (e.g. solar energies or national coal) and taxes. In the next years, the liberalized segment in Spain will be characterized by increased tax expenses, thermal gap decreasing (nevertheless almost all thermal capacity currently installed is required), and also a slow and gradual internalization of higher costs as well as an excess of offer. Commodity prices are also not offering a stable ground for the business since in the long-term no one can foresee accurately what we may expect. Regarding electricity business, we assumed the achieved price will behave in the long-term as presented in the Graph 13 as well
as the forecasted market price and the access tariff. Along with the generation output (see Graph 14) and the electricity supply volumes, those represented the
main inputs required to calculate the two major sources of revenues: power sales and supply business revenues. We considered a load factor of 90% in 2012 and 84% onwards in the case of nuclear. Concerning lignite, we assumed 14% in 2012, 19% in 2013 and 20% onwards while in the case of CCGT we assumed 22% in 2012, 27% in 2013 and 32% onwards. Finally, in the case of hydro we assumed 12% in 2012 and 18% onwards while assuming a 75,3% load factor in CHP. The steady NOE/GM ratio ranged from 27,2% to 26,5% in 2019 throughout our valuation model due high degree of efficiency after a redesign of commercial processes and IT investments and the EBITDA Margin was around 12% in the period. In the CAPEX projections, the investments in new hydro plans in Spain (La Muela or San Sebastian) were taken into consideration with the exception of CH Tamega in Portugal which is pending administrative process. For several Figure 21: Installed Capacity (2011)
(Source: Iberdrola )
Graph 13: Estimated Prices (EUR/MWh) – Iberian Market
(Source: Iberdrola, Analyst Estimates)
(Source: Iberdrola, Analyst Estimates) Graph 14: Forecasted Generation Output (TWh)
(Source: EDP)
IBERDROLA COMPANY REPORT
reasons we strongly believe this investment is not adequate given the current economic environment. Firstly, Portugal is experiencing a though business environment. Secondly, the evolution of energy consumption (e.g. the electricity balance - hydro resources, under the ordinary or the special regime has gone down about 27% in the last year) in Portugal does not incentivize companies to engage on significant capital outflows. And finally, unless the Portuguese economy turns around faster than predicted the past business model for the hydro business is no longer sustainable.
UK: “Carbon t
ax poses a ch
allenge”
In the UK, the deregulated business is carried out by SP through the following asset management businesses (see Figure 22): SP Generation (within this division is SP Management, responsible for buying and selling wholesale energy), and SP Energy Retail (within this division is SP Dataserve, responsible for the metering and data management work). In its UK-liberalized business the installed capacity (excluding SPW Renewables) totalled 6,036 MW comprising coal, gas, pump storage and hydroelectric which provides to the business a diverse and flexible portfolio (see Figure 23). The production deriving from
Iberdrola’s conventional generation was 20,584 GWh in 2011 and in the last year the company sold 22,019 GWh of electricity and 28,392 GWh of gas. The regulatory framework has been strongly pressured by the “carbon tax” by which its implementation is expected to impact the market equilibrium in the mid-term. From April 2013, a starting £4.94/MWh tax will be applied on CO2 emissions. Along with the “carbon tax”, market prices have already incorporated the higher costs of the marginal technology (CCGT) which will be taxed at £1.90/MWh and consequently coal-fired production competitiveness will rapidly deteriorate due to tax pressure on this technology. If there is no further capacity payments, 15,000 MWh of coal are 'at risk'. The only alternative to close during the 2016-20 period would be to lower the reserve margin20 to undesired levels below the 5% acceptable rate (see Graph 15). However, the Department of Energy and Climate Change (DECC) is already reviewing a plan to run the legal framework for a capacity market in such a way that the first auction could potentially run in 2014 for capacity to be in place by 2015-1621. To offset the reduction in coal-fired
capacity, Iberdrola is investing in the 389MW West of Duddon Sands wind farm with Denmark-based Dong Energy, a 217MW extension to the Whitelee wind farm, and 1,900 MW of CCGT capacities, including the 1,000 MW Damhead
20 Reserve Margin = Firm Capacity/Peak Demand. For instance, a reserve margin of 20% means that an electric system
has excess capacity in the amount of 20% of expected peak demand
21 According to the European Directives, the regulator must clarify this regulatory uncertainty before December 2013 deadline
The current macroeconomic environment does not encourage such a huge investment
Figure 22: Deregulated Business
Figure 23: Installed Capacity per technology
(Source: Iberdrola)
(Source: Iberdrola, Ofgem)
Graph 15: Reserve Margin – Scenario w/ Capacity Payments
IBERDROLA COMPANY REPORT
Creek 2 project. In the short-term the company expect a reduced need for thermal gap. Nevertheless, a significant part of the installed capacity will disappear in the near term as a result of obsolesce and novel environment regulation derived from the carbon floor effect22 that reduces future spreads and makes the extension of the useful life of said thermal facilities beyond 2018 challenging. On the other hand, the electricity market reform which aims at incentivizing major investments to replace the obsolete generation fleet, meet environmental goals and guarantee supplies is expected to represent a good opportunity for the generation business. Regarding the electricity supply, we assumed the electricity sold will remain almost steadily and the forecasted selling price as presented in the Graph 16. According to our projections, power sales
and electricity supply will be the most important contributor to revenues (see Graph 17) in UK in the long-term representing together almost 35% of the overall revenues in 2019. For valuation purposes, we assumed a load factor of 40% in 2012 and 42,5% onwards in the case of Lignite. Concerning OCGT, we assumed 73% along the forecasting period while in the case of Hydro we assumed 13% in 2012 and 18% onwards. Finally, in the case of CHP we assumed 40% in 2012 and 50% thereafter.
Mexico
: “Stable busin
ess
–
PPA Agreements”
In Latin America, Iberdrola is the leading private electricity producer in Mexico with an installed capacity of 4,968 MWh. The business is carried out through Iberdrola Mexico, a subsidiary of the Spanish Group Iberdrola dedicated to the generation and transmission of electricity. The electrical energy supplied was 37,002 GWh in 2011, 7% higher than the figure for the previous year. Iberdrola´s energy portfolio in this Latin American country is mostly based on thermal energy. Mexico presents a very stable business as most of the production is sold to Comisión Federal de Electricidad (CFE) under long-term contracts through Power Purchase Agreements (PPA) which involves a significantly lower risk. The availability has been maximising and is expected to be maintained in the next years. The current environment presents higher demand for electricity, higher competitiveness of gas versus other technologies, and competitive gas prices versus CFE tariff. The growth investment plan for the upcoming years will be based on short-term opportunities including the €90 Million expansion of the company's Enertek and Monterrey Cogeneration plants, as well as a new thermo plant being tendered by CFE in the 1st Quarter 2013. Iberdrola will also bet on enhancing efficiency management of energy surplus and improve efficiency as
22
The carbon price floor was introduced by the British Government with the clear aim of providing certainty for low-carbon investment through a clear schedule of rising low-carbon prices, which will favor nuclear and renewable energy as well as gas.
Graph 16: Electricity Selling Price
(Source: Analyst Estimates)
Mexico – Very stable business as the bulk of its production is sold through PPA Agreements
Significant short-term
opportunities are expected to arise (Source: Analyst Estimates)