THIS REPORT WAS PREPARED BY RITA MANTAS, A MASTERS IN FINANCE STUDENT OF THE NOVA SCHOOL OF BUSINESS AND ECONOMICS, EXCLUSIVELY FOR ACADEMIC PURPOSES.THIS REPORT WAS SUPERVISED BY ROSÁRIO ANDRÉ WHO REVIEWED THE
VALUATION METHODOLOGY AND THE FINANCIAL MODEL. (SEE DISCLOSURES AND DISCLAIMERS AT END OF DOCUMENT)
M
ASTERS IN
F
INANCE
E
QUITY
R
ESEARCH
We initiate our coverage with a PT FY15 of €13.66 and a Hold recommendation. Poor power and commodities’ prices pose a heavy burden on the earnings of Conventional Generation. While the nuclear phase-out in Germany until 2022 will lead to a shortage of power production by 2023, the latest Russian economic turmoil is also expected to affect E.ON’s earnings in 2015.
In Germany the new regulatory period carried lower allowed revenues on the regulated asset base. Moreover, we expect further discussions in 2015 on the possibility of a capacity market in Germany, following the UK’s auction, which would pay for
Generation’s power plants not operating at a sufficient level.
By 2016 the spin-off will have materialized. E.ON will focus on organic growth from regulated businesses, whereas the New Company will be more exposed to commodities’ prices and foreign exchange rates movements –main negative risks for today’s E.ON valuation - despite no debt. We see no substantial gain from the transaction, but a clear separation between good and bad assets.
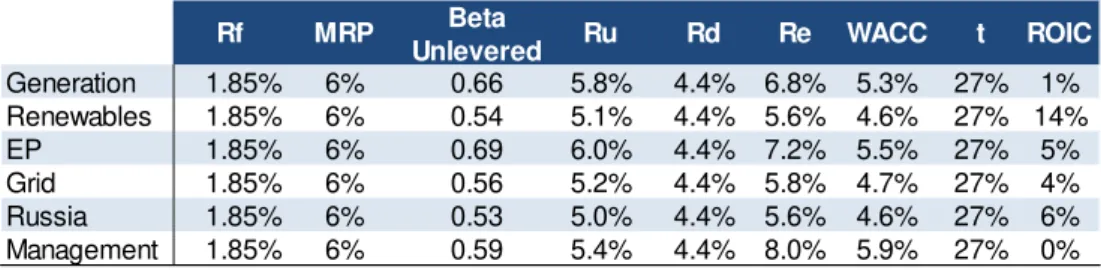
Our PT FY15 of €13.66 reflects a potential gain of 3%. It covers 85% chance of a base scenario, based on a SOTP valuation (44% of Grid; 26% of Renewables; 14% of Generation; 12% of EP, and 4% of Russia) and a pessimistic scenario over Russia. Overall, our valuation is based on the DCF model and multiples, with a WACC for the different business segments ranging between 5% and 7%. Company description
E.ON is one of the largest investor-owned energy companies in the world and the largest German utility. Its activities include conventional generation of fossil fuels and nuclear power, renewable energy, exploration and production of oil and gas, trading global commodities and managing network connections in and outside Europe.
E
.
ON SE
C
OMPANY
R
EPORT
UTILITIES
07
J
ANUARY2015
S
TUDENT
:
R
ITA
M
ANTAS
[email protected]
Spin-off to shed weak performance
Clear separation between good and bad assets
Recommendation: HOLD
Vs Previous Recommendation HOLD
Price Target FY15: 13.66 €
Vs Previous Price Target 12.53 €
Price (as of 06-Jan-15) 13.27 €
Reuters: EONGn.DE, Bloomberg: EOAN.GR
52-week range (€) 12.23-15.46
Market Cap (€m) 26,553
Outstanding Shares (m) 2,001
Volume 10,516,233
Source: Bloomberg, Company data
Market Performance
0 20 40 60 80 100 120 140 160
2010 2011 2012 2013 2014
E.ON SE DAX Index MSCI Utilities Index
Source: Bloomberg
(Values in €m) 2013A 2014E 2015F
Revenues 122,450 113,332 100,122
EBITDA 9,315 8,242 8,212
Adj. Net Income 2,142 1,457 1,699
EPS 1.12 0.75 0.88
DPS 0.6 0.5 0.5
P/E 12.0 17.2 15.2
EV/EBITDA 6.24 6.26 6.18
EV/EBIT 10.24 11.21 10.78
Net debt/EBITDA 2.5 2.7 2.7
ROA (%) 1.9 1.4 1.6
ROIC (%) 5.4 4.2 4.5
E.ONSE COMPANY REPORT
Table of Contents
COMPANY OVERVIEW ... 3
COMPANY DESCRIPTION ... 3
SHAREHOLDER STRUCTURE ... 5
LEVERAGE STORY AND CREDIT PROFILE... 5
COMPANY’S STRATEGY ... 7
MARKET OVERVIEW ...11
SUPPLY AND DEMAND ... 12
POWER PRICES ... 14
CAPACITY MARKET ... 16
BUSINESS SEGMENTS ...17
CONVENTIONAL GENERATION ... 17
RENEWABLES ... 18
EXPLORATION AND PRODUCTION ... 19
GRID ... 20
RUSSIA ... 22
MANAGEMENT GROUP ... 22
VALUATION ...23
WACC ... 24
COST OF DEBT ... 25
EQUITY INVESTMENTS AND PROVISIONS ... 26
MINORITIES ... 26
SUM-OF-THE-PARTS ... 27
SENSITIVITY ANALYSIS ... 27
SCENARIO ANALYSIS ... 28
APPENDIX ...31
APPENDIX I:E.ON’S ECONOMIC NET DEBT ... 31
APPENDIX II:SPIN-OFF DETAILS ... 31
APPENDIX III:DECOMMISSIONING OF E.ON’S NUCLEAR POWER PLANTS ... 32
APPENDIX IV:MERIT ORDER CURVE ... 32
APPENDIX V:RENEWABLES FEED-IN TARIFFS ... 32
APPENDIX VI:INVESTMENT PIPELINE IN RENEWABLES UNTIL 2017 ... 33
APPENDIX VII:DISTRIBUTION REGULATION IN GERMANY ... 33
APPENDIX VIII:COMPETITORS’ DATA ... 34
APPENDIX IX:SOTPVALUATION FY15 ... 34
FINANCIAL STATEMENTS ...35
DISCLOSURES AND DISCLAIMER ...36
E.ONSE COMPANY REPORT
Executive summary
E.ON is one of the largest utilities operating in Europe. Currently, the company operates in a broad range of business units including conventional power generation and renewables; exploration and production of oil and gas, trading activities and power and gas distribution throughout Europe. E.ON also operates in Russia, with a stable market position (84% interest ownership), and recently in Brazil (43%) and Turkey (50%).
Externally, the weakening of commodities’ prices, owing to lower consumption
demand and economic growth, has contributed to low energy prices with German forward prices following a downward trend. The price of the Brent crude oil has been falling more than 40% since August 2014 to levels lower than $60 per barrel, while the price of Coal reported a milder decrease of 18%. In 2013,
E.ON’s revenues and EBITDA lowered by 7% and 17% yoy, respectively, also owing to the effect of disposals in previous years. European directives continue to favour renewables and making companies to lower CO2 emissions by 20%, with tighten targets for German utilities of 40% by 2020. Moreover, current tensions in Russia caused a deep devaluation of the rouble with government yields reaching 17%. Uncertainties on whether the country is entering a crisis, as
in the end of the 1990’s, remain to be observed in 2015. Internally, E.ON is undergoing a cost savings program to lower operating costs in key segments. Also, the nuclear phase-out in Germany is compromising production in the long-term, as it accounts for the closure of 5,403 MW (9% of total installed capacity) until 2022. Furthermore, the grid is now subject to a new regulatory period in Germany, lowering the allowed return on the regulated asset base.
In 4Q14, E.ON announced a large scale restructuring. Following the day of the spin-off announcement, share price rose 4.24% with investors valuing the operation in €1,161 mn. Although we estimate no change in our valuation following the spin-off, our FY15 price target (PT) of €13.66 per share includes 85% probability from our base scenario, a sum-of-the-parts (SOTP) valuation, and 15% attributable to the impact of Russia’s defaulton E.ON’s earnings.
Company overview
Company description
E.ON is one of the largest global investor-owned energy companies and the largest German utility listed in the German Stock Index (DAX) by market capitalization. The company was formed in 2000, after the merger between
Low energy prices have been affecting negatively E.ON’s results for the last years
Largest German utility listed in the DAX
E.ON is a key player in the European power market
E.ONSE COMPANY REPORT
Fig. 4 – External sales by location of
customer (2013)
39%
31% 26%
3% 1%
Germany UK
Other Europe Sweden Other
Source: Company Data
Fig. 1 –Market Performance (2000-2014)
0 50 100 150 200 250 300
2000 2002 2004 2006 2008 2010 2012 2014 E.ON DAX Index MSCI Europe Utilities
Source: Bloomberg
Fig. 2 – German Utilities Market
Performance (2000-2014)
0 50 100 150 200 250 300
2000 2002 2004 2006 2008 2010 2012 2014 E.ON RWE EnBW DAX Index
Source: Bloomberg
Fig. 3 – E.ON events and market
performance (2010-2014)
Source: Bloomberg
VEBA and VIAG, establishing E.ON as one of the world’s largest energy service providers and chemical group by then.
Until the financial crisis in 2008, E.ON together with other utilities undertook financial investments to boost operations leading to a period when European utilities overinvested in generating capacity. E.ON market performance reached its pick in 2007 and the stock has been losing value ever since. Both RWE and EnBW, E.ON’s two direct competitors, showed a similar behaviour of poor market performance, losing about half of the market value worth in 2000. Unfortunately, power demand did not live up to expectations and, when the financial crisis hit, companies already had too much money tied up to expensive investments. One of the many consequences, were losses of billion euros, as investments did not materialize into profits. As referred by The Economist1 in October 2013, “since September 2008, utilities have been the worst-performing sector”.
From 2011 onwards, E.ON has committed itself to change its energy mix, lower financial debt and reduce operational costs. Because current power demand and electricity prices continue to fall, much of the power plants do not produce up to a level which pays for its use. Also, the Fukushima disaster (2011) made the German government to rapidly request utilities to decommission all nuclear
power plants (NPP’s) with E.ON required to close eight out of the eleven NPP’s permanently. Last but not the least, international goals to reduce CO2 emissions by 2020 require European utilities to shutdown highly pollutant fossil fuels under the Large Combustion Plant Directive (LCPD). According to the Directive 2001/80/EC, the European Union (EU) establishes yearly limits for emissions of pollutants from large combustion plants with installed capacity of at least 50 MW. Nevertheless, as a whole E.ON currently operates in a wide variety of business segments across different regional markets. In 2013, E.ON’s sales accounted for more than 700 TWh of electricity, as well as more than 1,000 TWh of gas. Owned generation of electricity represented only 35% of total sales, whereas the remaining was obtained through purchase contracts of jointly owned power plants and outside sources. Gas sales were procured outside the company and, hence, are not related to E.ON’s own generation. Its activities include conventional generation of fossil fuels and nuclear, renewable energy, exploration and production of oil and gas (EP) in the North Sea and Russia, trading global commodities2 and managing power and gas distribution in and outside Europe. Although Europe represents E.ON’s primary market (Germany represents circa 39% of E.ON’s external sales), the company has also expanded its operation to Russia, where E.ON Russia is listed in the MICEX Index, as well
1
See The Economist, October 12th
2013, How to lose half trillion euros. 2
E.ONSE COMPANY REPORT
Fig. 5 - EBITDA by segment 9M14 (in € mn)
2,643
1,553 1,336 1,107
339
(341) (750)
750 1,500 2,250 3,000
Grid Generation EP Renewables Russia Group Manag.
Source: Company data
Fig. 6 – Top 10 Investors in million
shares (Dec-2014)
6.5%
3.0%
1.3% 1.3%1.2% 0.9% 0.8%
0.7%0.7% 0.6%
30 60 90 120 150
Source: Reuters
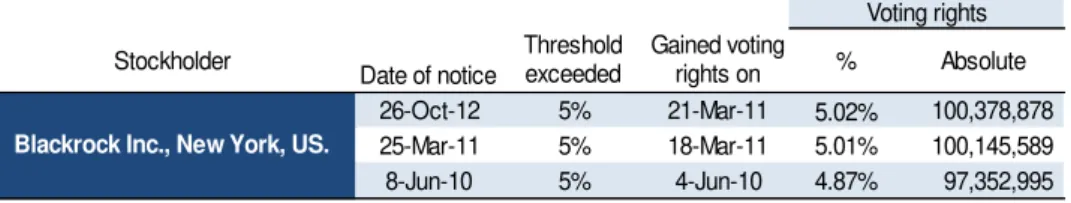
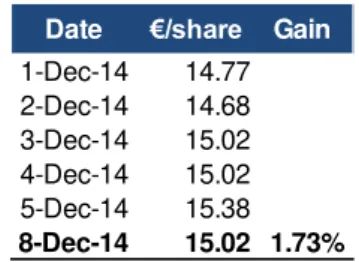
Table 1 – Blackrock voting rights, 2010-2013 (in mn shares)
Stockholder
Date of notice
Threshold exceeded
Gained voting
rights on % Absolute 26-Oct-12 5% 21-Mar-11 5.02% 100,378,878 25-Mar-11 5% 18-Mar-11 5.01% 100,145,589 8-Jun-10 5% 4-Jun-10 4.87% 97,352,995
Voting rights
Blackrock Inc., New York, US.
Source: Company data
as more recently to Brazil in 2012 (E.ON owns 43% of Eneva) and Turkey3 in 2013 (E.ON owns 50% of Enerjisa) through equity stakes and joint ventures. Despite the current challenges, E.ON has always benefitted from a stale share of its earnings from regulated activities. As for 9M14, 36% of total EBITDA came from regulated businesses, followed by conventional generation of nuclear power and fossil fuels to produce electricity (21% of total EBITDA). Renewables’ earnings have grown over the last years, particularly owing to wind onshore and offshore farms, which together with solar, represent more than 50% of
Renewables’ EBITDA. In 2014, E.ON only increased the portion of investments in the Renewables business unit (+57% yoy). As for 2015, no guidance has been announced yet.
Shareholder structure
Owing to the relatively safety profile of utilities as compared to other industries, E.ON has a standard shareholder base. Out of the 2,001 mn shares outstanding,
93.5% are free float. Institutional investors hold more than 70% of E.ON’s shares.
As of December 2014, Blackrock Asset Management Deutschland held 6.54% of total outstanding shares, corresponding to 130.78 million shares, followed by other institutional investors and funds. Nevertheless, Blackrock appears to be the larger outside investor with Blackrock Institutional Trust Company holding 1.32% of total shares and Blackrock Advisors (UK) Limited ranging in the 10th position with a 0.63% stake. Overall, in 2013 E.ON’s shareholder structure consisted of 72% attributable to investment advisors, while the remaining 28% were owned by retail investors. In 2013, Germany was the region where most investors were located (41%), followed by the US and Canada (17%) and the UK (12%).
Leverage story and Credit profile
In order to strengthen its financial position, E.ON has improved its net financial position through reductions in controllable costs in all business units and proceeds from asset disposals. In 2013, E.ON succeeded in lowering economic
net debt by 10% yoy to €32 bn and we estimate continuing progress and further
3
E.ONSE COMPANY REPORT
Fig. 7 – Debt issued by currency
(As of Nov-14)
30%
22% 22%
13% 5%4%
3% 1%
EUR USD JPY GBP
SKK HKD NOK CHF
Source: Bloomberg
reduction in 2014 to €29bn, owing to further asset disposals4. However, the debt factor5 is unlikely to lower below 3x EBITDA, as E.ON aims to. Despite improved net financial position, EBITDA has been lowering considerably yoy and we estimate for 2014 such trend to persist with a debt factor above 3.5x EBITDA. Additionally, we expect lower economic net debt in the following months owing to asset disposals in Iberia and Italy which would reduce it by 16%-17%. According
to E.ON’s announcement of the Iberian sale, 2014E Economic Net Debt may
possibly already lower by €2.5 bn and Italian assets are likely to raise €2 bn in cash to lower debt in 2015. However, we do not include this adjustment in our estimates, since the amount in euros has not been confirmed by the company or the respective assets up to sale6.
Moreover, the company has not issued debt since 2009 and been able to rely on the resources obtained through asset disposals to lower debt, as well as on the costs savings program implemented in 2011 - E.ON 2.0 program – to reduce operating expenses. Despite no floor, financial debt has been falling since 2009, as the company has been able to use much of its cash from disposals to lower debt levels. Nevertheless, 30% of its debt is denominated in EUR, followed by 22% in JPY and another 22% in USD. In the 2000’s, the majority of utilities were all graded A or higher; however, since 2008 the macroeconomic scenario has changed and many have been downgraded. After the merger in 2000, E.ON was submitted to several divestments, while joining two companies into one. The company succeeded and by 2004, when it was graded Aaa3 by Moody’s with very low credit risk. The second round of divestments started in 2011, after a period of high expectations of continuing high power demand and of growth expectations for emerging economies. Following the aftermath of the crisis and the Fukushima disaster, E.ON had to adjust its power production, which required cutting expenses, shutting down power plants and selling part of its assets and businesses. Until July 2012, E.ON was rated A with a table outlook by S&P’s, but since then E.ON’s credit rating fell one notch to A- in S&P’s, and remained A3 in
Moody’s, both assigned with low credit risk. This year, following the demerger announcement, S&P’s attributed E.ON negative outlook. Although most European utilities are still assigned with investment grade, all of them saw a downgrade of their credit rating after the 2008-2009 period. In terms of cost of debt, there is some discrepancy across utilities within Europe. According to Berk and DeMarzo in Corporate Finance7, using the yield to maturity (YTM) of a bond as cost of debt one is likely to overestimate the expected return debt owners
4
See Asset rotation and asset disposals under Company’s strategy for further details. 5
Debt factor consists of EBITDA over Economic Net Debt. Economic Net Debt corresponds to the net financial position with pension obligations and asset retirement obligations (less pre-payments to the Swedish nuclear fund).
6
See Appendix I for details on E.ON’s historical economic net debt, credit rating and investments. 7
E.ONSE COMPANY REPORT
Table 2 –Peers’ cost of debt and
credit rating (as of Dec-14)
EDF 1.93% A+
GDF Suez 2.63% A
SSE 2.25%
A-E.ON 4.45%
A-EnBW 2.77%
A-CEZ 3.62%
A-Fortum 3.25%
A-RWE 4.50% BBB+
Verbund 3.71% BBB+
Iberdrola 3.22% BBB
Enel 3.76% BBB
Gas Natural 4.47% BBB
EDP 2.86% BB+
Source: Bloomberg and analyst’s estimates
Note: Corporate bonds used mature in
6 to 8 years; with no options attached; they all are euro denominated, and were issued at an amount equal or larger than €500 mn.
Fig. 8 – Split of business segments
Nuclear Hydro Trading Germany Fossil Fuels Wind
Natural Gas, Oil Solar
EP of oil & gas
Other EU countries
E.ON
Conventional
Generation Networks Russia Exploration
& Production Renewables
New E.ON
Networks
Wind
Solar
New Company
Russia Exploration & Production
Hydro Conventional Generation
Source: Company data
would receive by investing in a bond, since one would be ignoring the risk of default of the asset. Consequently, one way possible is to estimate the probability of default and expected loss rate, based on the average loss rate for unsecured debt and the company’s bond credit rating. Based on E.ON’s issued bond maturing in 2020 with a coupon of 5.75% and YTM of 4.57%, we estimate the
company’s expected return for investors at 4.45%8, based on an expected loss rate for sr. unsecured debt of 62.2% and an annual default rate of 0.2%.
Company’s strategy
2016 Spin-off
In November 2014, E.ON announced a new corporate strategy in which the company will split itself into two public listed companies. While struggling with improving its market performance due current challenges in the industry, E.ON announced the creation of an independent company, as it aims to streamline operations through a spin-off of business units which are experiencing no growth and leaving out business units with higher growth prospects. This transaction will allow E.ON to focus on organic growth through stable and low volatile earning businesses, namely, distribution (including operations in Turkey), renewables and customer solutions. The New Company will cover power generation, hydro, trading and EP activities9, as well as Brazil and Russia’s operations – non-regulated activities. It will bear nuclear liabilities; risks related to nuclear litigation outcome, capacity markets and carbon market reform, using the respective assets as collateral. The New E.ON’s financial structure will bear the burden of less than €30 bn of financial debt, so the New Company will be more financially flexible, despite the uncertainty, for instance, on commodities’ prices
development and the amount of provisions related to NPP’s. We believe the debt allocation might have worse consequences for the credit rating of the new E.ON, as compared to the New Company, due to the financial debt burden with lower amount of assets as collateral. If succeeded, we estimate two different valuations, based on different business models from 2016 onwards (i.e.: type of competitors). We see this split of E.ON as a separation between good and bad assets. TheNew Company will benefit from current large market share on power generation within a mature industry. Hence, it is likely to have some competitive advantage, as a lower-growth business with a cash-generation capability. On the other side, there will be a business suitable to institutional investors whose preferences focus on companies with stable earnings, as the spin-off will separate the uncertainty surrounding nuclear and fossil fuel assets, where
8
For more details, see Cost of Debt. 9
See Appendix II for further operational details on the spin-off.
The company will split itself into two public listed
E.ONSE COMPANY REPORT
Fig. 9 – E.ON Owned Generation 9M14
(as % of total)
60% 33%
7% 8%
76% 16%
Nuclear Fossil Renewables Germany
Outside Germany
Source: Company data
business might go very well or the extremely opposite, from more growth promising segments. We see this transaction as a way to 1) overcome the current macroeconomic challenges in the power and commodities’ markets and 2) bring more transparency into the different business segments’ operations, especially when valuing the different businesses. Consequently, we see this shift in strategic view as strategically positive. Overall, we believe that by following this strategy E.ON strongly advocates that the resulting companies will be worth more as independent entities than as parts of a larger business10.
The spin-off will only materialize in 2016, when the New Company can be listed through an IPO. Many issues over governance, guidance, employees division are still to be clarified within the next two years. E.ON only announced operational details and claimed for a DPS below €0.6 for the next two years.
Nuclear phase out
In 9M14, nuclear power represented 60% of E.ON’s total generating capacity in Germany, approximately 31.1 TWh. Outside Germany, fossil fuels were the main resource used to produce power (51.1TWh of natural gas an oil were produced, followed by 20.4 TWh of hard coal).
Because of the accident in Fukushima in March 2011, Germany had to reverse its energy policy. German utilities are currently seeking damages from the government for the early closure of their nuclear power plants. So far German courts have granted E.ON and RWE €2.2 bn. Several law suits are outstanding with RWE pursuing a three-month moratorium suit that E.ON has yet to follow. Nevertheless, Germany intends to eliminate current use of nuclear power by 202211 and implement a gradual replacement of fossil fuels by renewables. As for E.ON, it represents a total of 5,403 MW of nuclear installed capacity in Germany (8.6% of total installed capacity). The German Nuclear Energy Act has undergone amendments to accommodate the rapid nuclear phase out. The operating lives of nuclear power stations are to be extended for an average of 12 years. The lives of plants that began operating before or in 1980 will be extended by eight years, and that of newer plants by 14 years. In return, NPP operators will have to pay a fuel rod taxof €2.3 bn annually into the federal budget. As of 1 January 2011 until December 2016, the German Nuclear Fuel Tax Act will tax the nuclear fuel used in the commercial production of electricity. Note that E.ON anticipated the closure of one of its NPP to mid-2014, which was scheduled only to 2015. We see this as a positive contribution in the short-tern, since nuclear operating expenses will lower already in 2014 owing to the lower nuclear fuel tax rod payment associated to the early NPP closure. Moreover, from 2017 onwards
10
See Scenario Analysis for more details on the spin-off. 11
See Appendix III to closure dates of NPP’s in Germany.
In Germany, NPP operators have to pay a fuel rod tax of €2.3 bn annually…
In 2011, Germany had to
E.ONSE COMPANY REPORT
E.ON, as well as other Utilities operating in Germany, may no longer have to pay for further taxes on nuclear power, which will positively affect earnings over this technology. Furthermore, energy companies have consented to pay €9/ MWh of nuclear electricity into a fund for renewable energy (between the German Federal Government and the nuclear plant operators) in 2017, as well as the Bill to Create a Special Energy and Climate Fund. E.ON, EnBW, RWE and Vattenfall
will be paying €300m annually into the fund in 2011 and 2012, as well as €200m annually from 2013 to 2016, as a non-redeemable advance on the subsidy payments due in 2017.
From 2013, the German energy policy has established its pillars on the
Energiewende (Energy Transition) in order to implement a system, in which
renewables would become the primary focus. By then, renewables’ share as a
primary energy consumption resource was 11.8% in Germany, according to the AGEB (Arbeitsgemeinschaft Energiebilanzen - Working Group Energy Balances). It is presumed that fossil fuels, wind power, solar power, and biofuels will be enough to replace the existing capacity from nuclear power after the decommissioning. However, we see the ongoing phase as a concern for E.ON’s profitability in the long-term, since nuclear power represents the main share of
Generation’s installed capacity and earnings are already being penalized with further downward pressure on future earnings. Therefore, if no market design is implemented to compensate those upcoming losses, production and earnings estimates are likely to continue to be penalized.
In terms of fossil fuels’ generation, highly pollutant steam power plants are an environmental concern in Europe. In this sense, the LCPD aimed to reduce acidification, ground level ozone and particulates by controlling the emissions of sulphur dioxide, oxides of nitrogen and dust from large combustion plants in EU Member States. E.ON owns stakes in steam power plants in the UK, as well as in other European countries, for which has already been announced closure dates. For those which were built after 1987, they ought to comply with the LCPD. Those include Ratcliffe and Grain power plants, which will close by 2015. Ironbridge was converted into biomass, whereas Kingsnorth has been already closed. Power plants in operation before 1987 (namely coal and oil in the UK) are defined as existing plant, which can either comply with the LCPD through installing emission abatement (Flue Gas Desulphurisation) equipment or simply opt-out of the directive. An existing plant that chooses to opt-out is restricted in its operation after 2007 and must close by the end of 2015.
E.ON 2.0
In 2011, E.ON urged to implement a cost savings program which would allow the company to reduce variable costs from €11bn to €9.5 bn in 2015. Initial
E.ONSE COMPANY REPORT
Fig. 10 – E.ON 2.0 net cost savings
Source: Company data
measures in E.ON 2.0 program included important agreements with trade unions (ver.di and IGBCE) on a collective bargaining contract, which would allow E.ON to reduce its workforce. Compensations to the Board Management would also be reduced to a level below the average of DAX 30 companies. Such improvement would allow E.ON to become more cost-efficient, financially flexible and leave a higher margin to plan future investments. By 2013, the company had already lowered its workforce load by 7,700 employees (out of 11,000 estimated by the end of 2015) and its trajectory estimates a reduction to €8.2bn in 2015. In 2014, E.ON expects that most of its measures will have been implemented. As for November 2014, the company will have already achieved €0.9bn out of €1.3bn in net cost savings. Part of the cost savings are planned to be reinvested by the company in operational improvement and growing opportunities in the long-term. We see this program as an efficient way to surpass part of the current difficulties in delivering earnings, given the current macroeconomic scenario. One example is the Generation from nuclear and fossil fuels higher EBITDA in 9M14 yoy, as it benefitted from lower operating expenses, despite lower sales revenues.
Asset rotation and asset disposals
Along with the company’s goal of lowering variable costs, E.ON has also focused on selling part of its noncore assets portfolio, renewable assets and shares held in subsidiaries in southern Europe. Since 2011, E.ON has affirmed itself as a capital intensive company and has not been the operator and sole owner of renewable assets. The asset rotation program encompasses most renewable assets of the company in strategic geographic areas, namely, in the US and Canada (8.2 GW), as well as in Europe (4.3 GW). In the US, E.ON has sold 80% stake on two wind farms by $650 mn and still owns approximately 2,700 MW of installed capacity. The deal included the disposal of 203 MW in Magic Valley 1 in Texas and 202 MW in Wildcat 1 in Indiana, which provided power to 120,000 household and started operations in 2012. Therefore, we see Renewables having a great potential to grow in the upcoming years, owing to the successful buy-and-sell strategy with continuing lower feed-in-tariffs.
Another asset disposal occurred in October 2014, E.ON and RWE announced Urenco sale. Both companies owned a 33% stake in nuclear-fuel supplier Urenco and are likely to raise €3.3 bn. Urenco shareholders asked potential buyers to make initial offers by year end in a bid to raise as much as €10 bn. As for E.ON, nuclear energy production does not make part of its business strategy, given Germany plans to phase out nuclear power by 2022. Uranium prices have recovered since May, when they hit a record low, boosting Urenco's value.
Generation benefitted from higher 9M14 EBITDA due to E.ON 2.0 Program
Successful buy-and-sell-strategy in Renewables...
E.ONSE COMPANY REPORT
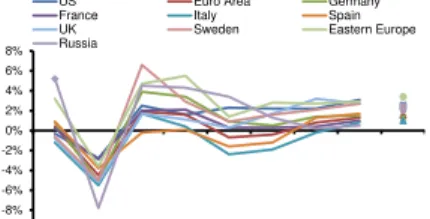
Fig. 11 –Gross Domestic Product in real
terms, 2008-2015, 2019 (annual % ∆)
-10% -8% -6% -4% -2% 0% 2% 4% 6% 8%
2008 2009 2010 2011 2012 2013 2014 2015 2019
US Euro Area Germany France Italy Spain UK Sweden Eastern Europe Russia
Source: IMF World Outlook – Legacies, Clouds and Uncertainties, October 2014
Fig. 12 – Consumer Prices Index,
2008-2015, 2019 (annual % ∆)
-3% 0%
3% 5% 8%
10% 13%
15%
2008 2009 2010 2011 2012 2013 2014 2015 2019
US Euro Area Germany France Italy Spain UK Sweden Eastern Europe Russia
Source: IMF World Outlook – Legacies, Clouds and Uncertainties, October 2014
In November 2014, E.ON sold to the Finnish state 20% of its stake in the natural gas company called Gasum Oy, whose operations included import, distribution and sale of natural gas. This transaction granted € 0.2 bn to E.ON.
Yet to define until 2014 year-end are the details on the sale of the Iberian assets, whose operating business gathered potential buyers since August. According to Dow Jones, E.ON reached an agreement on November 28th with Macquarie, Australian investment bank, and Kuwait Investment Authority (KIA),
Kuwait’s wealth sovereign fund, to sell Iberian assets by €2.5 bn. However, it is unclear whether E.ON is selling the entire business or only parts of it. Operations comprise 3.2 GW of thermal generation capacity, 1.1 GW of renewables (including in Portugal), plus a supply business with 688,000 customers and
distributed network with a RAB of €0.8 bn. On what concerns E.ON Italy, it is less clear in which step the current disposal is. Italy’s portfolio includes 0.9 GW of hard coal capacity, 3.6 GW of Combined Cycle Gas Turbine (CCGT) and 0.9 GW of renewables, plus a supply business with 0.2 mn electricity and 0.6 mn gas customers (3% of total customers in Europe in 2013).
We see both asset disposals as a way for E.ON to raise additional cash which will lower financial debt (by approximately €4 bn). Although those sales come as the unique solution to leave weak market positions, the amount by which E.ON will sell them is likely to lead to high impairment losses (so far amounted to €4.5 bn), given the vulnerable macroeconomic scenario in Europe. Additionally, E.ON claims to be reviewing disposals on EP assets in the North Sea.
Market overview
As mentioned previously, the energy market has been adversely affected by a fragile economic recovery, particularly, in Europe. The consequences of the sovereign debt crisis followed by the implementation of structural reforms have
adversely affected households’ income. Real gross domestic product (GDP) is today nearly positive in Central Europe and is expected to reach 2%, on average, by 2019. When assessing Consumer Prices Index (CPI), most countries’ inflation is expected to vary between 0 and 3% in 2015, with Eastern Europe and Russia holding the highest values (4% and 7%, respectively).
Over the last years Europe has discussed important measures to achieve climate targets, including lowering the number of carbon allowances under the EU Emissions Trading Scheme (ETS) and reducing by 20% CO2 emissions by 2020. In 2010, Germany’s sustainable energy focused on more ambitious goals: reducing CO2 emissions by 40% below 1990 levels by 2020 and 80% below 1990 levels by 2050; increasing the relative share of renewable energy in gross
Iberian assets sold by € 2.5
E.ONSE COMPANY REPORT
Fig. 14 – E.ON carbon intensity,
2010-2013 (in metric tons of CO2 / MWh)
0.3 0.4 0.4 0.4 0.7 0.6 0.7 0.6 0.5 0.5 0.6 0.5 0.6 0.6 0.6 0.6
0.5 1.0 1.5 2.0 2.5
2010A 2011A 2012A 2013A Germany UK Other EU countries Russia
Source: Company data
Note: Carbon emissions refer to the
amount of CO2 generated by each MWh of power produced.
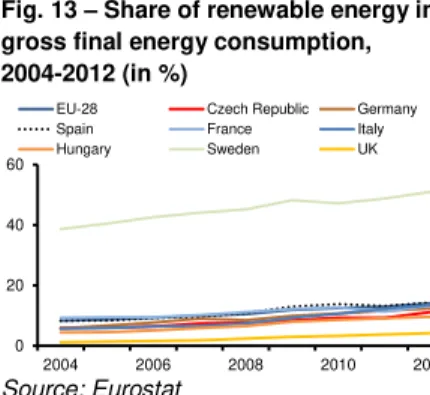
Fig. 13 – Share of renewable energy in
gross final energy consumption, 2004-2012 (in %)
0 20 40 60
2004 2006 2008 2010 2012 EU-28 Czech Republic Germany Spain France Italy Hungary Sweden UK
Source: Eurostat
energy consumption to 18% by 2020, 30% by 2030 and 60% by 2050; increasing the relative share of renewable energy in gross electrical consumption to 35% by 2020 and 80% by 2050, and increasing the national energy efficiency by cutting electrical consumption 50% below 2008 levels by 2050. Since 2012, a high volume of renewables, in particularly onshore and offshore wind and solar, has transformed the way electricity market operates. To make renewable development more cost effective, annual targets for the most expensive technologies, offshore wind and biomass, were set lower than the targets for the cheaper technologies, onshore wind and photovoltaics. In addition, the feed-in-tariffs12 for new onshore wind and solar installations were reduced with continuing reductions based on deployment rates. In 2014, a revised law entered into force according to the Renewable Energy Sources (EEG), which will affect future costs, expansion and market integration of renewables in Germany and, therefore, allow further investment in renewables, in spite of fossil fuels, which might enable reaching the 2020 environmental targets.
Supply and demand
Germany
The German electricity market is Europe's largest one, with an average annual power consumption of 550 TWh and a generation capacity of 125 GW. Four vertically integrated companies operate in the German electricity market, namely, E.ON, RWE, EnBW and Vattenfall, which also produce and supply power to other nearby countries besides Germany.
Since 1998 the German electricity market has become fully liberalized. In the same year, the Federal Network Agency (Bundesnetztagentur or BNetza) was created in order to free up the power market. The regulator defines what companies charge the clients through pre-defined tariffs. These charges, as well as the feed-in tariffs in renewables, are paid through a levy charged to electricity customers. Transmission networks are pure monopolies. Electricity is delivered to the end-consumer through the high and extra-high voltage grid system. Power is further distributed through lower level grids, with transformer stations used to transform electricity voltage levels. Major expansion of the high-voltage systems
is required to meet Germany’s ambitious 2020 energy goals. Transmission
system operators (TSO’s) keep control power available to maintain stable and reliable supply, while distribution system operators (DSO’s) are legally obliged to purchase all power produced by the renewables generators connected to their network. As for E.ON, part of sales results from the TSO’s compensation for the power sold from renewables. Overall, demand for control energy is created when
12
See Appendix IV for details on feed-in-tariffs.
E.ONSE COMPANY REPORT
Fig. 15 – German Total Primary
Consumption and Production, 1991-2012 (in quadrillion of BTU)
0 4 8 12 16
1991 1993 1995 1997 1999 2001 2003 2005 2007 2009 2011 Total primary energy consumption Total primary energy production
Source: U.S. Energy Information and Administration (EIA)
Table 3 – Operational data of
largest Utilities in Germany (9M14)
E.ON RWE Electricity sales (TWh) 548 192 o/w in Germany 97 95 Gas and Heat sales (TWh) 754 185 o/w in Germany 238 57 EBITDA (€ mn) 6,637 4,700
Gross margin 8% 13%
Adjusted NI (€ mn) 1,435 994
Profit Margin 1.8% 2.8%
Source: Companies’ data
Fig. 16 – Electricity consumption,
2010-2013 (GWh)
100,000 200,000 300,000 400,000 500,000
2010A 2011A 2012A 2013A England, Scotland and Wales Northern Europe Italy Iberia
Source: Company data
the sum of power generated varies from the actual load (due to weather fluctuations in the case of renewable energies).
In 2013, energy consumption in Germany remained low, albeit a small increase of 2.6% to 477.7 million metric tons of coal equivalent (MTCE). Gas consumption increased by 6.7% yoy to 107.5 MTCE. The market structure in Germany in terms of gas included 1,037 TWh of imports, while domestic production only amounted to 116 TWh and gas consumption remained at 956 TWh. Many of those imports are in fact contracts made prior to the actual year’s sales volume, as utilities are obliged to purchase the gas ordered, even if it may not be all consumed by clients. From 1991 to 2012, German total primary consumption remained above its production13, with a gap of approximately 9 quadrillion of British Thermal Units (BTU), where one BTU is equivalent to 45 million tons of coal. Hard coal was the resource mostly used to generate power and heat in the country; however, oil and natural gas constituted the energy sources frequently used as primary consumption in 2013 (33% and 23%, respectively). Coal is Germany's most abundant energy resource (represented 24% of Germany's total primary energy consumption in 2012). Coal consumption increased after Japan's Fukushima reactor accident, and has been used as an alternative for nuclear power in electricity generation. Nevertheless, focus is currently on lowering greenhouse gas (GHG) emissions with the EU currently reviewing further limits. In 9M14, E.ON sold circa 548 TWh of electricity (+2% yoy) and 754 TWh in gas (-14% yoy). RWE reported lower electricity and gas sales as a whole. In Germany, power sales recorded a similar level for both utilities. Nevertheless, E.ON surpassed RWE in terms of gas and heat sales in the country, despite the fact that E.ON’s gross and profit margins do not stand out from RWE’s.
Other countries
Although Germany represented 39% of total sales of the company in 2013, E.ON also collects part of its proceeds from other regions, including the UK (31%), Sweden (3%), other EU countries both in Southern and Eastern Europe (26%) and Russia (1%). When assessing power consumption behaviour, it has fallen mainly in Northern European countries and in Italy. In Iberia, despite ongoing market reforms, electricity consumption has remained at stable levels between 200 and 300 TWh per year.
Due to its low carbon amount, natural gas is the fossil fuel with the lowest GHG emissions. It is more suitable for covering mid and peak load than it is for base load coverage, because they are operationally flexible, meaning they can be
13
E.ONSE COMPANY REPORT
Fig. 19 – Net electricity generation,
EU-28 2012 (as % of total, based on GWh)
52.6%
26.7% 11.6%
6.5% 2.2%0.2%0.1%
Combustible fuels Nuclear
Hydro Wind
Solar Geothermal
Other
Source: Eurostat
Fig. 17 - Russia’s Natural Gas
consumption and production, 2000-2013 (in bn cubic feet)
5,000 10,000 15,000 20,000 25,000
2000 2002 2004 2006 2008 2010 2012 Natural Gas Production Natural Gas Consumption
Source: US Energy Information Administration
Fig. 18 - Russia’s Oil consumption
and production, 2000-2013 (in bn cubic feet)
2,000 4,000 6,000 8,000 10,000 12,000
2000 2002 2004 2006 2008 2010 2012 Oil Consumption Oil Production
Source: US Energy Information Administration
started up and closed down in a short time. Highly efficient modern gas power plants (gas and steam plants) operate in the mid-load area. Older gas power plants or gas turbine plants will be used to cover peak load periods. To tackle climate change effectively, CO2 emissions must be reduced. Due to the long-term increase in GDP and energy demand outlook, E.ON has been committed to develop a new process. The carbon capture and storage (CCS) would enable generating electricity from coal with nearly zero emissions. That would mean that the world's coal reserves could be used to provide a secure, affordable, and climate-friendly supply of electricity. Those processes are developed to supplement coal-fired power plants, but will also be used at gas and biomass plants. Hence, steam generating capacity is to lower annually from 90 TWh to a level circa 65 TWh by 2018; whereas CCGT generating capacity is to remain at current levels, slightly below 20 TWh.
As for gas consumption, it has increased in Northern Europe, whereas in Southern countries it remained at constant levels - 276 TWh in Spain, while having declines 7% in Italy. The reasons behind low levels include mainly temperature differences across regions and slow economic recovery. In Russia, power consumption declined 1% in 2013 to 1,010 TWh. As a net exporter of oil and natural gas, both consumption levels have been at steady levels.
According to the International Energy Agency (IEA), energy production will rise to approximately 33,000 TWh by 2030. In 2012, the EU-28 countries reported 53% of net electricity generation from fossil fuels, followed by 27% from nuclear power and 12% from hydro power. Currently, around 40% of the world's generated energy is produced from coal, leading to high levels of CO2 emissions and adding pressure on rising prices.
Power prices
The prices for electricity procurement are determined on the stock market, namely, in the European Energy Exchange (EEX). The EEX determines the electricity price according to the Merit Order Curve14, which states that the price which utilities offer electricity is based on the short-run marginal costs of their power plants; in other words, the price that the plants require to cover the operating expenses (OPEX). Renewable energies, namely, wind and solar have nearly zero OPEX, so they are the first in line; nuclear and lignite are the following resources with a low marginal cost, whereas hard coal and gas power plants correspond to the most expensive resources marginally depending on the CO2 emissions and fuel prices. According to this order, power is sold starting
14
See Appendix V for details on the Merit Order Curve.
… Hard coal and gas power
E.ONSE COMPANY REPORT
Fig. 20 – First year generic CIF ARA
steam coal forward price ($/ tonne)
207.5
67.25
0 50 100 150 200 250
2007 2008 2009 2010 2011 2012 2013 2014 Source: Bloomberg
Fig. 21 –Carbon EUAs (€/tonne)
28.35
6.29 0
5 10 15 20 25 30
2007 2008 2009 2010 2011 2012 2013 2014
Source: Bloomberg
Fig. 23 – Netherlands TTF Gas
(€/ MWh)
0 10 20 30 40 50
2007 2008 2009 2010 2011 2012 2013 2014 Source: Bloomberg
Fig. 22 – European Base Power Prices
(€/ MWh)
20 40 60 80 100
2007 2008 2009 2010 2011 2012 2013 2014 Germany 1YR Baseload Electricity Forward Price France 1YR Baseload Electricity Forward Price Spain 1YR Baseload Electricity Forward Price
Source: Bloomberg
with the most inexpensive resource, until no more energy from such resource is available, and then moving to the other resource in line until the power demand is completely met. At the end, the most costly power plant required to sell energy determines the spot price at which electricity is sold in the market. For instance, when peak loads occur, that is, energy demand requires electricity to be supplied at a level above average, such power plants are utilized and prices increase. Power prices have shown a tendency to worsen over the last months of 2014. Factors which have driven electricity and gas’ prices down include the market movements of oil, gas, coal and carbon allowance prices internationally; recent macroeconomic and political developments, such as the aftermath of the sovereign debt crisis and political conflicts between Europe, Russia and the USA. The electricity market price in Europe is determined based on the combination of both the steam coal price and carbon European Union Allowances (EUA’s). Then each country has to match its supply and demand curves, so the country’s wholesale electricity price is determined. Because coal trades in dollars per tonne
and carbon EUA’s trade in euros, there are foreign exchange rate effects which will affect the final price charged to the consumer. Consequently, commodities’ prices and foreign exchange rates are two of the main factors which determine the electricity and gas prices charged in the market.
When looking at past months, the Brent crude oil price has fallen deeply to a level not seen since 2009, at $60 per barrel. Although this is a widely indicator of weak world demand, it illustrates how the economies are still vulnerable and consumption levels have not recovered sufficiently to levels prior to 2008. In terms of power market, steam coal forward prices are at the lowest level from the past five years, slightly above $70 per metric tonne, as well as carbon EUA’s have registered levels ranging between €4 and €7 / tonne since January 2014. Such price movements add downward pressure on the base load price of power for 2015 in European countries. Germany first year base load electricity forward price15 is at approximately €35 /MWh, the lowest since 2007, while France reported in November 2014 a forward price of €43 / MWh and Spain holds the highest value among the three countries (€47 /MWh).
On what concerns the price of gas in Europe, it remains at a more stable level
(slightly below €25 /MWh) and proves to be less volatile than other commodities since 2010, with exception of the period of the financial crises (2008-2009). Not only has shortage of demand contributed to the downward trend of electricity prices, but also the plentiful supply of power owing to additional installed capacity
15
E.ONSE COMPANY REPORT
Fig. 24 – German Clean Dark and Spark
Spreads (€/ MWh)
-22.5 -15 -7.5 0 7.5 15
2009 2010 2011 2012 2013 2014 German Spark Year 1 Baseload German Dark Year 1 Baseload
Source: Bloomberg
of renewables, namely, from solar and wind power. Additionally, the gap between the German Clean Dark and Spark Spreads16 has widened since November 2011. The Clean Dark Spread is currently negative, meaning that the
difference between the price at which natural gas and carbon EUA’s are procured
and at which the power is sold has been negative, owing to increased use of renewables, as well as to coal’s cost advantage when compared to natural gas.
Capacity market
Demand response is used by utilities and grid operators to improve reliability, increase economic efficiency in regional energy markets, and to integrate renewable generation capacity into their systems. One form of demand response is the capacity market. Because electricity prices are often carefully limited and controlled, traditional price signals cannot be used effectively to curb demand for electricity. As the economic consequences of running out of electricity supply are considerable, capacity markets ensure that supply will be available when it is needed most, during peak times. These capacity markets provide an additional incentive for owners of generating capacity (i.e. power) to make their capacity available to electric markets, where price signals alone would not. Capacity providers are paid on a KW per year for the capacity a power plant can generate. Within the ETS, 2014 aimed at completing the internal energy market. According to E.ON, this is a step to accomplish a common market for energy which would save power and gas customers many billions of euros. However, structural issues on the existing setup of energy markets remain a drawback to an efficient energy market design in Europe. To accommodate the current challenges imposed by the EU directives and, particularly, the German government, energy supply ought to guarantee that the irregular output of wind and solar power is backed by gas and coal-fired power plants that are ready to come online when needed. We see important developments coming from new market design discussions in the upcoming years, which will have meaningful impact not only for E.ON, but also for other German utilities. As it will allow a payment for the installed capacity own by companies, and not based on generating capacity of electricity.
In Germany, the Greenbook aims at discussing electricity market design options, claiming for temporary capacity reserve to deal with uncertainties in the market. Such initial draft is essentially a fundamental approach to whether Germany is better-off with a capacity market or a pure energy market. Still, it does not draw
16
The Clean Spark spread represents the net revenue on power sales after gas costs and emissions allowance costs from gas-fired generation plants; whereas the Clean Dark spread stands for coal-fired generation plants.
E.ONSE COMPANY REPORT
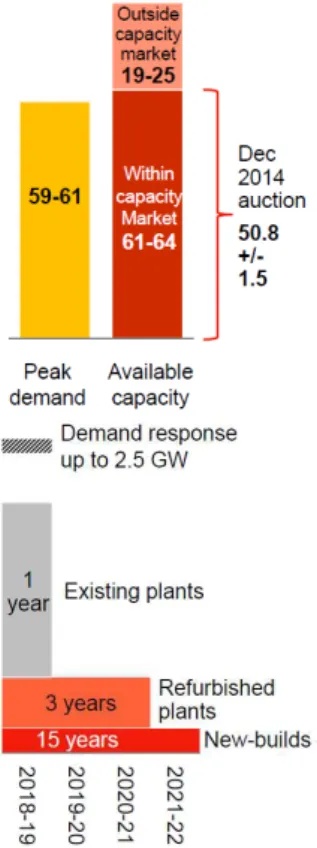
Fig. 25 – UK Capacity Market
2018-2019
Source: Company data
Fig. 27 – Conventional Generation
average load factors, 2012-2023F
89%
73%
55%
34%
Lignite Nuclear Hard coal Natural Gas, Oil
Source: Analyst’s estimates
Fig. 26 – Conventional Generation
breakdown, 2013 (in MW)
4,000 8,000 12,000 16,000 20,000
Germany France Sweden and the UK
Italy Spain Eastern EU
Nuclear Lignite Coal Gas Oil
Source: Company data
any conclusion that a capacity market is needed. Yet, nothing has been decided and more information will be given in 2015 under a Whitebook on the matter. By the end of July 2014, the European Commission approved the introduction of a capacity market for electricity generators planned by the UK. Such market will ensure that power producers are compensated for putting secured power plant
capacity at the market’s disposal in addition to receiving income from the sale of electricity. The goal is to ensure the economic attractiveness of building and operating plant necessary to ensure security of supply. The UK model envisages annual capacity auctions of predetermined volumes of secured capacity. The highest accepted bid, ensuring that the required volume is covered, determines the price of capacity for all providers. Participation in the auctions is voluntary and technology-neutral, only requiring participants determining the secured capacity of each facility. The auctions will take place four years in advance of each provision period. Short-term additional needs will be satisfied through a second auction with a lead-in time of one year.
Utilities in the UK have already prepared offers on December 16th auction, which determined the power plant capacity for the Fall 2018/2019 with a capacity payment set at £19/ MW for fossil fuel power plants. The price of capacity for new plant will be guaranteed for another 14 years in addition to the aforementioned period. In contrast, operators of old plants will have to participate in annual auctions (RWE, 1H14 Interim Report). By winning a capacity agreement, power plants continue to fully participate in energy and supplementary services markets. We see this having little impact in our valuation, given E.ON’s operations in the country mainly include distribution networks and renewables.
Business segments
Conventional Generation
Conventional Generation oversees the operations in Germany, Sweden, the UK, France, Italy, Spain and Eastern Europe. In 2013, hard coal represented 43% of
the segments’ installed capacity (38% of nuclear and 16% of natural gas). E.ON’s generating activity from hard coal and nuclear power in mostly represented in Germany. As from July 2011, Germany's amended Nuclear Energy Act required the shutdown of eight NPP’s. Nuclear fuel-rod taxes have already lowered in 2014, due to the closure of the Grafenheinfeld NPP ahead of schedule. Outside Germany, E.ON owns three NPP’s in Sweden: Oskarshamn 1, 2, and 3, where
E.ONSE COMPANY REPORT
Fig. 28 – Conventional Generation
generating capacity, 2012A-2017F (in GWh)
10,000 20,000 30,000 40,000 50,000 60,000 70,000 80,000
2012A 2013A 2014E 2015F 2016F 2017F CCGT Nuclear Steam
Source: Company data and analyst’s estimates
Fig. 29 – Generation’ Sales and EBITDA
margin, 2012A-2017F (in € mn)
0% 5% 10% 15% 20% 25% 30% 35%
2,000 4,000 6,000 8,000 10,000 12,000 14,000
2012A 2013A 2014E 2015F 2016F 2017F Nuclear Sales Fossil Sales EBITDA margin
Source: Company data and analyst’s estimates
Table 4 – Inputs projections
2012A 2013A 2014E 2015F
Coal price ($/ tonne) 103 88 73 73 Crude Oil ($/ barrel) 110 100 70 69
CO2 EUA (€/ tonne) 7 5 6 7
EURUSD 1.320 1.379 1.380 1.405 Source: Bloomberg and analyst’s estimates
Fig. 30 – Life-cycle in grams
(CO2 equivalent/kWh)
Source: Company data
We estimated E.ON’s generating capacity for the upcoming years based on
historical load factors, which will be assumed constant throughout our valuation timeframe, and total installed capacity17, while taking into account already completed divestments and the announced investment portfolio by the company. Owing to the gradual German nuclear phase-out, we estimate that nuclear power production will gradually decrease until 2022, reaching a minimum of approximately 12 TWh by 2023. Notwithstanding nuclear energy contributes significantly to a low-cost electricity supply in Europe. The competitiveness of nuclear energy is not affected by rising fuel costs. Instead, for a NPP to produce power uranium is essentially the main operating cost driver.
We estimate the largest impact on EBITDA coming from the variations on coal and CO2 prices, as well as to the foreign exchange difference between the euro and the dollar. We estimate Effective CO2 to increase 3% annually, ranging between €5 and €8 per tonne, based on Bloomberg consensus until 2017. Following the downward trend on the coal price, we estimate a continuing behaviour, reaching $68 per tonne on average. Based on our estimates, we used the power price variation and applied to Generation’s earnings forecast. Although our model assumes a total revenues decline, EBITDA will remain robust owing to E.ON 2.0 Program, leading to a higher EBITDA margin (29%, on average).
Renewables
The Renewables unit underpins E.ON’s strategy. Main resources comprise hydro, wind and solar energy. A part from nuclear power, renewable resources are the cleanest resources with hydro releasing between 4 to 36 grams of CO2 per kWh, wind with 10 to 38 grams of CO2 per kWh and solar energy with 27 to 217 grams of CO2 per kWh.
E.ON operates 212 hydro power plants in Sweden, Germany, Italy and Spain. All together represent 6,100 MW with an average generating capacity of 18.5 TWh per year. E.ON’s hydro plants allow for continuous base load capability and, therefore, constantly feed power into the grids. In Germany, E.ON owns eight run-of-river hydro power plants (927 MW); four storage plants (261 MW) and another four pump storage hydro plants (884 MW).
E.ON’s wind portfolio consists of 36 wind onshore farms and is currently the world’s third-largest offshore wind company. In Europe existing projects are primarily located in Spain, Italy, the UK, Germany and Sweden. The London Array is the largest offshore wind farm (630 MW) owned by E.ON, DONG Energy and Masdar. E.ON owns onshore wind farms with 4,000 MW, on average, of
17
E.ONSE COMPANY REPORT
Fig. 33 – Oil and gas production at EP
business unit (in mboe)
Source: Company data
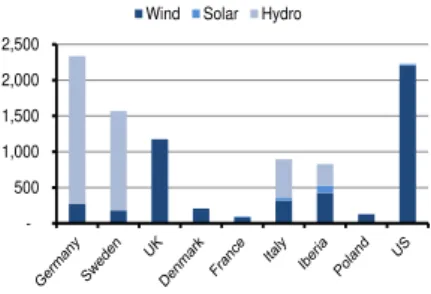
Fig. 31 – Renewables breakdown,
2013 (in MW)
500 1,000 1,500 2,000 2,500
Wind Solar Hydro
Source: Company data
Fig. 32 –Renewables’ Sales an
EBITDA, 2012A-2017F (in € mn)
500 1,000 1,500 2,000 2,500 3,000
2012A 2013A 2014E 2015F 2016F 2017F Hydro Sales Wind Sales
Source: Company data and analyst’s estimates
Note: Wind sales include solar and other
renewable energy sources.
installed capacity in Europe; while in the US, there is one of the world’s largest onshore wind farms (782MW).
Finally, solar power is produced at a lower scale than hydro and wind. In the photovoltaic method (PV), solar cells transform the sun's rays directly into electricity, which is how E.ON often operates in the market with 60 MW capacity in Southern Europe (with Iberian assets being disposed) and 20 MW in the US. Concentrated solar power (CSP) refers to the sun's rays being used to produce heat that generates steam to drive a turbine and generator.
In 2013, renewables’ sales volume lowered 6% yoy to €2,436 mn, mainly due to low hydro revenues. For 2014, we estimate sales volume at a similar level, despite the marginal decrease in the feed-in-tariffs, but a higher sales volume in generating capacity, owing to the investment pipeline presented by E.ON until 201718. Additionally, we reach a higher EBITDA margin due to lower operating costs with renewables, based on historical yearly decline on growth rates of operating costs. If the company continues to pursue a buy-and-sell strategy and, hence, increase power production, we consider such strategy will continue to
have a positive impact on company’s earnings. Our forecasts of generating
capacity follow a similar reasoning as in Generation; however, in terms of average retail price, this is regulated according to the feed-in-tariff criteria as seen in Annex III. Overall, we observe a 15 percentage point increase in EBITDA margin in 2017, relatively to 2014, stabilizing around 70% by 2023.
Exploration and Production
E.ON’s EP segment runs operations in Norway, the UK, Algeria and Russia. It comprises activities related to the exploration, development and production of oil and gas, namely, acquiring exploration licences, acting as operator in the development of assets and purchasing stakes in strategically important oil and gas fields. EP revolves around three stages: exploration, development and production. Yuzhno Russkoye in Siberia, Russia, has been E.ON’s largest production unit since 2009 (it represented 69% of total production in 2013). Global commodities unit is in charge of the trading activities and of managing and developing pipelines, long-term supply contracts and storage facilities; managing commodity price risks and identify trading opportunities. This unit trades complex financial products related power and gas (i.e.: spots, forwards and options); emissions (i.e.: EUA’s forwards and swaps); oil derivatives; coal and freight swaps; weather derivatives, as well as for storage and transport. Always depend on macroeconomic environment, this business unit’s profits have
18
E.ONSE COMPANY REPORT
Fig. 36 – Grid EBITDA and EBIT
9M14 (€ bn)
0 0.5 1 1.5 2 2.5
Germany Sweden Others Cezch R. UK Hungary € EBIT EBITDA
Source: Company data
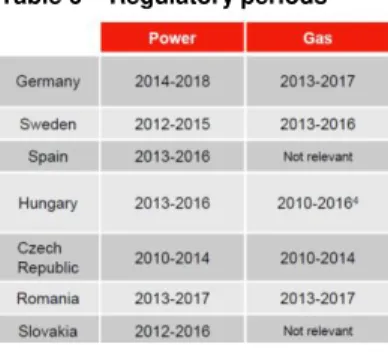
Table 6 – Regulatory periods
Source: Company data
Fig. 35 – EBITDA decomposition,
2012A-2017F (in € mn)
500 1,000 1,500 2,000 2,500
2012A 2013A 2014E 2015F 2016F 2017F Exploration and Production Commodities
Source: Company data and analyst’s estimates
Table 5 –E.ON’s networks
Source: Company data
Fig. 34 – Commodities’ sales, 2013
(Power and gas sales based on TWh; carbon allowances, oil and coal on mn metric tons)
40%
60%
Power Sales Gas Sales
64%
7% 29%
Carbon allowances Oil Coal
Source: Company data
proven to be highly volatile last years. Due to the recent deterioration in global fuel prices, optimization trading has showed volatile and vulnerable earnings. The uncertainty of the energy market recovery in the short-term is likely to worsen the
segment’s profitability.
In 9M14 EP’s sales revenues increased and we expect this trend to be confirmed in 2014 EBITDA, owing to higher production levels. However, and taking into consideration current shortage of electricity consumption, weaker commodities’ prices, the likelihood of further asset disposals in the North Sea and the depressive scenario in Russia, we estimate this trend to be short-lived, meaning that, from 2015 onwards, EP’s performance will not improve substantially. Owing to its difficult production predictability, earnings estimates are based on historical growth rates of production and sales proceeds. As for 2015, E.ON already expects lower levels of EP production, due to the review of a possible disposal in the North Sea and macroeconomic conditions, which will also affect the market performance of trading products in Global Commodities.
Grid
The energy world is changing with generation plants that utilize non-dispatchable energy sources gaining in importance. Also, power generation is becoming increasingly decentralized within Europe, so the harmonization of supply and demand becomes more complex, posing new challenges to the grid. E.ON manages its distribution business through eleven regions in Europe: Germany, the UK, Sweden, Italy, Spain, France, the Netherlands, Hungary, Czech Republic, Slovakia and Romania. Germany represents 49% of total grid EBITDA
and 46% of total unit’s EBIT (9M14). Within other EU countries, Sweden absorbs
the largest share of EBITDA (34%), whereas other EU countries hold the largest share of EBIT (32%), including Spain, Italy, France and the Netherlands.
Germany
In 2013, E.ON supplied power to 25 million customers in Europe, from which 6.1 million were from Germany (24.4% of total customers). As for the German grid, E.ON supplied 160.4 bn kWh of power (27.2% of total power supplied) with approximately 19% for the German power market; and 474.1 bn kWh of gas (41.2% of total gas supplied) with a corresponding market share of 14%. E.ON owns 26 GW for the Renewable Energy System (RES) in Germany (37% market share), matching almost three times the amount of peak load.