Original Article Trude et al.
Rev Bras Ativ Fís Saúde 2016;21(2):162-171
DOI: 10.12820/rbafs.v.21n2p162-171 RBAFSSOCIEDADE BRASILEIRA DE ATIVIDADE FÍSICA E SAÚDE
Brazilian Journal of Physical Activity and Health
RBAFS
Revista Brasileira de Atividade Física & Saúde
SOCIEDADE BRASILEIRA DE ATIVIDADE FÍSICA E SAÚDE Brazilian Journal of Physical Activity and Health
RBAFS
Revista Brasileira de Atividade Física & Saúde
SOCIEDADE BRASILEIRA DE ATIVIDADE FÍSICA E SAÚDE
Brazilian Journal of Physical Activity and Health
Brazilian Journal of Physical Activity and Health
Sociedade BraSileira de atividade FíSica & Saúde
1 Johns Hopkins Bloomberg School of Public Health, international Health department, center for Human Nutrition. Baltimore, Md, USa.
2 Federal University of Sao Paulo, Health Science department. Santos, SP, Brazil.
Abstract
We aimed to assess the association between individual, socio-economic, and environmental variables and sedentary behav-ior and physical inactivity (PI) among urban Brazilian women of varying economic status in Santos. Through a cross-sec-tional design in a home-based study, we interviewed 538 women with children under 10 years. We assessed PI through two different indices: the International Physical Activity Questionnaire (IPAQ) and the physical activity time/week as recommended by the World Health Organization (WHO). Sedentary behavior was assessed by sitting-time (>360min/ week). Using adjusted logistic regression, walking and driving remained significantly correlated to IPAQ’s score (OR 0.24 95% CI 0.11; 0.50; OR 1.87 95% IC 1.25; 2.81) and to WHO’s guideline (OR 0.20 95% CI 0.08; 0.48; OR 1.77 95% CI 1.16; 2.70). Sedentary behavior was associated with having house-keeper in the household (OR 2.14 95% IC 1.31; 3.50) and per-ceiving as a barrier for physical activity not having money (OR 0.29 95% CI 0.12; 0.65). Physical inactivity and sedentary be-havior were associated with individual, psychosocial and envi-ronmental perceptions factors among women with children. Therefore, environmental and policy interventions with mul-tilevel approach may be considered in urban areas to promote health and to prevent obesity among maternal-infant group.
Keywords
Sedentary Lifestyle; Women’s Health; Socioeconomic Fac-tors; Environment; Public Health.
Resumo
Este estudo teve como objetivo investigar os fatores associados à inatividade atividade e comportamento sedentário em relação às variáveis individuais, socioeconômicas e ambientais de mulheres re-sidentes em uma zona urbana de diferentes níveis socioeconômicos. Estudo transversal, com coleta dados através de entrevistas domici-liares em 538 mulheres com filhos de até 10 anos. Inatividade física foi avaliada por três diferentes indicadores: classificações do Ques-tionário Internacional de Atividade Física (IPAQ), tempo por se-mana de atividade física recomendado pela Organização Mundial da Saúde (OMS) (mínimo150 minutos/semana) e o tempo gasto sentado em um dia de semana maior que 360 minutos/semana como indicador de comportamento sedentário. Modelos de regres-são logística foram ajustados a fim de encontrar os fatores associados a cada indicador. Caminhada como uma atividade de lazer e usar carro como meio de transporte permaneceram associados ao escore de inatividade física do IPAQ (OR 0,24 95% IC 0,11; 0,50; OR 1,87 95% IC 1,25; 2,81) e das recomendações da OMS (OR 0,20 95% IC 0,08; 0,48; OR 1,77 95% IC 1,16; 2,70). O comportamento sedentário foi associado à presença de empregada doméstica na resi-dência (OR 2.14 IC 95% 1.31; 3.50) e perceber como barreira para a atividade física não ter dinheiro (OR 0.29 IC 95% 0.12; 0.65). A inatividade física das mulheres investigadas esteve associada a fa-tores individuais, psicossociais e de percepção do ambiente. Assim, o delineamento de intervenções, programas e políticas públicas em áreas urbanas deve considerar a interação de todos os fatores numa abordagem compreensiva e sistêmica para a promoção da saúde e prevenção da obesidade no grupo materno infantil.
Palavras-chave
Estilo de vida sedentário; Saúde da mulher; Fatores socioeconômi-cos; Ambiente; Saúde Pública.
Factors associated with physical inactivity and
sedentary behavior among women living in the
urban area of Santos city, Brazil
Fatores Associados à Inatividade Física e Sedentarismo de Mulheres
Moradoras da Zona Urbana do Município de Santos, Brasil
Angela Cristina Bizzotto Trude1; Gabriela Milhassi Vedovato2; Yeeli Mui1; Maria Aparecida Oliveira2; Paula Andrea Martins2
Introduction
Several studies have shown the health benefits of physi-cal activity1,2. However, it is well known that the know-ledge of the benefits of physical activity is not sufficient
for behavior change3. Moreover, noteworthy part of the worldwide population still fails to meet recommended physical activity levels4,5. A more comprehensive asses-sment of the relationship between the individual and the environment is needed to address this complex behavior6. Some studies have found associations between phy-sical activity and socioeconomic factors, such as household income and level of edu-cation7; environmental perception factors, such as barriers and facilitators to activity and neighborhood safety8.9; and individual factors, such as age, intention to change behavior, smoking, and alcohol consumption 6,10.
Of note is that many of these studies have been conducted in developed coun-tries where more resources are available to carry out recreational activities involv-ing physical activity. In developinvolv-ing countries, however, research related to physical activity is still limited. In Brazil, some research has focused on assess physical ac-tivity. One study from Thomaz et al. (2010) described physical activity in adults living in Brasilia and identified an inverse correlation between physical activity and Body Mass Index (BMI) only in men and different types of physical activi-ty according to gender11. Zanchetta et al. (2010) evaluated physical inactivity in São Paulo, southeast region of Brazil, and identified social and gender differences in the prevalence of physical inactivity12.According to Florindo et al. (2011), the positive perception of a safety environment was associated with higher physical activity level in commuting among adults also in São Paulo13. Still, few national and international studies have evaluated the factors related to physical inactivity and sedentary lifestyles in specific group populations.
Furthermore, few studies have investigated the determinants of physical activi-ty behavior among women with children. The maternal-infant group is a high-risk group for weight gain and other chronic diseases, as previous study has shown that women with children have a more sedentary behavior than those with no children14. Thus, in order to promote a more active behavior in this population to prevent comorbidities, it is of great importance to identify the risk and protective factor for physical inactivity.
This study aimed to assess the individual variables, socioeconomic, and environ-mental factors associated with physical inactivity and sedentary behavior of wom-en with childrwom-en under 10 years old, living in an urban area of Santos, São Paulo, Brazil. Specifically, we assessed whether a physically inactive lifestyle or a sedentary behavior is associated with environmental perception, education level, household income, and women’s age. We aimed to test if the higher the socioeconomic status, the more time spent on leisurely activities, and less time spent on daily physical ac-tivities, such as at the transportation, household and occupation domains.
Methods
The current study was part of a research entitled AMBNUT – Assessment of the Nu-tritional Environment of Santos. A cross-sectional and partially ecological design was used to assess the environmental factors associated with nutritional status and phy-sical activity of mothers and their children less than 10 years of age living in Santos15. This sub-study focuses on the women population only of the eligible households.
The study was conducted in 2010 in the city of Santos, located on the coast of the state of São Paulo, Brazil. According to Census 2010 Brazilian Institute of Geography and Statistics (IBGE), Santos has 281 mil km², 419,400 residents, with an approximately population density of 1,490/km². Santos is classified as being one of the wealthier cities in the country, being at the 17th position16. In general, this city has a high socioeconomic level, although only 6.5% of the population of
the city has a monthly income greater than 10 times the minimum wage, what illustrates the huge socioeconomic inequality.
The data collection was performed from January to December 2010. Five hun-dred thirty-eight families were analyzed through a home-based interview, in a stratified and random sampling, designed to be proportional to the administrative areas of the urban territory. The recruitment took into consideration the number of residences per census tract among the different areas of the city (10% center, 20% northwest and 60% seafront). The tracts in the Port and Hillside regions were excluded due to local violence and the difficulty involved in reaching these regions, where there is also a very limited number of households. We drew 36 of the 566 census tracts in the area covered by the study (insular area of the county). Accord-ing to the samplAccord-ing design, 16 families were randomly chosen from each eligible census tract. The researchers started the enrollment in the north corner of the block and continued in a clockwise direction until they circled the whole block. In apartment buildings, we used the intercom to approach possible eligible families.
After the selection of census tracts, sectors were enrolled for the identification of eligible women. To be eligible for the AMBNUT study participants needed to: 1) be a female city residents older than 18 years living with their biological child up to 10 years of age; 2) be without health conditions that could affect their nutritional sta-tus, such as HIV and neoplasms; 3) not been pregnant during the past year; and 4) not having undergone a bariatric surgery procedure. The interviews were conduct-ed following signconduct-ed consent from the participants. In cases when it was not possi-ble to conduct the interview, interviewers continued to the next eligipossi-ble household. Three pairs of interviewers were selected and trained in the use of the instrument. A questionnaire was administered by trained interviewers, lasting 100 ± 22 minutes.
The present study protocol was approved by the Ethics and Research Commit-tee of Federal University of São Paulo (Protocol nº CEP 0275/09 and 0276/09).
We used the International Questionnaire of Physical Activity, short form (IPAQ 2005) to assess the level of physical activity among women. IPAQ, Version 6 investi-gates the four domains of physical activity: work, leisure-time, transportation, and household work-related activities. Based on the IPAQ score, women were classified into 3 physical activity categories: “low-active”, “moderately active” and “highly ac-tive”17. For instance, according to the IPAQ criteria, the individual is considered moderately active if walked at least 30 minutes for 5 days per week, or performed vigorous physical activity for at least 20 minutes in 3 days per week. For the pur-pose of analysis, physical activity level was transformed into a dichotomous varia-ble. “Moderately active” and “highly active” were grouped into the same category as “active” accepting the 0 value and “low-active” accepting 1 to separate active women at some level from those who did not meet this requirement (physically inactive).
In a second analysis, we used the moderate/vigorous-intensity physical activity guidelines, adopting the WHO recommendations of at least 150 minutes of
regu-lar moderate/vigorous-intensity per week18. To estimate the weekly time of
phys-ical activity, we summed the total weekly time of each physphys-ical activity domain (transportation, occupational, leisure, and household) assessed by IPAQ. Those individuals who achieved the WHO recommendations were classified as “active”, and those who did not meet this criterion were classified as physically inactive.
Finally, in a third analysis, we adopted the time spent sitting, as a variable to meas-ure the sedentary behavior (more than 360 minutes per day), taking into account that sedentary behavior is not a single construct. We recorded time spent watching TV, us-ing the computer, workus-ing, studyus-ing, readus-ing, and eatus-ing, probed as part of the IPAQ.
The products of the time sitting in each setting were then summed to derive a measure of the total daily time spent during the day. Proper et al. used as a cut-off point for this variable the third tertile value to classify individuals into sedentary and non-seden-tary19. Thus, we chose to adopt the same cut-off point to facilitate future comparisons and inferences, since there is no recommendations and cut-off established for this variable until nowadays20. Women who did not meet this criterion were categorized as “non-sedentary”, and those who achieved this mark were ranked as “sedentary”.
As independent variables for the regression models, data regarding to means of transportation and current physical activity practices during leisure-time were collected. We also included environmental perception variables as barriers and fa-cilitators to physical activity, safety perception when walking in the neighborhood, as well as the distance between the household and places that encourage physical activity practice. Descriptive results were reported in a previous publication21.
To evaluate the household socioeconomic level, we used the questionnaire adapted from National Demographic and Children and Women’s Health (PNDS)
conducted in 200622. The socioeconomic level was then classified according the
Brazilian Economic Classification Criterion (ABEP, 2008), which estimates the purchasing power and classifies families into five strata (A, B, C, D, or E), accord-ing to the education level of the head of household and possession of goods23.
We used the Geographical Information System (GIS) to explore the spatial re-lationship of physical activity (means of transportation) and socioeconomic sta-tus of the neighborhood through thematic maps. The software Terra View (v. 3.4) and ArqView (v. 9.3) were used to model the GIS data.
Statistical Analysis
Multiple logistic regression was performed to analyze the association between the independent variables – socioeconomic and individual factors, means of transpor-tation, leisure-time physical activity, barriers and facilitators to physical activity, and safety perception when walking in the neighborhood – and the outcome, low level of physical activity (dependent variable). Three different models were tested; outco-mes included the physical activity level according to IPAQ scores (low-active), time spent during the week on physical activity (<150 minutes/week), and sitting time (>360 minutes/week). Univariate analyses between each independent variable and the outcome were performed. Variables with p value less than 0.20 in a chi-square test were selected for the multiple logistic regression model. The inclusion of varia-bles in the model used the stepwise forward method. The variable was considered significant if p<0.05 in the final model according to Wald’s test. The odds ratio was then calculated for each variable and the likelihood ratio test was used to assess sig-nificance of the final model. The Hosmer-Lemeshow test was used to determine the fit of the final model. All models were adjusted for education level and women’s age.
All analyses were performed using the SPSS statistical software package ver-sion 16.0 (SPSS Inc., Chicago, IL, USA).
Results
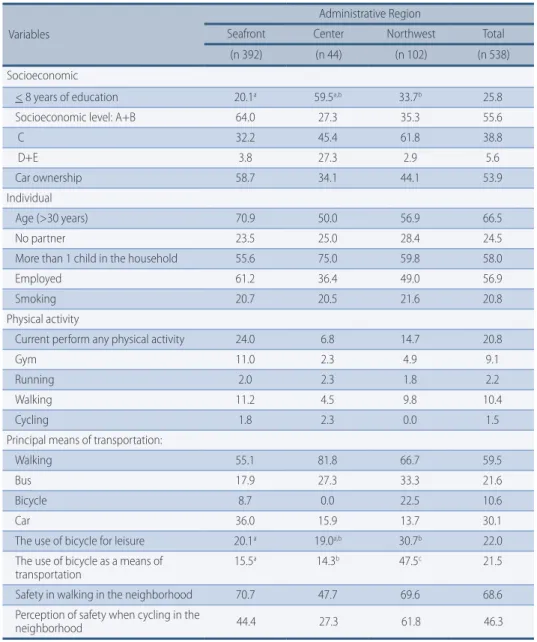
All the descriptive characteristics of the sample, stratified by the administrative areas, are shown in Table 1. Differences were found in education level and socioe-conomic level. The highest frequencies of socioesocioe-conomic levels A and B were fou-nd in the seafront area afou-nd levels C, D afou-nd E in center afou-nd northwest areas (data not shown). Of the 538 women surveyed, 43.7% were classified as low-active, 42.0% as moderately active, and 14.3% as active, according to the IPAQ score.
Table 1 – Socioeconomic characteristics and individual physical activity behavior of women living in urban Santos, SP1.
Variables
Administrative Region
Seafront Center Northwest Total (n 392) (n 44) (n 102) (n 538) Socioeconomic
< 8 years of education 20.1a 59.5a,b 33.7b 25.8
Socioeconomic level: A+B 64.0 27.3 35.3 55.6
C 32.2 45.4 61.8 38.8 D+E 3.8 27.3 2.9 5.6 Car ownership 58.7 34.1 44.1 53.9 Individual Age (>30 years) 70.9 50.0 56.9 66.5 No partner 23.5 25.0 28.4 24.5
More than 1 child in the household 55.6 75.0 59.8 58.0
Employed 61.2 36.4 49.0 56.9
Smoking 20.7 20.5 21.6 20.8
Physical activity
Current perform any physical activity 24.0 6.8 14.7 20.8
Gym 11.0 2.3 4.9 9.1
Running 2.0 2.3 1.8 2.2
Walking 11.2 4.5 9.8 10.4
Cycling 1.8 2.3 0.0 1.5
Principal means of transportation:
Walking 55.1 81.8 66.7 59.5
Bus 17.9 27.3 33.3 21.6
Bicycle 8.7 0.0 22.5 10.6
Car 36.0 15.9 13.7 30.1
The use of bicycle for leisure 20.1a 19.0a,b 30.7b 22.0
The use of bicycle as a means of
transportation 15.5
a 14.3b 47.5c 21.5
Safety in walking in the neighborhood 70.7 47.7 69.6 68.6 Perception of safety when cycling in the
neighborhood 44.4 27.3 61.8 46.3
a, b, c Statistically significant difference between group of region assessed by chi-square (p<0.05) 1 All results reported as frequency (%).
The factors associated with physical activity level of physically inactive women using the logistic regression analysis are represented in Table 2. We found a sig-nificantly positive association with physically inactivity classification (using IPAQ score) and car as a principal means of transportation, with almost twofold greater risk for this outcome (OR 1.87; 95% CI: 1.25; 2.81), holding women’s age, socio-economic level, women’s daily working hours, and women’s child age constant. We also found that women were 76% less likely to be low active when reporting walking for leisure-time (95% CI: 0.11; 0.50). The use of car for transportation was associated with increased odds for inactivity with almost twofold greater odds for this population (95% CI: 1.16; 2.70), as shown in Table 2 for those who do not achieve WHO recommendations for physical activity. Ninety percent of women who owned a car were also classified into the socioeconomic levels A and B. In-terestingly, feeling safe when bike riding across the neighborhood was associated with 1.50 times greater odds for being physically inactive. For this outcome, we
also found walking during leisure-time (73% lower odds) to be protective factors for physical inactivity.
Table 2 – Factors associated with physical inactivity among women living in urban areas of Santos, SP, Brazil. 1
Women’s physical inactivity factors Less active according to IPAQ
2 Less than 150 minutes/week (below
WHO recommendation) 2
OR (SE) 95% CI p-value OR (SE) 95% CI p-value Physical Activity
Walk 0.24 (0.09) 0.11; 0.50 0.00 0.20 (0.09) 0.08; 0.48 0.00 Transportation: car 1.87 (0.38) 1.25; 2.81 0.00 1.77 (0.38) 1.16; 2.70 0.00 Current performs any physical activity 0.51 (0.11) 0.32; 0.80 0.00 0.46 (0.11) 0.27; 0.76 0.00 Barrier: lack of time 1.25 (0.22) 0.88; 1.79 0.21 1.61 (0.30) 1.11; 2.34 0.01 Environment
Feeling safe when bicycling in the
neighborhood 1.30 (0.23) 0.92; 1.85 0.13 1.50 (0.28) 1.05; 2.16 0.03 Perception of close distance to a
place that enables physical activity:
public plaza 1.35 (0.14) 0.16; 0.79 0.01 1.06 (0.43) 0.48; 2.35 0.87
Abbreviations: OR: Odds ratio; CI: confidence interval; SE: standard error. 1 Logistic Regression Analysis. 2Adjusted model for women’s age, socioeconomic level, women’s daily working hours, women’s child age
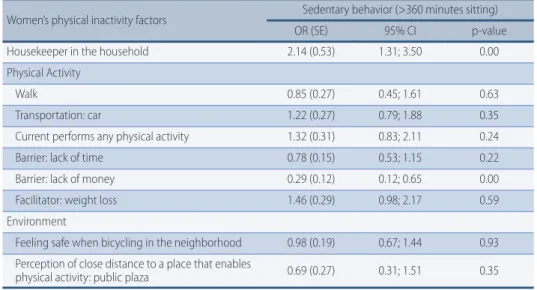
Having a housekeeper was significantly associated with greater than twofold risk for spending more than 360 minutes on a weekday sitting (95% CI: 1.31; 3.50) (Table 3). Most women who reported having a housekeeper were classified into a higher socioeconomic level (99%). Of those women, 66.3% worked away from home and all of them had more than 8 years of school education. Hence, 43% did not practice physical activity during their leisure-time, reporting lack of time as a perceived barrier (data not shown). Furthermore, we also found that the variable “lack of money” as a barrier to physical activity was associated with lower odds for being sedentary (95% CI: 0.12; 0.65).
Table 3 – Factors associated with sitting time during a weekday among women living in urban areas of Santos, SP, Brazil. 1
Women’s physical inactivity factors Sedentary behavior (>360 minutes sitting)
OR (SE) 95% CI p-value
Housekeeper in the household 2.14 (0.53) 1.31; 3.50 0.00 Physical Activity
Walk 0.85 (0.27) 0.45; 1.61 0.63
Transportation: car 1.22 (0.27) 0.79; 1.88 0.35
Current performs any physical activity 1.32 (0.31) 0.83; 2.11 0.24
Barrier: lack of time 0.78 (0.15) 0.53; 1.15 0.22
Barrier: lack of money 0.29 (0.12) 0.12; 0.65 0.00
Facilitator: weight loss 1.46 (0.29) 0.98; 2.17 0.59 Environment
Feeling safe when bicycling in the neighborhood 0.98 (0.19) 0.67; 1.44 0.93 Perception of close distance to a place that enables
physical activity: public plaza 0.69 (0.27) 0.31; 1.51 0.35
Abbreviations: OR: Odds ratio; CI: confidence interval; SE: standard error. 1 Logistic Regression Analysis. 2 Ad-justed model for women’s age, socioeconomic level, women’s daily working hours, women’s child age.
Means of transportation used by women stratified by household income was analyzed on Terraview. The graphical representation demonstrated that women in a higher socioeconomic status were those who lived in the seafront area and used car as a means of transportation. Moreover, the lower socioeconomic area showed the highest frequency of using a bicycle as a means of transportation.
Discussion
Our study presents some limitations. First, the use of the IPAQ questionnaire to evaluate the level of physical activity has some limitations regarding its validation and reproducibility, though our interviewers were well trained to reduce possible measurement bias. The inclusion of more physical activity-related questions im-proved the accuracy of the physical activity results, because it helped to identify other possible related variables, which could explain in a better way the physi-cal activity behavior. Second, this is a cross-sectional study, and so it is unable to determine cause and effect relationship from investigated variables and asso-ciations. For this purpose, future researches would require a longitudinal study design. Third, our findings cannot be extrapolated to the general populations, since several studies have found gender differences and various environmental context factors regarding physical activity behavior9. Finally, we could not find consistent associations between the built environment and physical activity, likely because the variables used in the regression models were related to the environ-mental perceptions of residents and not data from an objective evaluation of the environment. We suggest for future studies to perform objective measures of the environment. As an example, we propose the use of the GIS (Geographic Information System) to enable geographical representation and spatial analysis of areas aiming
to study the phenomena of urban spaces and the interplay of individual-environ-ment occurring in it.
Although several studies have focused on the association between individual and environmental factors and physical activity level, this was the first study to investigate the risk factors in the three different outcomes to measure physical inactivity level and sedentary behavior: IPAQ’s score, recommended time of phys-ical activity by WHO guideline, and the daily spent sitting time among women living in Santos. Despite each regression model carried out in this study having been associated with different factors related to physical inactivity, certain factors remained constant in all analyses. Those variables were: leisure-time walking and the use of car as a means of transportation (both variables regarding physical inac-tivity behavior), psychosocial variables (perception of barriers to physical acinac-tivity), and environmental perceptions (safety and living close to a public park).
Of the two physical activity assessment methods used - IPAQ score and the WHO guidelines – it was found slightly different prevalence of women active in the population: 43.7% and 34.9%, respectively. In Brazil, Suzuki et al. (2011) adopted the same IPAQ classification procedure as reported in this study – group-ing the categories active and moderate active, and isolatgroup-ing the physically inactive
individuals – and found 67.9% of physically inactive women.7 In this study, we
found a similar percentage of individuals who performed less than 150 minutes per week of physical activity to Hallal et al. (2005), who found a prevalence of 39% of physically inactive in two Brazilian cities4.
Women of this study who walked during their leisure-time were less likely to be classified as physically inactive by both criteria (energy expenditure estimating and physical activity per week). A study reported that 71% of people classified as
moderately active or active, often walk as a means of physical exercise22. In this study, 89.3% of women who were engaged in leisure-walk completed more than eight years of education. According to Janssen et al. (2010), people with higher ed-ucation and socioeconomic levels perceive fewer barriers to leisure-time physical activity, suggesting such actives are more enjoyable for these individuals24.
Women who used car as the main means of transportation were associated with being less active by the two assessment methods. A possible explanation for this trend is that women in a higher socioeconomic level and greater education may be more likely to have a sedentary job and spend less energy with transportation, because they often use car to commute. According to Lopez et al. (2006), working areas in urban settings are more commonly located away from residential areas, preventing people from going to work on foot or by bicycle25. The great time spent in the journey of work-home could have been better used for other social and lei-sure activities in their neighborhood20. Knowing this, it is important to encourage the use of bicycle and walking as active means of transportation, aiming to reduce the prevalence of physical inactivity and the health risks of a sedentary lifestyle.
Environmental perceptions such as living close to public parks and percep-tion of safety when bicycling in the neighborhood were correlated with physical inactivity. In a systematic review, it was shown that people who lived close to parks were more likely to use the open space in an active manner than those who did not live close to parks20. Furthermore, there may be an unequal distribution of recre-ational infrastructure among higher socioeconomic levels, which could explain the greater prevalence and participation in more vigorous physical activity among
higher income women27.
Moreover, working more than 8 hours a day was a confounding factor for the physical inactivity and sedentary behavior. The time individuals spent sit-ting during the week may be related to the type and time devoted to work tasks. Considering that these were individuals with high education level and probably had office-jobs, and so, performed more sedentary tasks unlikely those with low education level who possible were more active at work by performing activities that require more energy expenditure. Similar data was also found in Kahan et al. (2005) study, in which was observed a statistical association between lower scholar education and occupational activities: the lower the level of education, the higher physical activity level required in work domains27.
The socio-ecological model proposes that healthy behavior is influenced by the interaction of multiple factors, such as individual, social, and environmental factors5. Several studies have identified these factors to improve physical activity, such as recognizing barriers and perceived benefits in order to encourage physical activity8,10. However, some studies have found a negative association between per-ception of barriers and physical activity level10. In the present study, the significant psychosocial variables in multiple models was the perception of the lack of money as a perceived barrier to physical activity, associated with a lower odds for seden-tary behavior. This data may be reflecting more on individuals’ socioeconomic perception than on sedentary behavior. Among low socioeconomic level individ-uals, the financial condition is one of the most important perceived barriers to become engaged in physical activities or sports28.
Santos is well known as a “bicycle-friendly” city with 30 kilometers of bike lanes that promote the use of bicycles among its residents29. Regarding the infra-structure for the use of bicycles, bike lanes do not cover the whole city. We found the highest frequency of bicycles in the northwest area, an area that still has no
bike lanes. The use of bicycles as a means of transportation has been associated with the socioeconomic level of Santos’ population. In South America, a program worth mentioning is the project “ciclorutas”. It has encouraged the use of bicycles
through the implementation of bike lanes linked to public transportation, result-ing in decreased car usage, thus improvresult-ing life quality among dwellers30.
In summary, our findings suggest that physical inactivity among Brazilian wom-en with childrwom-en under 10 years living in urban areas is associated with individual, psychosocial, and perceived environmental factors. Despite the method of classify-ing people into physically inactive or sedentary, our study showed that some factors remained associated among the different classifications. In order to promote health and to prevent obesity and its associated diseases on maternal and child groups, we recommend new strategies to encourage physical activity which consider the so-cioeconomic disparities that have great influence on the level of physical activity. Meanwhile, complementary intervention strategies are necessary with a systemic approach, as well as actions to address behavioral, environmental, and policy level change for obesity prevention. For example, the implementation of new and more pleasant open spaces for pedestrians and cyclists in order to discourage sedentary behaviors, such as the use of vehicles as the main means of transportation.
Acknowledgement
The authors want to thank the São Paulo State Foundation for Research Support for supporting the work (FAPESP no. 2009/01361-1 e no. 2011/05641-9).
Author’s Contribution
PAM and MAP designed this research study; AT collected the data, conducted the data analysis with assistance from PAM, AT wrote the first draft of the paper, and had the pri-mary responsibility for the final content. GMV and YM provided their expertise relating to public health and physical activity, thus shaping the content of the introduction and dis-cussion. All authors edited drafts of the manuscript, read and approved the final version.
References
1. Healy GN, Wijndaele K, Dunstan DW, Shaw JE, Salmon J, Zimmet PZ. Objectively Measured Sedentary Time, Physical Activity, and Metabolic Risk. Diabetes Care. 2008; 31(2):369-371
2. Blair SN. Physical inactivity: the biggest public health problem of the 21st century. Br J Sports Med. 2009; 43:1-2.
3. Sallis JF, Cervero RB, Ascher W, Henderson KA, Kraft MK, Kerr J. An ecological approach to creating active living communities. Annu Rev Public Health. 2006; 27:297-322. 4. Hallal PC, Matsudo SM, Matsudo VKR, Araujo TL, Andrade DR, Bertoldi AD. Physical
activity in adults from two Brazilian areas : similarities and differences - Nível de atividade física em adultos de duas áreas do Brasil : semelhanças e diferenças. Cad. Saúde Pública. 2005; 21( 2 ): 573-580.
5. Dumith SC, Hallal PC, Reis RS, K.H. 3rd. Worldwide prevalence of physical inactivity and its association with human development index in 76 countries. Prev Med. 2011; 53:24-8. 6. Giles-Corti B, Donovan RJ. The relative influence of individual, social and physical
environment determinants of physical activity. Soc Sci Med. 2002; 54:1793-812.
7. Suzuki CS, Moraes SA, Freitas ICM. Physical activity and correlates among adults living in Ribeirão Preto , Southeastern Brazil. Rev. Saude Pública. 2001; 45(9).
8. Shibata A, Oka K, Harada K, Nakamura Y, Muraoka I. Psychological, social, and environmental factors to meeting physical activity recommendations among Japanese adults. Int J Behav Nutr Phys Act. 2009; 6(60).
9. Sjögren K, Hansson EE, Stjernberg L. Parenthood and factors that influence outdoor recreational physical activity from a gender perspective. BMC Public Health. 2011; 11(93)
EndErEço para CorrEspondênCia
Dr. Paula anDrea MarTins
Recebido 28/09/2015 Revisado 08/01/2016 apRovado 28/01/2016
Federal University of Sao Paulo, Department of Human Movement Science Nutritional Epidemiology Laboratory, 95 Ana Costa Avenue, Santos, SP CEP 11060001, Brazil.
10. Pan SY, Cameron C, DesMeules M, Morrison H, Craig CL, Jiang X. Individual, social, environmental, and physical environmental correlates with physical activity among Canadians: a cross-sectional study. BMC Public Health. 2009; 9(21).
11. Thomaz PMD, Costa THM, Silva EF, Hallal PC. Factors associated with physical activity in adults in Brasília. Rev. Saude Pública. 2010; 44(5):894-900
12. Zanchetta LM, Barros MBA, Cesar LG, Carandina L, Goldbaum M, Alvez MCGP Physical inactivity and associated factors in adults, São Paulo, Brazil. Rev Bras Epidemiol. 2010; 13:387-99
13. Florindo AA, Reis RS. Perception of the environment and practice of physical activity by adults in a low. Geography. 2011; 45(2):302-10.
14. Hartman MA, Hosper K, Stronks K. Targeting physical activity and nutrition interventions towards mothers with young children: a review on components that contribute to attendance and effectiveness. Public Health Nutr. 2011; 14:1364-1381. 15. Cremm E, Leite M, Abreu D, Oliveira MA, Scagliuse FB, Martins PA. Factors associated
with overweight in children living in the neighbourhoods of an urban area of Brazil. Public Health Nutr. 2012; 15(6):1056-64
16. BRASIL. Ministério do Planejamento, Orçamento e Gestão. Instituto Brasileiro de Geografia e Estatística. - IBGE. Censo Demográfico 2010 - Caracterísiticas da população e dos domicílios, Resultados do Universo. ISSN - 0104- 3145. Rio de Janeiro, RJ. 2010. Available at: http://biblioteca.ibge.gov.br/visualizacao/periodicos/93/cd_2010_ caracteristicas_populacao_domicilios.pdf
17. Instruments, IPAQ. Guidelines for Data Processing and Analysis of the International Physical Activity Questionnaire (IPAQ) – Short and Long Forms. 2005. 1-15
18. World Health Organization (WHO) Global Recommendations on Physical Activity for Health. Geneva, Switzerland, 2010.
19. Proper KI, Cerin E, Brown WJ, Owen N. Sitting time and socio-economic differences in overweight and obesity. Int J Obes. 2007; 31:169-76
20. Mark RS, Temmel CP. Adult sedentary behavior: a systematic review. Am J Prev Med. 2012; 42(3):e3-28.
21. Trude ACB, Cremm EC, Oliveira MA, Martins PA. Prática de atividade física de mulheres residentes da área urbana no município de Santos, São Paulo Nutrire: Rev. Soc. Bras. Alim. Nutr. 2013; 38(3):291-305,
22. Ministério da Saúde (Ministry of Health) (2006) Pesquisa Nacional de Demografia e Saúde da Criança e da Mulher (PNDS) (National Demographic and Health Survey). http:// bvsms.saude.gov.br/bvs/pnds/img/relatorio_final_pnds2006. pdf (accessed June 2010). 23. Associação Brasileira de Empresas de Pesquisa (Brazilian Association of Survey
Companies) (2010) Critério de Classificação Econômica Brasil (CCEB). http://www.abep. org (accessed November 2010).
24. Janssen E, Sugiyama T, Winkler E, Vries H, Poel F, Owen N. Psychosocial correlates of leisure-time walking among Australian adults of lower and higher socio-economic status. Health Educ Res. 2010; 25:316-24
25. Lopez RP, Hynes HP. A Global Obesity, Physical Activity, and the Urban Environment : Public Health Research Needs. Environmental Health BMC. 2006; 5:25
26. Kahan E, Fogelman Y, Bloch B. Correlations of work, leisure, and sports physical activities and health status with socioeconomic factors: a national study in Israel. Postgrad Med J. 2005; 81:262-5
27. Steenhuis IH, Nooy SB, Moes MJ, S.A. Financial barriers and pricing strategies related to participation in sports activities: the perceptions of people of low income. J Phys Act Health. 2009; 6:716-21.
28. Prefeitura de Santos Ciclovias - Prefeitura de Santos. 1 (2014). Available at <http://www. santos.sp.gov.br/ciclovia.php>
29. Parra D, Gómez LF, Pratt M, Samiento OL, Triche E, Mosquera J. Policy and environmental changes in Bogota and their relevance in promoting physical activity. Indoor Built Environ. 2007; 16:344–348.