ANALYSIS OF EFFICIENCY OF FIRE DANGER INDICES IN FOREST FIRE
PREDICTION
1Fillipe Tamiozzo Pereira Torres2*, Gumercindo Souza Lima2, Sebastião Venâncio Martins2 and Sebastião
Renato Valverde2
1 Received on 23.09.2015 accepted for publication on 14.12.2016.
2 Universidade Federal de Viçosa, Departamento de Engenharia Florestal Viçosa, MG, Brasil. E-mail: <torresftp2@gmail.com>,
<gslima@ufv.br>, <venancio@ufv.br> and <valverde@ufv.br>. *Corresponding author.
ABSTRACT – Despite the existence of different fire danger indices, the use of an inefficient index can lead to making wrong decisions on the appropriate procedures for preventing and fighting forest fires, while a trusted prediction index can help the most quantification and allocation of resources for prevention. Thereat, the objective of this study is to analyze the efficiency of Fire Weather Index (FWI), Logarithmic of Telicyn Index, Nesterov Index, cumulative indexes of precipitation - evaporation (P-EVAP) and evaporation / precipitation (EVAP/P), Monte Alegre Index (FMA) and Monte Alegre Changed Index (FMA+) in the prediction of forest
fires for the city of Viçosa (MG). The indices were compared using the method known as Skill Score (SS) taking into account the days that the indexes pointed to the risk of events with focus fire identified by satellite images on the 01/01/2005 to 31/12/2014 period. According to the results, the Logarithm of Telicyn Index (0.53257) as the most efficient for the study area, followed by the indices EVAP/P (0.46553), P-EVAP (0.43724), Nesterov (0.40445), FWI (0.39213), FMA+ (0.34595) and FMA (0.28982).
Keywords: Calculation; Danger; Fire.
ANÁLISE DA EFICIÊNCIA DE ÍNDICES DE PERIGO NA PREDIÇÃO DE
INCÊNDIOS FLORESTAIS
RESUMO – Apesar da existência de diversos índices de perigo de incêndios, a utilização de um índice pouco eficiente pode levar à tomada de decisões equivocadas em relação aos procedimentos de prevenção e combate aos incêndios florestais, ao mesmo tempo que um índice de predição confiável pode ajudar na maior quantificação e distribuição dos recursos para a prevenção. Diante disto, o objetivo deste estudo é analisar a eficiência dos índices Fire Weather Index (FWI), Índice Logarítmico de Telicyn, Índice de Nesterov, índices acumulativos de precipitação menos evaporação (P-EVAP) e evaporação por precipitação (EVAP/P), Fórmula de Monte Alegre (FMA) e Fórmula de Monte Alegre Alterada (FMA+) na predição de incêndios florestais para o município de Viçosa (MG). Os índices foram comparados através do método conhecido como Skill Score (SS) levando em consideração os dias que os índices apontavam como de risco à ocorrências e os focos identificados por imagens de satélites no período de 01/01/2005 à 31/12/2014. De acordo com o Skill Score, o Índice Logaritmo de Telicyn (0,53257) foi o mais eficiente para a área de estudo, seguido pelos índices EVAP/P (0,46553), P-EVAP (0,43724), Nesterov (0,40445), FWI (0,39213), FMA+(0,34595) e FMA (0,28982).
1. INTRODUCTION
Regions recognized as possessing the potential for forest fires need to be monitored. Significant meteorological variables like fire risk must be studied to facilitate the provision of subsidies for prevention and control, as well as infrastructure and team dimension, including monitoring and checking the number of occurrences (Deppe et al., 2004).
Risk indexes, based on meteorological data enable the quantitative estimation of the occurrence of forest fires; therefore, over time they have become reliable tools for the assessment of the potential risk of regional fires (Holsten et al., 2013).
To estimate a fire risk, these indexes normally involve a set of variables (wind, precipitation, temperature and relative air humidity) that include the major factors that play a part in forest fire initiation and propagation (Huesca et al., 2009).
Fire prevention subsidies, studied by Nunes et al. (2015), revealed that the number of occurrences is directly connected to the investment in prevention. When a poorly efficient index of danger is employed, even the present authors can be misled to draw incorrect conclusions regarding forest fire prevention and control procedures. A good prediction index, therefore, will facilitate greater quantification and distribution of the prevention resources.
As Padilla and Vega-Garcia (2011), showed considerable variations in the efficiency of fire indices in the regional spatial scales, it emphasized the necessity for an analysis of the efficiency of several indices for the same region. Viegas et al. (2004), advocated that the safest method of comparing different forest fire hazard indices was to submit them to the same meteorological and fire data.
However, it must be noted, according to Mélo et al. (2011), most of the occurrences of fires in Brazil were anthropogenic in origin. But even if there is maximum risk, it does not necessarily mean that a fire is present. On the other hand, on days classified as null fire due to anthropic influence, fire occurrence may be observed. Corroborating with the findings of Torres et al. (2014), it is not sufficient if the factors directly linked with the occurrence of forest fires are favorable for the initial ignition and the propagation of the fire; for
a fire to occur, the initial spark is essential to initiate the combustion reaction.
In light of the facts mentioned above, this study aims at analyzing the efficiency of a few of the most recurrent indexes available in the literature, viz., the Fire Weather Index (FWI), Telicyn Logarithmic Index, Nesterov Index, cumulative rates of precipitation minus evaporation (P-EVAP) Precipitation (EVAP / P), Monte Alegre Formula (FMA) and Monte Alegre Altered Formula (FMA +) to predict forest fires, employing the data for the municipality of Viçosa, MG.
2. MATERIAL AND METHODS
This study was conducted in the municipality of Viçosa, Minas Gerais (20 ° 45 ‘S and 42 ° 51’ W). Based on the Köppen classification the climate of the region is Cwb (mesothermic, with sparse rainfall distribution throughout the year, rainy summers and dry winters). The annual rainfall is about 1,300 mm on average, while the temperature varies from 26ºC maximum to 14ºC minimum on average (Oliveira Junior and Dias, 2005). Analysis was done of the data collected from 2005 to 2014. This data regarding the atmospheric elements were gathered by the Climatological Station, situated on the Federal University of Viçosa campus. These data bear significance for the whole micro-region of Viçosa (including, Araponga, Cajuri, Canaã, Coimbra, Ervália, Paula Cândido, Pedra do Anta, Porto Firme, São Miguel do Anta, Teixeiras and Viçosa), extending across an area of roughly 236,135 ha.
and Monte Alegre Altered Formula (FMA +) (Nunes et al., 2010); and the Canadian Fire Weather Index (FWI) (van Wagner, 1987).
Telicyn Logarithmic Index
Basic equation:
Being:
“I” = Telicyn index; “t” = Air temperature in oC;
“r” = Temperature of the dew point in °C; “log” = Base 10 logarithm.
On the days when the precipitation exceeds 2.5mm, the sum is ignored and the calculation is resumed the following day, or when the rain stops. On rainy days (s) the index is zero (Table 1).
E VA P / P
The EVAP/P is a cumulative index, which indicates the division of daily evaporation by precipitation, expressed in mm. To calculate this, the restrictions of Table 1 were employed.
P - E VA P
The P-EVAP cumulative index gives the difference between the daily precipitation (P) and evaporation (EVAP), calculated in mm; the precipitation offers some restrictions (Table 1).
Nesterov Index
Basic equation:
Being:
“G” = Nesterov Index; “d” = Air saturation deficit in millibars; “t” = Air temperature in oC
Air saturation deficit is the difference between the maximum water vapor pressure and the actual water vapor pressure, calculated utilizing the following expression:
d = E(1-H/100)
Being:
“d” = Air saturation deficit in millibars; “E” = Maximum water vapor pressure in millibar; “H” = Relative humidity of the air in %
The Nesterov index shows the continuity of the sum being limited by precipitation, as seen in Table 1.
Monte Alegre Formula
Basic equation:
Being:
“FMA” = Monte Alegre Formula; “H” = Relative humidity (%); “n” = Number of days without rain
The index reveals precipitation restrictions, as evident in Table 1.
Monte Alegre Formula Altered
Basic equation:
Being:
“FMA+” = Monte Alegre Formula Altered; “H” =
relative humidity (%); “n” = Number of days without rain; “v” = Wind speed in m/s; “e”= Base of natural logarithms (2,718282)
As it is cumulative, this index is also influenced by precipitation constraints, as evident in Table 1.
Fire Weather Index
The FWI index of the Canadian Forest Fire Hazard Indexing System (CFFDRS) involves six units: at the first level the FFMC - Index of the moisture content of the fine fuels; DMC - Index of moisture content of the organic layer; EDC - Drought Index, indicating the soil water deficit. All calculations were done using the meteorological data (temperature (°C), relative air humidity (%), and wind speed at 10 m height (m/s)). At the intermediate level there are two indices linked with fire behavior or propagation: ISI - Initial propagation index that combines the moisture content
n
I =
log (ti–ri) i = 1n
G =
di . ti
i = 1
n
FMA =
(100/Hi) i=1n
FMA
+=
(100/Hi) e
0,04vindex of the fine fuels and the wind speed values to provide the intensity of the velocity of propagation of the fire on flat ground, as should be the case during the initial phase of a fire; and BUI - which integrates the two subindices DMC and DC to give an estimate of the proportion of vegetation available (medium and coarse particles) that will effectively assist in the propagation.
The final result of this system is the hazard index (FWI), a combination of both the groups. It comprises the exit data that most directly relates to the possibility of the occurrence of fires and their respective hazards (Viegas et al., 2004).
Employing the sequential set of tables, the 6WW components are calculated (van Wagner, 1987); the free software FWI CALCULATOR v.10.2.1 was used in this study.
The Skill Score (SS) method was used to compare the indices (Table 2) based on a contingency Table which contains the observed and predicted values for a particular event in a population. The SS is the basis for the difference between the prediction hits (G) and the expected number of hits (H) and the difference
between the number of days observed (N) and the number of days the hit is predicted (Torres and Ribeiro, 2008; Nunes et al., 2010).
The performance of each index was ascertained by defining the limit that separated the occurrences of fire from the non-occurrences. It was accepted that when the calculated value of the indices which indicated no danger of occurrence dropped below the lower limit of the average grade class (Table 3) of the respective indices, it was safe; but danger of occurrence was implied when the value of the indices exceeded that limit.
Comparisons were performed depending upon the percentage of days and occurrences per hazard class according to Table 3 and the efficiency of the indexes according to the Percentage of Success (PS) and Skill Score (SS). The best time to use the meteorological data was also determined (average data, from 13:00 to 15:00 hrs and daily extreme values). Besides, a Pearson Linear Correlation analysis was done between the average monthly results of each index and the average monthly values of the meteorological elements with the monthly number of occurrences of the foci.
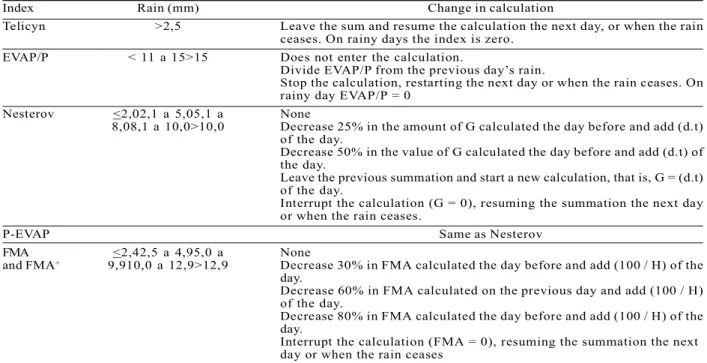
Index Rain (mm) Change in calculation
Telicyn >2,5 Leave the sum and resume the calculation the next day, or when the rain ceases. On rainy days the index is zero.
EVAP/P < 11 a 15>15 Does not enter the calculation.
Divide EVAP/P from the previous day’s rain.
Stop the calculation, restarting the next day or when the rain ceases. On rainy day EVAP/P = 0
Nesterov <2,02,1 a 5,05,1 a None
8,08,1 a 10,0>10,0 Decrease 25% in the amount of G calculated the day before and add (d.t) of the day.
Decrease 50% in the value of G calculated the day before and add (d.t) of the day.
Leave the previous summation and start a new calculation, that is, G = (d.t) of the day.
Interrupt the calculation (G = 0), resuming the summation the next day or when the rain ceases.
P-EVAP Same as Nesterov
FMA <2,42,5 a 4,95,0 a None
and FMA+ 9,910,0 a 12,9>12,9 Decrease 30% in FMA calculated the day before and add (100 / H) of the
day.
Decrease 60% in FMA calculated on the previous day and add (100 / H) of the day.
Decrease 80% in FMA calculated the day before and add (100 / H) of the day.
Interrupt the calculation (FMA = 0), resuming the summation the next day or when the rain ceases
Source: Torres and Ribeiro (2008)
3. RESULTS
The results revealed that the normal fire season for the study area or the time during which the most number of occurrences was reported, was between June and October (96% of observations). The monthly average values obtained using the FWI index was the one that showed the highest correlation with the number of monthly occurrences (r = 0.87) followed by the Nesterov (r = 0.76), FMA + (r = 0.73), P- EVAP (r = -0.71), FMA (r = 0.70), EVAP / P (r = 0.69) and finally Telicyn (r = 0.62).
Monthly insolation was the sole meteorological element showing strong correlation with the number of monthly occurrences (r = 0.64), precipitation (r = 0.54) revealed moderate correlation and relative humidity of the mean air (r = -0.26) and evaporation (r = 0.17) was poor.
With respect to the time of use of the meteorological data, the Logic Index of Telicyn, Nesterov, FMA and FMA + revealed better results when the daily average data was utilized; the FWI, however, gave a better response with the daily maximum temperature and relative humidity of 15: 00 hrs.
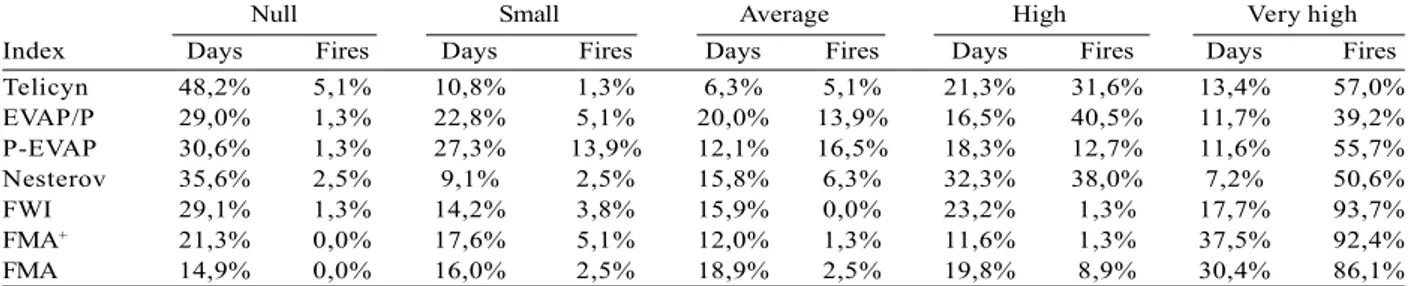
When the number of days in each hazard class (Table 4) was observed, the EVAP/P index alone revealed a decreasing order of percentage of days per risk class, i.e., the number of days was in the reverse order of the index hazard. FMA and FMA + had the lowest values of days and no occurrence of fire for null risk; however, they had higher values of percentage of days and number of occurrence, plus FWI, for very high risk.
When the efficiency (Table 5) was analyzed, the Percent Success was observed to follow the Skill Score results for each index, thus indicating that the Telicyn
Table 2 – Contingency table and calculation of the Skill Score. Tabela 2 – Tabela de contingência e cálculo do Skill Score.
Estimated Observed Total estimated
Fires No Fires
Fires a b N2 = a + b
No Fires c d N4 = c + d
Total Observed N1 = a + c N3 = b + d N = a + b + c + d Contingency table calculations
Estimated Observed Total estimated
Fires No Fires
Fires a / (a + c) b / (b + d)
No Fires c / (a + c) d / (b + d) The variables for performing the calculations are:
”G” - Number of hits in the forecast. G = a + d;
”P” - Probability of having at least one event per day. P = N1 / N; ”Q” - Probability of exceeding the index limit value. Q = N 2 / N; ”H” - Expected number of hits. H = N * (1-p) * (1-q) + N * p * q; ”SS” - Skill Score. SS = (G-H) / (N-H);
”PS” - Percentage of success. PS = G / N
Source: Nunes et al. (2006; 2007); Torres and Ribeiro (2008); Nunes et al. (2010); Borges et al. (2011); Rodríguez et al. (2012)
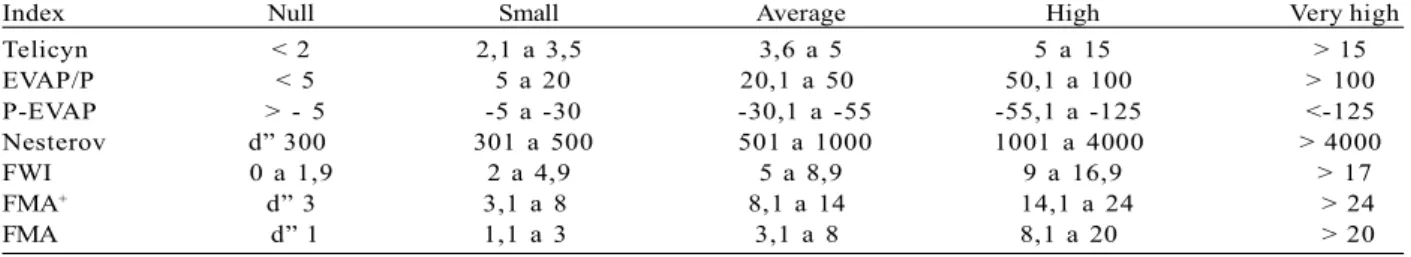
Table 3 – Fire hazard class according to the value obtained for each index.
Tabela 3 – Classe de perigo de incêndio de acordo com o valor obtido em cada índice.
Index Null Small Average High Very high
Telicyn < 2 2,1 a 3,5 3,6 a 5 5 a 15 > 15 EVAP/P < 5 5 a 20 20,1 a 50 50,1 a 100 > 100 P-EVAP > - 5 -5 a -30 -30,1 a -55 -55,1 a -125 <-125 Nesterov d” 300 301 a 500 501 a 1000 1001 a 4000 > 4000 FWI 0 a 1,9 2 a 4,9 5 a 8,9 9 a 16,9 > 17 FMA+ d” 3 3,1 a 8 8,1 a 14 14,1 a 24 > 24
FMA d” 1 1,1 a 3 3,1 a 8 8,1 a 20 > 20
Logarithm Index was the most efficient for the study area.
4. DISCUSSION
The results of this study do not concur with those of the other studies which employed the data evaluated at 13:00 in Paraná (Soares, 1972, 1998; Soares and Batista, 2006, 2007; Nunes et al., 2010) and at 15:00 in Juiz de Fora (MG) (Torres and Ribeiro, 2008) and is more efficient, as it reveals the variations in the climatic characteristics of each region. This is explained using the Pearson Linear Correlation between the daily values of humidity and the daily amount of occurrences in the region; despite being weak the relative humidity of the mean air (r = 0.1517), gave higher values than the relative humidity of the air of 15:00 (r = 0.1389) and 13:00 hrs (r = 0.12525).
In terms of the monthly averages, the insolation and the report of Torres et al. (2010a), revealed a higher correlation; however, the authors identified strong correlations also for relative humidity, evaporation and precipitation, for Juiz de Fora. More number of solar brightness hours implies less cloudiness, accompanied by lower air humidity.
Santana et al. (2011), recorded field observations revealing that the period of the greatest fire occurrence
Table 4 – Percentage of expected number of days and observed fires according to the classes of indexes.
Tabela 4 – Porcentagem de dias previstos e número de incêndios observados de acordo com as classes dos índices.
Null Small Average High Very high
Index Days Fires Days Fires Days Fires Days Fires Days Fires Telicyn 48,2% 5,1% 10,8% 1,3% 6,3% 5,1% 21,3% 31,6% 13,4% 57,0% EVAP/P 29,0% 1,3% 22,8% 5,1% 20,0% 13,9% 16,5% 40,5% 11,7% 39,2% P-EVAP 30,6% 1,3% 27,3% 13,9% 12,1% 16,5% 18,3% 12,7% 11,6% 55,7% Nesterov 35,6% 2,5% 9,1% 2,5% 15,8% 6,3% 32,3% 38,0% 7,2% 50,6% FWI 29,1% 1,3% 14,2% 3,8% 15,9% 0,0% 23,2% 1,3% 17,7% 93,7% FMA+ 21,3% 0,0% 17,6% 5,1% 12,0% 1,3% 11,6% 1,3% 37,5% 92,4%
FMA 14,9% 0,0% 16,0% 2,5% 18,9% 2,5% 19,8% 8,9% 30,4% 86,1%
Table 5 – Skill Score and Success Percentage of each index. Tabela 5 – Skill Score e Porcentagem de Sucesso de cada
índice.
Index SS PS
Telicyn 0,53257 76,63% EVAP/P 0,46553 73,28% P-EVAP 0,43724 71,86% Nesterov 0,40445 70,22%
FWI 0,39213 69,61%
FMA+ 0,34595 67,30%
FMA 0,28982 64,49%
does not commence immediately with the rainfall period, because the soil and the combustible material, the litter in particular, retain the moisture for some time. Similarly, the resumption of the rainfall period does not correspond to the prompt drop in the occurrence of fires, because when the soil contains a low content of combustible mass it will absorb the rainfall until the fuel material can no longer be ignited. Corroborating, Sampaio (1999), reports that the time of the greatest occurrence of fires commences two months post the onset of the rainy period and ends two months post the end of that period.
complex climatic variations throughout the extent of this country.
When the number of days per hazard class was considered, a very wide variation was observed between the results of each index for the municipality of Viçosa and other studies. In the northern state of Espírito Santo, the FMA index leaned towards a concentration of the percentage of the number of days in the higher hazard classes, showing 56.62% on average when compared with the high risk (31.90 %) and very high risk classes (24.72%) (Borges et al., 2011).
In this study the FMA + hazard index was observed to concentrate the percentage of the number of days in the highest hazard classes, probably as a result of wind speed. However, the authors report values lower than the FMA results, with an average of 42.25%, when taking into account the values of the high (19.18%) and very high risk (23.07%) classes. However, for the null and small risk classes the percentage of the number of days revealed mean values of 40.16%, indicating a possible balance between these classes. The Nesterov index revealed a greater tendency on comparison with the FMA and FMA + in order to concentrate a greater number of days in the high and very high risk classes, showing mean values of 39.43 and 23.48%, respectively, totaling 62.91%. This was likely due to the regional climatic characteristics. Besides, the small fire hazard class presented a mean value of 5.64% for the percentage of the number of days, which was the lowest percentage in all the analyses done.
According to Nunes et al. (2010), in the forest district of Monte Alegre (PR),the FMA showed higher percentages of days in the upper and middle classes and lower percentages in the low and null classes, whereas the FMA + revealed higher values for the null classes, decreasing to the lowest in the very high classes. In this study, the declining distribution observed for FMA + is advantageous for the behavior of the number of days predicted, according to the premises established for this variable, implying that the index is suited for this region.
Nunes et al. (2006), concluded that the results were satisfactory when the percentage of the number of days predicted per risk class was observed to have an inverse relationship with the risk class, which implied that the higher the risk class, the lower the number of days foreseen or predicted.
Corroborating with the study done in Cuba by Rodriguez et al. (2012), the distribution of the number of days predicted for each risk class was observed. On analyzing the Nesterov, FMA and FMA + indices, an undesirable condition was noted as the expected decreasing trend from null to very high was absent, a requirement necessary for the behavior of this variable; the authors improved the index performance by adjusting the descriptive classes.
Borges et al. (2011), on analyzing the number of days in which fire occurrences were reported in the north of Espírito Santo, identified for FMA a value of 37.29% in the high risk class and 43.96% in the very high risk class (totaling to 81.25%). They also ascertained a higher number of days with high and very high risk for FMA +, reporting 25.08 and 42.11%, on average, respectively (67.19% in total). For the Nesterov index (N), they noted an unbalanced trend, with the values being concentrated in the high and very high risk classes, showing 45.81 and 43.10%, respectively (totaling to 88.91%).
When the results of the FMA for the state of Paraná were compared with the occurrences of the heat sources detected by the image processing from the NOAA / AVHRR satellites, Deppe et al. (2004), confirmed that 52% of the foci detected fell under the extreme danger class and 46.4% under the high risk class. A small percentage of 1.5% of the outbreaks were found to take place in areas of moderate risk, while the number of outbreaks detected in the low and zero hazard classes was nil.
Nunes et al. (2010), stated that the increasing distribution of the number of days with the events recorded by the hazard class is desirable for the behavior of fire occurrence in the vegetation.
The forest district of Monte Alegre in Paraná, revealed values for FMA and FMA + as 0.0517 and 0.11165 for SS and 34.32% and 55.64% for PS, respectively (Nunes et al., 2010).
White (2010), for the state of Sergipe, reported values of 0.36 (SS) and 73% (PS) for FMA +; their study indicated that the Angstron index was the most efficient for that state (SS = 0.582 and PS = 82%).
In Bahia, White et al. (2015) (Table 1), as in the present study, indicated that the Telicyn index was the most efficient (SS = 0.1 and PS = 59%), followed by the Angstron (0.08 and 47%), FMA + (0.05 and 36%), Nesterov 0.03 and 23%) and FMA (0.01 and 20%).
Sampaio (1999), in his study on the state of São Paulo, highlighted the FWI index as the most efficient, with SS and PS values of 0.1838 and 71.38%, respectively, followed by the Telicyn Logarithmic Index (0.137 and 62.90% ), then the Nesterov (0.102 and 50.47%) and finally the FMA (0.061 and 36.92%).
In their work, Holsten et al. (2013), reported that for Germany, apart from the FWI, Angstron and Nesterov indexes, the Canadian index also was most effective for the country, while the Nesterov index had the lowest efficiency.
In the city of Juiz de Fora, as well as in the State of Minas Gerais, 122 km from Viçosa, Torres and Ribeiro (2008) recorded higher results for the EVAP / P index (0.534 and 78%, respectively), followed by Telicyn (0.511 and 76%), P-EVAP (0.473 and 75%), Nesterov (0.406 and 69%) and FMA (0.388 and 68%); barring the inversion between first and second places, the results were similar to those recorded for Viçosa.
Also, Sampaio (1991), for the state of Minas Gerais, Coronel Fabriciano municipality, 138 km away from Viçosa, identified the Telicyn, EVAP / P and P-EVAP indices as the most efficient, which reiterates the need to utilize them for this region.
This study reports results that are similar to those available in the literature; also, the results of this study concurred with those recorded in the literature (Sampaio, 1999; Nunes et al., 2007; Torres and Ribeiro, 2008; White, 2010 ; Nunes et al., 2010; Borges et al., 2011; Rodríguez et al., 2012; White et al., 2015). The Skill Score of the Telicyn Logarithmic Index identified for Viçosa is only lower than the Angstron index reported for the state of Sergipe (White , 2010) and the EVAP/P index observed for Juiz de Fora (Torres and Ribeiro, 2008).
Juiz de Fora and Viçosa revealed high values indicating good calibration of the indices for the region; however, because of the irregularity of the distribution of days and number of occurrences by the risk classes employed, it is suggested that in the future, studies should ensure a better distribution of these values, by realigning the risk classes and analyzing whether or not an efficiency gain is observed.
5. CONCLUSIONS
Based on the results, the following conclusions were reached:
- The monthly FWI index values revealed the highest correlation with the monthly totals of occurrences; - The average monthly sunshine was the meteorological element revealing the highest correlation with the monthly occurrences;
- The Logic Index of Telicyn, Nesterov, FMA and FMA + gave improved results when the daily mean data were utilized, while FWI had the best response with daily maximum temperature and relative humidity of 15:00 hrs;
- The indices showed a high degree of variation in the percentage of days and fire outbreaks according to the risk classes;
- The Telicyn Logarithmic Index had the highest efficiency for the municipality, followed by the EVAP/ P, P-EVAP, Nesterov, FMA + and FMA indices;
- The high Skill Score recorded, when compared with the other studies, revealed a good calibration of the indices for the region under study;
- The wide variety in the results based on the region, indicates the need for more site-specific studies, to establish the most efficient index for each scenario.
6. REFERENCES
Abreu FA, Souza JSA. Dinâmica espaço-temporal de focos de calor em duas terras indígenas do estado de Mato Grosso: uma abordagem
geoespacial sobre a dinâmica do uso do fogo por xavantes e bororos. Floresta e Ambiente.
2016;23:1-10.
de incêndios em plantios de eucalipto no norte do Espírito Santo. Floresta e Ambiente. 2011;18:153-9.
Deppe F, Paula EV, Meneghette CR, Vosgerau J. Comparação de índice de risco de incêndio florestal com focos de calor no estado do Paraná. Floresta. 2004;34:119-26.
Holsten A, Dominic AR, Costa L, Kropp JP. Evaluation of the performance of meteorological forest fire indices for German federal states. Forest Ecology and Management. 2013;287:123-31.
Huesca M, Litago J, Palacios-Orueta A, Montes F, Sebastián-López A, Escribano P. Assessment of forest fire seasonality using MODIS fire potential: A time series approach. Agricultural and Forest Meteorology. 2009;149:1946-55.
Instituto Nacional de Pesquisas Espaciais - INPE. Portal do Monitoramento de Queimadas e
Incêndios. Cachoeira Paulista: 2015. [acesso em: 18 de jun. 2015]. Disponível em http://
www.inpe.br/queimadas.
Mélo AS, Justino F, Lemos CF, Sediyama G, Ribeiro G. Suscetibilidade do ambiente a ocorrências de queimadas sob condições climáticas atuais e de futuro aquecimento global. Revista Brasileira de Meteorologia. 2011;26:401-18.
Nunes JRS, Soares RV, Batista AC. Especificação de um sistema computacional integrado de controle de incêndios florestais. Floresta. 2006;36:201-12.
Nunes JRS, Soares RV, Batista AC. Ajuste da Fórmula de Monte Alegre Alterada (FMA+) para o
estado do Paraná. Floresta. 2007;37:1-14.
Nunes JRS, Fier ISN, Soares RV, Batista AC. Desempenho da fórmula de Monte Alegre (FMA e da Fórmula de Monte Alegre Alterada (FMA+) no
distrito florestal de Monte Alegre. Floresta. 2010;40:319-56.
Nunes MTO, Sousa GM, Tomzhinski GW, Oliveira-Júnior JF, Fernandes MC. Variáveis condicionantes na susceptibilidade de incêndios florestais no Parque Nacional do Itatiaia.
Anuário do Instituto de Geociências – UFRJ. 2015;38:54-62.
Oliveira Junior JC, Dias HCT. Precipitação efetiva em fragmento secundário da Mata Atlântica. Revista Árvore. 2005;29:9-15.
Padilla M, Veja-García C. On the comparative importance of fire danger rating indices and their integration with spatial and temporal variables for predicting daily human-caused fire occurrences in Spain. International Journal of Wildland Fire. 2011;20:46-58.
Rodríguez MPR, Soares RV, Batista AC, Tetto AF, Sierra CAM, Rodríguez YC. Ajuste e desempenho dos índices de perigo de incêndios Nesterov, FMA e FMA+ na empresa florestal Macurije, Cuba.
Floresta. 2012;42:651-60.
Sampaio OB. Estudo comparativo de índices, para previsão de incêndios florestais, na região de Coronel Fabriciano, Minas Gerais [dissertação]. Viçosa, MG: Universidade Federal de Viçosa; 1991.
Sampaio OB. Análise da eficiência de quatro índices na previsão de incêndios florestais para a região de Agudos - SP. [tese] Curitiba:
Universidade Federal do Paraná; 1999.
Santana JAS, Araújo IMM, Sena CM, Pimenta AS, Fonseca FCE. Determinação dos períodos críticos de ocorrências de incêndios florestais na estação ecológica do Seridó, Serra Negra do Norte-RN. Revista Caatinga. 2011;24:43-7.
Silva JCS, Fiedler NC, Ribeiro GA, Silva Júnior, MC. Avaliação de brigadas de incêndios florestais em Unidades de Conservação. Revista Árvore. 2003; 27:95-101.
Soares RV. Índices de perigo de incêndio. Floresta. 1972;3:19-40.
Soares RV. Incêndios florestais: controle e uso do fogo. Curitiba: Fupef; 1985.
Soares RV. Desempenho da “Fórmula de Monte Alegre” índice brasileiro de perigo de incêndios florestais. Cerne. 1998;4:87-99.
Soares RV, Santos JF. Perfil dos incêndios florestais no Brasil de 1994 a 1997. Floresta. 2002;32:219-32.
Amazônia Matogrossense. Scientia Plena. 2012; 8:1-14.
Tetto AF, Batista AC, Soares RV. Ocorrências de incêndios florestais no estado do Paraná, no período de 2005 a 2010. Floresta. 2012;42:391-8.
Torres FTP, Ribeiro GA. Índices de risco de incêndios florestais em Juiz de Fora/MG. Floresta e Ambiente. 2008;15:24-34.
Torres FTP, Ribeiro GA, Martins SV, Lima GS. Determinação do período mais propício às ocorrências de incêndios em vegetação na área urbana de Juiz de Fora, MG. Revista Árvore. 2010a;34:297-303.
Torres FTP, Ribeiro GA, Martins SV, Lima GS. Perfil dos incêndios em vegetação nos
municípios de Juiz de Fora e Ubá, MG, de 2001 a 2007. Floresta e Ambiente. 2010b;17:83-9.
Torres FTP, Ribeiro GA, Martins SV, Lima GS. Mapeamento da suscetibilidade a ocorrências de incêndios em vegetação na área urbana de Ubá-MG. Revista Árvore. 2014;38:811-7.
van Wagner CE. Development and structure of the canadian forest fire weather index system. Ontario: Canadian Forest Service; 1987. (Forestry Technical Report 35)
Viegas DX, Reis RM, Cruz MG, Viegas MT. Calibração do Sistema Canadiano de Perigo de Incêndio para Aplicação em Portugal. Silva Lusitana. 2004;12:77-93.
Viola MR, Mello CR, Pinto DBF, Mello JM, Ávila LF. Métodos de interpolação espacial para o mapeamento da precipitação pluvial. Revista Brasileira de Engenharia Agrícola e Ambiental. 2010;14:970-8.
Vosgerau JL, Batista AC, Soares RV, Grodzki L. Avaliação dos registros de incêndios
florestais do estado do Paraná no período de 1991 a 2001. Floresta. 2006;36:23-32.
White BLA. Incêndios florestais no Parque Nacional Serra de Itabaiana - Sergipe. [Dissertação] São Cristóvão: Universidade Federal de Sergipe; 2010.
White BLA, Ribeiro GT. Análise da
precipitação e sua influência na ocorrência de incêndios florestais no Parque Nacional Serra de Itabaiana, Sergipe, Brasil. Revista
Ambiente & Água. 2010;6:48-156.
White LAS, White BLA, Ribeiro GT.