Dominance, epistasis, heritabilities and expected genetic gains
José Marcelo Soriano Viana
Universidade Federal de Viçosa, Departamento de Biologia Geral, Viçosa, MG, Brazil.
Abstract
Although epistasis is common in gene systems that determine quantitative traits, it is usually not possible to estimate the epistatic components of genotypic variance because experiments in breeding programs include only one type of progeny. As the study of this phenomenon is complex, there is a lack of theoretical knowledge on the contribution of the epistatic variances when predicting gains from selection and on the bias in estimating genetic parameters when fitting the additive-dominant model. The objective of this paper is to discuss these aspects. Regarding a non-inbred population, the genetic value due to dominance and the epistatic components of the genotypic value are not indicators of the number of favorable genes present in an individual. Thus, the efficiency of a selection process should be based on the narrow-sense heritability, a function only of additive variance. If there is no epistasis, generally it is satisfactory to assess the selection efficiency and to predict gain based on the broad-sense heritability. Regardless of the selection unit or type of epistasis, the bias in the estimate of the additive variance when assuming the additive-dominant model is considerable. This implies overestimation of the heritabilities at half sib family mean, plant within family and plant levels, and underestimation if the selection units are full sib progenies. The predicted gains will have a bias proportional to that of the heritability.
Key words:breeding, genetic parameters, gene interaction, selection. Received: October 24, 2003; Accepted: August 16, 2004.
Introduction
The methodologies generally used to study quantita-tive trait inheritance, including interaction between non-allelic genes, are generation mean analysis (Mather and Jinks, 1974), that permits estimation of linear compo-nents of genotypic means, and triple test cross analysis (Kearsey and Jinks, 1968), which permits testing the exis-tence of epistasis. Rebetzkeet al. (2003) reported epistatic
gene action from crosses between a wheat variety with low leaf conductance and three with high leaf conductance val-ues. Kumaret al. (2003) observed that wheat embryo
resis-tance to Noevossia indica also depended on epistatic
effects. In the presence of the pathogen, they identified complementary epistasis for fresh weight of calli. Interac-tion between gene combinaInterac-tions of two and three loci was observed by Sharmaet al. (2003) in a study of spike length
inheritance in durum wheat plants. At normal and late sow-ing, digenic epistatic effects predominated compared to ad-ditive and dominance effects. In a study of mungbean resistance toErysiphe polygoni, Gawande and Patil (2003)
observed duplicate epistasis for disease incidence and area under disease progress curve. Zhao and Meng (2003)
re-ported gene interaction in rapeseed plant resistance to
Sclerotinia sclerotiorum. The predominant type of epistasis
was additive x additive. With the objective of determining the importance of epistatic effects in maize hybrid produc-tion, Hinze and Lamkey (2003) observed significant epistatic interaction in five of the forty cases analyzed. Al-though with a smaller contribution to soybean plant resis-tance to Cercospora sojina, as compared to the mean
effects of genes and allelic interactions, Martins et al.
(2003) reported epistasis to be responsible for the degree of infection, number of lesions per foliole, mean lesion diame-ter and disease index. Khattaket al. (2003) used a triple test
cross to detect that epistasis was responsible for two sec-ondary components of mungbean plant yield, only in the spring/summer planting. Regarding number of branches and biomass, partitioning of total epistasis revealed addi-tive x addiaddi-tive, addiaddi-tive x dominant and dominant x domi-nant epistatic interactions, with predominance of the first type.
The estimation of epistatic components of genotypic variance is unusual in genetic studies because of limitation of the methodology, as in the case of the triple test cross, the high number of generations to be produced and assessed (Viana, 2000), and mainly because only one type of prog-eny, half sib, full sib or inbred families, is commonly in-cluded in the experiments. Even with the phenotypic values Copyright by the Brazilian Society of Genetics. Printed in Brazil
www.sbg.org.br
Send correspondence to José Marcelo Soriano Viana. Universida-de FeUniversida-deral Universida-de Viçosa, Departamento Universida-de Biologia Geral, 36.570-000 Viçosa, MG, Brazil. E-mail: [email protected].
of plants in the families and in one or more genetically ho-mogeneous populations, for estimation of the environmen-tal variance at plant level, the breeder has two equations, the mean squares between and within families, to estimate at least five genetic variances, assuming a non-inbred popu-lation and digenic epistasis (Hallauer and Miranda Filho, 1988). An exception is the study by Braga (1987). Com-monly, the additive-dominant model is fitted, assuming epistasis to be negligible or non-existent. As epistasis is common and not occasional, the consequences of this nec-essary simplification should be known. Furthermore, be-cause of the complexity of theoretical studies on epistasis, there is a lack of information about the contribution of the epistatic components of genotypic variance when predict-ing gains from selection. The objective of this study was to produce theoretical knowledge on these problems.
Methods, Results and Discussion
Genotypic variance in non-inbred populations
The genotypic value of an individual in relation to two loci (A and B) is (Kempthorne, 1955):
(
) (
)
Gijmn M i
A j A m B n B ij A mn B
= + α +α +α +α + δ +δ +
(
α α α α α α α α) (
α δ α δ)
δ α i A m B i A n B j A m B j A n B i A mn B j A mn B ij A m + + + + + +
(
B)
ij A n B ij A mn B
M A D AA AD
DA DD
+ = + + + + +
+
δ α + δ δ
whereαrepresents the effect of a gene,δrepresents the ef-fect of interaction between alleles (due to the presence of a pair of alleles), αα represents the additive x additive epistatic effect (due to the presence of a pair of non-allelic genes),αδrepresents the additive x dominant epistatic ef-fect (due to the presence of a gene of one locus and a pair of alleles from another locus), andδδrepresents the dominant x dominant epistatic effect (due to the presence of two pairs of non-allelic genes). Under the restrictions
( )
( )
E i p E p p
A i i A i m B m m B m j ij A j
α =
∑
α = α =∑
α =∑
δ(
)
(
)
(
)
p p p
p p n mn B i i A m B i m i A m B m n n i A mn B n i i A m
δ α α α α
α δ α δ
= = = =
∑
∑
∑
∑
(
)
(
)
(
)
(
)
n B i j ij A m B j m ij A m B m i ij A mn B i m ij A m pp p p
∑
∑
∑
∑
= =
= =
δ α
δ α δ δ
(
δ δ n)
B
m
∑
=0where p represents the probability of a gene, M is the popu-lation mean with
( )
E Gijmn p p p p Gi j m n ijmn G M
n m j i
=
∑
∑
∑
∑
= .... =and the expectations of the additive (A), due to dominance (D), additive x additive (AA), additive x dominant (AD),
dominant x additive (DA) and dominant x dominant (DD) genetic values are nil.
The mean of the genotypes containing gene Aiis:
Gi p p p Gj m n ijmn M + i A
n m j
K =
∑
∑
∑
= αThe effect of gene Aiis, thus,αi A
i
= GK−G... As-suming two allelic forms,αi α
A a a
= q if the gene increases the trait expression, orαi α
A
a a
= -p if the gene decreases it, where pais the frequency of the gene that increases the
ex-pression of the characteristic andαa = aa +(qa −p )da a is
the average effect of a gene substitution. Parameter aais the
deviation between the genotypic value of the homozygote of greatest expression and the mean of the homozygotes, and da is the deviation due to dominance (Falconer and
Mackay, 1996).
The mean of the genotypes containing the Aiand Aj
alleles is:
Gij.. p p Gm n ijmn M + i +
A j A ij A n m
=
∑
∑
= α α +δThe genetic value due to dominance of the genotype AiAjis, therefore,δij
A
ij.. i... . j.. ....
G G G G
= − − + . Taking two
alleles,δij A
a 2
a
2q d
= − if the individual is homozygous for the gene that increases the trait expression,δij
A
a a a
2p q d
=
if it is heterozygous, orδij A
a 2
a
2p d
= − if it is homozygous for the gene that decreases the expression of the character-istic (Falconer and Mackay, 1996).
The mean of the genotypes containing both the Aiand
Bmgenes is:
(
)
Gi. m. p p Gj n ijmn M + i +
A m B i A m B n j
=
∑
∑
= α α + α αThus,
(
α αi)
Am B
i. m. i... .. m. ....
= G −G −G +G . The mean of the genotypes containing genes Ai, Bmand Bnis:
Gi. mn p Gj ijmn M + i +
A m B n B mn B j
=
∑
= α α +α +δ +(
α αi) (
α α) (
α δ)
A m B i A n B i A mn B + + Thus,(
α δi)
Amn B
i. mn i... .. m. ... n i. m.
= G +G +G +G −G −
Gi.. n−G.. mn−G.....
Finally,
δ δij α α α α δ − δ
A mn B ijmn i A j A m B n B ij A mn B
= G - M - - - − − −
(
) (
) (
) (
) (
)
(
)
α α α α α α α α α δ
α δ δ α
i A m B i A n B j A m B j A n B i A mn B j A mn B ij A m − − − − −
−
(
B) (
)
ij A
n B
− δ α
(
)
( )( )
Cov i p p
A j A
i j i A
j A
j i
α α, =
∑
∑
α α =( )
( )
(
)
p p Cov
p i i A i j j A j ij A m B ij A mn B
α α δ α δ δ
∑
∑
= =K , =
(
)(
)
(
)
i j m n ij A m B ij A mn B n m j i
i j m ij A
m B
m
p p p
p p p
δ α δ δ
δ α =
∑
∑
∑
∑
∑
(
)
=∑
∑
∑
pn ijA mn B n j i
δ δ 0
and, therefore,
[
]
[
]
V(Gijmn) G E Gijmn M E( )
2
i A
=σ2 = ( )2 − =2 α 2 +
( )
( )
( )
(
)
2E m 2 E 2 E 2 4 E 2
B ij A mn B i A m B
α δ δ α α
+ + +
(
)
(
)
(
)
+ + + 2E i 2 2 E 2 E 2
A mn B ij A m B ij A mn B
α δ δ α δ δ
=
+ + + + + + + =
+
σ σ σ σ σ σ σ σ
σ A 2 A 2 D 2 D 2 AA 2 AD 2 DA 2 DD 2 A 2
a b a b
σD σ σ σ σ
2 AA 2 AD 2 DA 2 DD 2 + + + + where:
( )
( )
( )
σ α σ α σ δ σ A 2 i i A i A 2 m m B m D 2i j ij A j i D 2 a b a b p p p p = = =
∑
∑
∑
∑
2 2 2 2 2( )
(
)
= = =∑
∑
∑
∑
∑
p p p pp p p
m n mn B
n m
AA 2
i m i A m B m i AD 2
i m n n
δ
σ α α
σ α
2
2
4
2
(
)
(
)
i A mn B m i DA 2i j m m ij A m B j i DD 2
i j m n
p p p
p p p p
δ
σ δ α
σ 2 2 2
∑
∑
∑
∑
∑
= =(
)
n m ij A mn B j i∑
∑
∑
∑
δ δ 2When each gene has two allelic forms, these expres-sions are equivalent to those obtained by Cockerham (1954).
Correlation between number of genes that increase the trait expression and components of the
genotypic value
When considering two genes with independent as-sortment, both with two alleles, and a population in Hardy-Weinberg and linkage equilibrium, the expectation and the variance of the number of genes that increase the trait expression (N) are:
( )
E N p p (4) q q (0) 2p 2p
p p (4) q
a 2 b 2 a 2 b 2 a b N 2 a 2 b 2 2 = + + = + = + + K K
σ a
(
)
2 b 2 2
a b
a a b b
q (0) 2p 2p
2p q 2p q
− + =
+
2
The covariances between the number of genes that in-crease the trait expression and the components of the genotypic value are:
(
)
( )
Cov(N, A) p . p (4) Aa p .2p q (3) A
2 b 2
22 a 2
b b 21
= + +
(
)
( )
( )
p .q (2) A p q . p (3) A p q
p q A p
a 2
b 2
20 a a b 2
12 a a
b b 11
+ +
+
2 2
2 2 2
.
( )
(
)
(
)
( )
a a b 2 10 a 2 b 2 02 a 2
b b 01 a
2 b
q .q (1) A q . p (2) A q .2p q (1) A q .q
+ +
+ 2
(
) ( )
00
a a a b b b
(0) A E N .0 =
p q + p q
−
2 α 2 α
( )
(
)
Cov(N, D) p . p (4) Da q q (0) D
2 b 2 22 a 2 b 2 00
= + +K −
( )
E N .0 0=
where Arsand Drsare the additive and due to dominance
ge-netic values of the genotype containing r and s copies, re-spectively, of the genes of loci A and B that increase the trait expression,
(
)
[
]
Cov(N, AA) p . p (4)a p .2p q (3).
2 b 2
A B a
2 b b
= 4 α α +
(
) (
)
[
]
[
(
)
]
(
)
2 2 4
2 2 2
α α α α α α
α α α α
A B A b a
2 b 2
A b
a a b 2
A B a
p .q (2)
p q . p (3)
+ + +
+
(
)
[
]
(
) (
) (
) (
)
[
]
B a a b b
A B A b a B a b a a b
2
p q p q
p q .q (1)
+
+ + + +
2 2 2
2
2
. ( )
α α α α α α α α
α
(
) (
)
[
]
[
(
)
]
(
) (
)
[
]
A b a b a
2 b 2 a B a 2
b b a B a b
q . p (2)
q .2p q (1)
α α α α α
α α α α
+ + + + + 2 4 2 2
(
)
[
]
( )
q .q (0)a2 E N .0 = 0
b 2
a b
4 α α −
(
)
[
]
Cov(N, AD) p . p (4)a 2
b 2
A BB
= 2 α δ + +K
(
)
[
]
( )
q .q (0)a E N .0 = 0
2 b 2
a bb
2α δ −
(
)
[
]
Cov(N, DA) p . p (4)a2 b 2
AA B
= 2 δ α + +K
(
)
[
]
( )
q .q (0)a E N .0 = 0
2 b 2
aa b
2δ α −
(
)
Cov(N, DD) p . p (4)a 2
b 2
AA BB
= δ δ + +K
(
) ( )
q .q (0)a E N .0 = 0
2 b 2
aa bb
δ δ −
under the restrictions previously established.
Considering k genes, the correlations between the number of genes that increases the trait expression and the components of the genotypic value are:
ρ
α
α
N,A
i i i i 1
k
i i i 1
k
i i i i 1
k
p q
p q p q
= = = =
∑
∑
∑
22 2 2
ρN,D=ρN,AA =ρN,AD =ρN,DA =ρN,DD =0
ρ
α
σ σ σ σ
N,G
i i i i 1
k
i i i 1
k
A 2
D 2
AA 2
AD 2
p q
p q =
+ + +
=
=
∑
∑
2
2
(
+σDA2 +σDD2)
Thus, of the components of the genotypic value, only the additive genetic value correlates with the number of fa-vorable genes that an individual possesses (the correlation between the number of genes that decreases the trait ex-pression and A has the same magnitude and opposite sign to
ρN,A). In the presence of dominance and epistasis or only
dominance, the correlation between the number of favor-able genes and the genotypic value is less than the correla-tion between the number of favorable genes and A. Thus, the additive genetic value is generally the best indicator of the number of favorable genes present in an individual. When considering one gene,ρN,Ais equal to 1, with
com-plete dominance, partial dominance or in the absence of dominance, or equal to 1 or -1, with overdominance, de-pending on the gene frequencies, since the average effect of a gene substitution may be negative (Falconer and Mackay, 1996). Therefore, regardless of the gene frequencies and the degree of dominance, in non-inbred populations the ge-netic values due to dominance, additive x additive, additive x dominant, dominant x additive and dominant x dominant, among other more complex epistatic values, cannot be used to indicate the number of favorable genes present in an indi-vidual.
Based on the values of the correlation between N and A considering three genes (Table 1), assuming ai= a, for all
i, it can be inferred that, regardless of the number of genes and of the gene frequencies, the lower the degree of domi-nance, the greater the linear association between the num-ber of favorable genes and the additive genetic value. The correlation is of low magnitude or negative only in the case
of overdominance and when the frequencies of the domi-nant genes are high. The correlation values should be high in the most complex polygenic systems, if there is no overdominance. For example, regardless of the number of genes, assuming that for 15%, 25%, and 60% of the loci the frequency of the dominant genes is low (0.1), intermediate (0.5) or high (0.9), respectively, and where in 2%, 70%, 20% and 8% of these loci overdominance (d/a= 2), complete dominance (d/a= 1), partial dominance (d/a= 1/2) and absence of dominance applies, the correlation value is 0.86. Assuming that the frequencies of the dominant genes are low (0.1), intermediate (0.5) and high (0.9), the correlation values are, respectively, 0.94, 1 and 0.45. The value of 0.45 is a consequence of the 2% of the genes with over-dominance because, by altering the degree of over-dominance in these loci to complete dominance, the correlation value in-creases to 0.83.
The consequence of the absence of correlation be-tween the additive x additive epistatic genetic value and the number of favorable genes is that, also in the presence of epistasis, the efficiency of mass selection is proportional to the correlation between the phenotypic value of the individ-ual, the value used in the selection, and its additive genetic value. This correlation is equal to the square root of the nar-row-sense heritability at the individual level (Viana, 2002). If the selection units are half sib families, the efficiency of among-family selection is proportional to the correlation between the mean phenotypic value of the progeny and the additive genetic value of the common parent, that is equal to the square root of the narrow-sense heritability at the family level (Viana, 2002), because the correlation between the number of genes that increase the trait expression in the common parent (N) and the mean frequency of these genes in the family (p) is:
Table 1- Correlations between the number of genes that increase the trait expression (N) and the additive genetic value (A) and the genotypic value (G; assuming absence of epistasis), considering three genes, different populations (p is the frequency of the dominant gene) and four degrees of dominance.
pa pb pc d/a= 2 d/a= 1 d/a= 1/2 d/a= 0
ρN,A ρN,G ρN,A ρN,G ρN,A ρN,G ρN,A ρN,G
0.1 0.1 0.1 1.0000 0.9507 1.0000 0.9733 1.0000 0.9887 1.0000 1.0000
0.1 0.1 0.5 0.9041 0.7562 0.9590 0.8795 0.9860 0.9553 1.0000 1.0000
0.1 0.1 0.9 0.7129 0.6631 0.8592 0.8257 0.9488 0.9342 1.0000 1.0000
0.1 0.5 0.5 0.9077 0.6482 0.9687 0.8380 0.9909 0.9455 1.0000 1.0000
0.1 0.5 0.9 0.6948 0.5318 0.8881 0.7823 0.9681 0.9291 1.0000 1.0000
0.1 0.9 0.9 0.2955 0.2603 0.6971 0.6465 0.9169 0.8947 1.0000 1.0000
0.5 0.5 0.5 1.0000 0.5774 1.0000 0.8165 1.0000 0.9428 1.0000 1.0000
0.5 0.5 0.9 0.7958 0.4594 0.9503 0.7686 0.9885 0.9319 1.0000 1.0000
0.5 0.9 0.9 0.3860 0.2228 0.8600 0.6774 0.9730 0.9174 1.0000 1.0000
ρN,p
i i i 1
k
i i i 1
k
2 i i i 1
k
2k p q
p q
8k p q
=
=
= =
∑
∑
∑
1
2 1
=1
(The correlation considering the number of genes that de-creases the expression of the trait is -1).
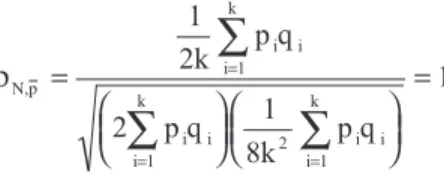
When the selection units are full sib families, the effi-ciency of among-family selection is proportional to the cor-relation between the mean phenotypic value of the progeny and the mean of the additive genetic values of the parents, that is equal to the square root of the narrow-sense heritability at the family level (Viana, 2002), because the correlation between the mean number of genes that in-creases the trait expression (N) and the mean frequency of these genes in the family (p) is:
ρN,p
i i i 1
k
i i i 1
k
2 i i i 1
k
2k p q
p q
4k p q
=
=
= =
∑
∑
∑
1
1
=1
(The correlation considering the number of genes that de-crease the trait expression is -1).
In the case of selection within non-inbred families, the efficiency is proportional to the mean of the coefficients of correlation between the phenotypic and the additive ge-netic values of the individual, as calculated for each family. This is equal to the square root of the narrow-sense
heritability at the plant within family level. Therefore, when considering a non-inbred population, the numerator for all narrow-sense heritabilities must be a function of the additive genetic variance, since the genetic values due to dominance and epistasis do not correlate with the number of favorable genes that an individual possesses.
In many situations, depending on the selection unit and on the experimental data, it is only possible to assess the efficiency of a selective process from the broad-sense heritability, which is equal to the square of the correlation between the phenotypic and genotypic values of the selec-tion unit (Viana, 2002). In these cases, as this heritability is greater than the corresponding narrow-sense heritability, the efficiency of selection is in general overestimated be-cause of the lower value of the correlation between the genotypic value of the individual and the number of favor-able genes present.
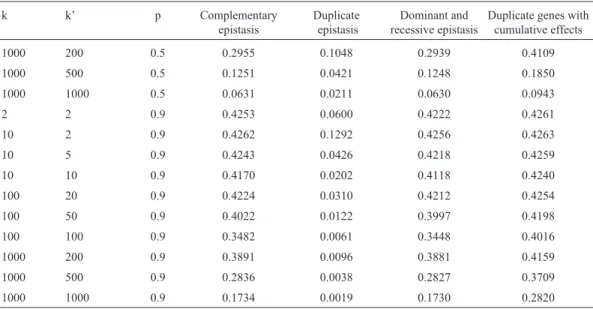
With complementary epistasis (Viana, 2004), only in relation to simpler polygenic systems with up to ten genes, 50% of which interact, and in populations with intermedi-ary frequencies of the dominant genes, the correlation be-tween the number of genes that increase the trait expression and the genotypic value of the individual assumes a value equal or superior to 0.7. (Table 2). Regardless of the type of epistasis,ρN,A= 1, assuming pi= p for all i. In the case of
duplicate epistasis (Viana, 2004), only for polygenic sys-tems with up to 100 genes, of which at most 20% interact, and in populations with low frequencies of the dominant genes, the correlation value is greater than or equal to 0.7.
Table 2- Correlation values between the number of genes that increase the trait expression and the genotypic value of the individual, considering four types of epistasis, for different polygenic systems (k is the number of genes and k’ is the number of genes that interact) and populations (p is the frequency of the dominant genes).
k k’ p Complementary
epistasis
Duplicate epistasis
Dominant and recessive epistasis
Duplicate genes with cumulative effects
2 2 0.1 0.5500 0.9208 0.8511 0.2452
10 2 0.1 0.8150 0.9621 0.9447 0.4896
10 5 0.1 0.4243 0.8760 0.4990 0.1762
10 10 0.1 0.2166 0.6789 0.2368 0.0841
100 20 0.1 0.3227 0.8095 0.3357 0.1288
100 50 0.1 0.1334 0.4945 0.1357 0.0511
100 100 0.1 0.0668 0.2741 0.0674 0.0255
1000 200 0.1 0.1051 0.4088 0.1055 0.0401
1000 500 0.1 0.0422 0.1769 0.0422 0.0160
1000 1000 0.1 0.0211 0.0895 0.0211 0.0080
2 2 0.5 0.7559 0.5164 0.6963 0.7878
10 2 0.5 0.8032 0.7161 0.7875 0.8105
10 5 0.5 0.7071 0.4082 0.6667 0.7620
10 10 0.5 0.5164 0.2144 0.4815 0.6325
100 20 0.5 0.6389 0.3154 0.6239 0.7213
100 50 0.5 0.3621 0.1329 0.3551 0.4867
Admitting dominant and recessive epistasis of a gene with the other (k’ - 1) and complementary interaction for the other k’(k’ - 1)/2 pairs (Viana, 2004), where k’ is the num-ber of genes that interact, the correlation value tends to be greater than or equal to 0.7 only in simpler genetic systems (with up to 10 genes, of which at most 50% interact, and in populations with low to intermediate frequencies of the dominant genes). Assuming duplicate genes with cumula-tive effects (Viana, 2004), the correlation will also be greater than or equal to 0.7 in genetic systems with up to 10 genes, of which at most 50% interact, and in populations with intermediate frequencies of the dominant genes. The correlation values in the case of duplicate genes with cumu-lative effects were obtained by assuming, for each pair of interacting genes, that the parameter a is equal to the epistatic genetic value of the homozygote for the genes that decrease the trait expression (Viana, 2004). Generally, the correlation is inversely proportional to the relation between a and that epistatic value. When considering ai≈a for all i,
the correlation values with recessive epistasis are close to those with complementary epistasis; the values with domi-nant epistasis are close to those with duplicate gene action; and the values with non-epistatic gene interaction are close to those with duplicate genes with cumulative effects.
If there is dominance, but no epistasis, the lower the degree of dominance, the closer theρN,GandρN,Avalues
(Table 1). Except for the gene systems with predominantly overdominance interaction and in populations with high frequencies of the dominant genes, the values are close, in-dicating that, generally, it is not problematic to assess the efficiency of selection of individuals and progenies based on the broad-sense heritability. The predicted genetic gain, however, will have an additional bias, proportional to the variance due to dominance.
When there is digenic epistasis, if the selection units are half sib progenies, the additive variance of the addi-tive-dominant model is:
σA σ σ σ
2* Ga 2
A 2
AA 2
=4 = +1
4
whereσGa
2 is the among family genotypic variance.
With full sib families the value is:
(
)
σA σ σ σ σ σ σ
2* Ga 2
Gw 2
A 2
AD 2
DA 2
DD 2
=3 − = −1 + −
2
3 4
whereσGw
2 is the within family genotypic variance.
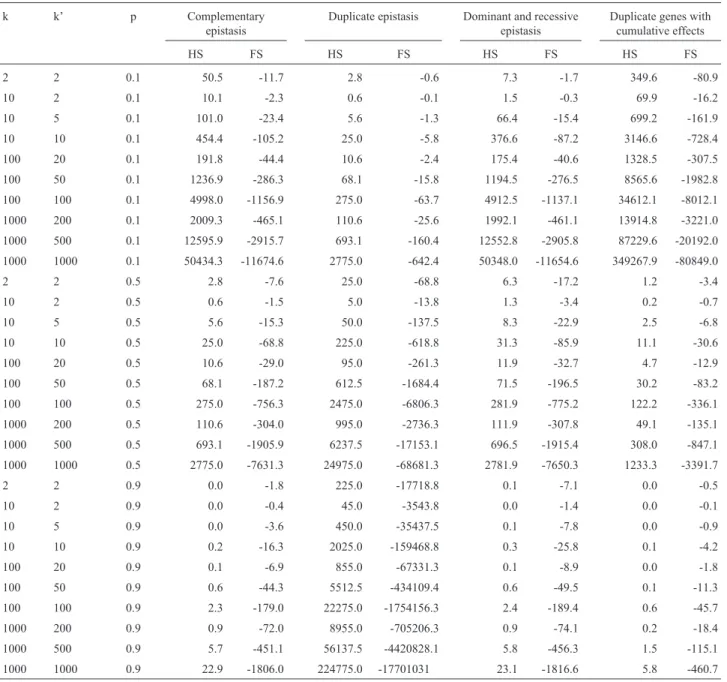
Regardless of the type of epistasis, the bias in the esti-mation of the additive variance tends to be considerable (Table 3). The very high magnitudes are mainly the reflec-tion of the assumpreflec-tion of equality of the gene frequencies at all the loci. The values are generally lower when two genes and different gene frequencies are considered (Table 4). With complementary, recessive, and dominant and reces-sive epistasis, duplicate genes with cumulative effects and non-epistatic gene interaction, the bias is generally less than 10% only in simple polygenic systems, with up to ten genes, of which at most 20% interact, and in populations with intermediate to high frequencies of the dominant genes. In the case of duplicate gene action and dominant epistasis, the bias is only less than 10% for simpler polygenic systems, with up to ten genes, of which at most 20% interact, and in populations with low frequencies of the dominant genes. Consequently, the narrow-sense heritabilities at the half sib family mean, plant within fam-ily and plant levels are overestimated. With full sib fami-lies, the narrow-sense heritabilities at the progeny mean, individual within family and individual levels are
underes-Table 2 (Cont.)
k k’ p Complementary
epistasis
Duplicate epistasis
Dominant and recessive epistasis
Duplicate genes with cumulative effects
1000 200 0.5 0.2955 0.1048 0.2939 0.4109
1000 500 0.5 0.1251 0.0421 0.1248 0.1850
1000 1000 0.5 0.0631 0.0211 0.0630 0.0943
2 2 0.9 0.4253 0.0600 0.4222 0.4261
10 2 0.9 0.4262 0.1292 0.4256 0.4263
10 5 0.9 0.4243 0.0426 0.4218 0.4259
10 10 0.9 0.4170 0.0202 0.4118 0.4240
100 20 0.9 0.4224 0.0310 0.4212 0.4254
100 50 0.9 0.4022 0.0122 0.3997 0.4198
100 100 0.9 0.3482 0.0061 0.3448 0.4016
1000 200 0.9 0.3891 0.0096 0.3881 0.4159
1000 500 0.9 0.2836 0.0038 0.2827 0.3709
Table 3- Bias (%) in the estimate of the additive variance because of the fitting of the additive-dominant model when there is digenic epistasis, considering half sib (HS) and full sib (FS) progenies, for different types of epistasis, polygenic systems (k is the number of genes and k’ is the number of genes that interact) and populations (p is the frequency of the dominant genes).
k k’ p Complementary
epistasis
Duplicate epistasis Dominant and recessive epistasis
Duplicate genes with cumulative effects
HS FS HS FS HS FS HS FS
2 2 0.1 50.5 -11.7 2.8 -0.6 7.3 -1.7 349.6 -80.9
10 2 0.1 10.1 -2.3 0.6 -0.1 1.5 -0.3 69.9 -16.2
10 5 0.1 101.0 -23.4 5.6 -1.3 66.4 -15.4 699.2 -161.9
10 10 0.1 454.4 -105.2 25.0 -5.8 376.6 -87.2 3146.6 -728.4
100 20 0.1 191.8 -44.4 10.6 -2.4 175.4 -40.6 1328.5 -307.5
100 50 0.1 1236.9 -286.3 68.1 -15.8 1194.5 -276.5 8565.6 -1982.8
100 100 0.1 4998.0 -1156.9 275.0 -63.7 4912.5 -1137.1 34612.1 -8012.1
1000 200 0.1 2009.3 -465.1 110.6 -25.6 1992.1 -461.1 13914.8 -3221.0
1000 500 0.1 12595.9 -2915.7 693.1 -160.4 12552.8 -2905.8 87229.6 -20192.0
1000 1000 0.1 50434.3 -11674.6 2775.0 -642.4 50348.0 -11654.6 349267.9 -80849.0
2 2 0.5 2.8 -7.6 25.0 -68.8 6.3 -17.2 1.2 -3.4
10 2 0.5 0.6 -1.5 5.0 -13.8 1.3 -3.4 0.2 -0.7
10 5 0.5 5.6 -15.3 50.0 -137.5 8.3 -22.9 2.5 -6.8
10 10 0.5 25.0 -68.8 225.0 -618.8 31.3 -85.9 11.1 -30.6
100 20 0.5 10.6 -29.0 95.0 -261.3 11.9 -32.7 4.7 -12.9
100 50 0.5 68.1 -187.2 612.5 -1684.4 71.5 -196.5 30.2 -83.2
100 100 0.5 275.0 -756.3 2475.0 -6806.3 281.9 -775.2 122.2 -336.1
1000 200 0.5 110.6 -304.0 995.0 -2736.3 111.9 -307.8 49.1 -135.1
1000 500 0.5 693.1 -1905.9 6237.5 -17153.1 696.5 -1915.4 308.0 -847.1
1000 1000 0.5 2775.0 -7631.3 24975.0 -68681.3 2781.9 -7650.3 1233.3 -3391.7
2 2 0.9 0.0 -1.8 225.0 -17718.8 0.1 -7.1 0.0 -0.5
10 2 0.9 0.0 -0.4 45.0 -3543.8 0.0 -1.4 0.0 -0.1
10 5 0.9 0.0 -3.6 450.0 -35437.5 0.1 -7.8 0.0 -0.9
10 10 0.9 0.2 -16.3 2025.0 -159468.8 0.3 -25.8 0.1 -4.2
100 20 0.9 0.1 -6.9 855.0 -67331.3 0.1 -8.9 0.0 -1.8
100 50 0.9 0.6 -44.3 5512.5 -434109.4 0.6 -49.5 0.1 -11.3
100 100 0.9 2.3 -179.0 22275.0 -1754156.3 2.4 -189.4 0.6 -45.7
1000 200 0.9 0.9 -72.0 8955.0 -705206.3 0.9 -74.1 0.2 -18.4
1000 500 0.9 5.7 -451.1 56137.5 -4420828.1 5.8 -456.3 1.5 -115.1
1000 1000 0.9 22.9 -1806.0 224775.0 -17701031 23.1 -1816.6 5.8 -460.7
Table 4- Bias (%) in the estimate of the additive variance because of the fitting of the additive-dominant model when there is digenic epistasis, considering two genes, half sib (HS) and full sib (FS) progenies, for different types of epistasis and populations (p is the frequency of the dominant genes).
Epistasis pA pB HS FS
Complemen-tary
0.1 0.3 16.54 -9.52
0.1 0.6 2.65 -4.60
0.1 0.9 0.05 -0.45
0.5 0.1 5.27 -6.29
0.5 0.9 0.05 -0.76
0.9 0.7 0.04 -1.20
0.9 0.4 0.05 -0.65
Epistasis pA pB HS FS
Duplicate 0.1 0.3 4.41 -2.54
0.1 0.6 5.17 -8.98
0.1 0.9 5.49 -54.12
0.5 0.1 5.00 -5.97
0.5 0.9 45.00 -753.75
0.9 0.7 92.65 -2509.19
timated. The predicted gains will, therefore, have an addi-tional bias, proporaddi-tional to that of the heritability.
References
Braga MCT (1987) Estudo de dois loci determinantes da re-sistência da soja (Glycine Max(L.) Merril) aCercospora sojinaHara. M.Sc. Thesis, Universidade Federal de Viçosa, Viçosa.
Cockerham CC (1954) An extension of the concept of partitioning hereditary variance for analysis of covariance among rela-tives when epistasis is present. Genetics 39:859-882. Falconer DS and Mackay TFC (1996) Introduction to
Quantita-tive Genetics. 4th edition. Longman, New York, 464 pp. Gawande VL and Patil JV (2003) Genetics of powdery mildew
(Erysiphe polygoni DC) resistance in Mungbean (Vigna radiata(L.) Wilczek). Crop Protection 22:567-571. Hallauer AR and Miranda Filho JB (1988) Quantitative Genetics
in Maize Breeding. 2nd edition. Iowa State University Press, Ames, 468 pp.
Hinze LL and Lamkey KR (2003) Absence of epistasis for grain yield in elite maize hybrids. Crop Science 43:46-56. Kearsey MJ and Jinks JL (1968) A general method of detecting
additive, dominance and epistatic variation for metrical traits. I. Theory. Heredity 23:403-409.
Kempthorne O (1955) The theoretical values of correlations be-tween relatives in random mating populations. Genetics 40:153-167.
Khattak GSS, Haq MA, Ashraf M, Khan AJ and Zamir R (2003) Genetic architecture of secondary yield components in
mungbean (Vigna radiata(L.) Wilczek). Breeding Science 52:235-241.
Kumar M, Luthra OP, Chawla V, Yadav NR, Kumar R and Khar A (2003) Genetic analysis of Karnal bunt (Neovossia indica) resistance in wheat. Journal of Biosciences 28:199-203. Martins S, Gravina GD and Sediyama CS (2003) Genetic control
of soybean resistance to race 4 of Cercospora sojina. Pesquisa Agropecuária Brasileira 37:1727-1733.
Mather K and Jinks JL (1974) Biometrical Genetics. 2nd edition. Cornell University Press, Ithaca, New York, 382 pp. Rebetzke GJ, Condon AG, Richards RA and Farquhar GD (2003)
Gene action for leaf conductance in three wheat crosses. Australian Journal of Agricultural Research 54:381-387. Sharma SN, Sain RS and Sharma RK (2003) Genetics of spike
length in durum wheat. Euphytica 130:155-161.
Viana JMS (2000) Components of variation of polygenic systems with digenic epistasis. Genetics and Molecular Biology 23:883-892.
Viana JMS (2002) Heritability at family mean level. Revista Árvore 26:271-278.
Viana JMS (2004) Relative importance of the epistatic compo-nents of genotypic variance in non-inbred populations. Crop Breeding and Applied Biotechnology 4:18-27.
Zhao JW and Meng JL (2003) Genetic analysis of loci associated with partial resistance toSclerotinia sclerotiorumin rape-seed (Brassica napusL.). Theoretical and Applied Genetics 106:759-764.
Associate Editor: Pedro Franklin Barbosa
Table 4 (Cont.)
Epistasis pA pB HS FS
Dominant and reces-sive
0.1 0.3 4.34 -2.50
0.1 0.6 1.83 -3.17
0.1 0.9 0.05 -0.45
0.5 0.1 33.44 -39.94
0.5 0.9 0.05 -0.77
0.9 0.7 1.14 -30.83
0.9 0.4 10.31 -145.99
Epistasis pA pB HS FS
Duplicate genes with cumulative effects
0.1 0.3 31.92 -18.37
0.1 0.6 3.66 -6.36
0.1 0.9 0.06 -0.58
0.5 0.1 7.73 -9.24
0.5 0.9 0.06 -0.98
0.9 0.7 0.06 -1.54