accepted after revision March 27 , 2012
Bibliography DOI http://dx.doi.org/ 10.1055/s-0032-1312582 Published online: 2012 Int J Sports Med © Georg Thieme
Verlag KG Stuttgart · New York ISSN 0172-4622
Correspondence
Prof. Tiago Miguel Barbosa IPB
Sport Sciences Campus Sta Apolonia 5300 Bragança Portugal
Tel.: +35/127/3330 664 Fax: +35/127/3313 684 [email protected] Key words
●▶ swimming
●▶ kinematics
●▶ swim strokes
●▶ speed fl uctuation
●▶ age-group swimmers
The Interaction Between Intra-Cyclic Variation of
the Velocity and Mean Swimming Velocity in Young
Competitive Swimmers
Where v max is the maximal swimming velocity, Ėtot-max is the maximal total energy expenditure corrected for body mass and C is the energy cost (a ratio between energy expenditure and dis-tance). Scientifi c evidence has been collected about these relationships in the 4 swimming techniques [ 7 ] . Since the mid-seventies there has been some speculation that the C would be related to the intra-cyclic variations of the hori-zontal velocity (dv) of the body. In classic mechanics energy is defi ned as the capacity to produce mechanical work. A theoretical compar-ison between the mechanical work performed while swimming at constant v and with d v is described as [ 25 ] :
w
w T
v(t)
v dt T
v(t) v d d d T − = + ⎡ ⎣ ⎢ ⎤ ⎦ ⎥ + ⎡ ⎣ ⎢ ⎤ ⎦ ⎥
∫
constan1 3 3
0 0 0 2 Δ Δ tt T v(t) v dt T T 0 0 3 0 1
∫
∫
+ ⎡ ⎣ ⎢ ⎤ ⎦ ⎥ Δ (3)where w d is the mechanical work, v(t) is the swimming velocity at a given time, v 0 is the swimming velocity at the beginning of the stroke
Introduction
▼
The aim of a competitive swimmer is to travel the event distance as fast as possible:
t d v i i i n i i n i 1 n = = =
∑
∑
∑
= 1 1 (1)Where t i is the duration of each partial phase of the swimming event (start, turns, swimming strokes/laps and fi nish), d i is the swimmer’s cen-tre of mass displacement during each partial moment and v i is swimmer’s centre of mass velocity during each phase. Experimental research has been conducted regarding the importance of each partial phase for swimming performance [e. g. [ 18 ] . In several of those studies it was verifi ed that the swimming moment is the most important to predict the performance [e. g. [ 18 ] . In this sense, the best swimming perform-ance predictor is the mean clean velocity and/or mid-pool swimming velocity. Theoretically it can be considered [ 9 ] :
v E C . tot-max max = (2)
Authors T. M. Barbosa 1 , P. G. F. Morouço 2 , S. Jesus 3 , W. G. Feitosa 4 , M. J. Costa 5 , D. A. Marinho 6 , A. J. Silva 7 , N. D. Garrido 7
Abstract
▼
The aim of this study was to assess the relation-ship between the intra-cyclic variation of the horizontal velocity (dv) and the velocity of the 4 competitive swimming techniques in young swimmers. 45 young swimmers performed a set of maximal 4 × 25 m (freestyle, backstroke, breaststroke and butterfl y stroke) swims with in water start. A speed-meter cable was attached to the swimmer’s hip. The dv and the swim-ming velocity were analyzed. Within-subject tests presented signifi cant variations in the dv based on the swimming technique. Post-hoc test
revealed signifi cant diff erences across all pair-wised swimming techniques (P < 0.001), except for the comparison between freestyle and back-stroke (P = 0.98). The dv was higher in the breast-stroke, followed by the butterfl y, the backstroke and the freestyle. The quadratic models had the best goodness-of-fi t and the lower error of esti-mation for the relationship between the dv and the swimming velocity in all swimming tech-niques (0.24 ≤ R 2 ≤ 0.51). As a conclusion, there is a non-linear relationship where the increase of swimming velocity leads to a decrease of dv in young competitive swimmers.
cycle and T is the total duration of the stroke cycle. Changes in v of ~10 %, within a stroke cycle, results in an additional work demand of ~3 % [ 25 ] . However, probably due to the diffi culty to assess mechanical work in aquatic locomotion techniques, it seems there is no experimental data confi rming this. Instead of mechanical work, it is easier to estimate energy cost, which is a variable related to it. It was suggested that a higher dv leads to an increase in C to overcome inertia and drag force. Later on exper-imental data confi rmed these assumptions in the 4 swimming strokes [ 4 , 5 ] .
Relating eqs. 2 and 3 it can be speculated that there is some kind of relationship between v and dv . At least for land-based loco-motion techniques, the relationship is described as being non-linear [ 22 ] . There is a self-paced v at which the energy expenditure is the lowest [ 12 ] . Added to that, some data reports a positive relationship between vertical displacement of the hip and C or mechanical work or effi ciency for land-based locomo-tion techniques [ 12 , 19 ] and between dv and C for aquatic-based locomotion techniques [ 4 , 5 , 34 ] . So, the dv can be considered as an estimator of the energy cost of locomotion [ 34 ] . Conversely, experimental evidences about the dv-v relationship for competi-tive swimming techniques are not consensual. Literature reports that: (i) there is no signifi cant dv-v relationship assessing the hip with a speed-meter [ 28 , 29 ] or the 3D kinematics of the centre of mass [ 27 ] in front crawl; (ii) decreases of the dv are associated with linear increases of v for the hip with a speed-meter in breaststroke [ 21 ] , a 2D kinematics in butterfl y stroke [ 31 ] or a 3D kinematics in breaststroke [ 30 ] ; (iii) there is a quadratic rela-tionship assessing the 2D kinematics of the centre of mass in all 4 swim strokes [ 5 ] . So, there is a good chance to clarify this issue as no solid evidence is reported in the literature about the dv-v relationship.
This is the fi rst study to analyze all 4 strokes for a single group of swimmers in order to clearly verify which kind of dv-v relation-ship exists. Training sessions for swimmers aged 12–14 years should be mainly based on technique drills to improve all 4 swimming techniques. Unfortunately, most of the time the swimmers in this age group are submitted to very heavy condi-tional training and are not very concerned with technique. On the one hand swimmers in this age group should already have a fairly good and consolidated technique. Young swimmers seems to be the appropriate cohort group to compare the 4 swimming techniques since they practice all of them on a daily basis. On the other hand, adult/elite swimmers are at a stage of high-speciali-zation in their competitive career, mostly concentrating on one single swimming technique and sometimes on a specifi c swim-ming event (i. e., a single swimswim-ming technique and distance). Therefore, the intra-subject comparison and the assessment of the relationship of selected kinematical variables in all 4 swim-ming strokes in adult/elite swimmers seems to have major limi-tations, which can be avoided when assessing young swimmers. Additionally, to the best of our knowledge, scientifi c evidence about the dv-v relationship in young swimmers is non-existent. The aim of this study was to assess the dv-v relationship of the 4 competitive swimming techniques in young swimmers. Based on the data reported in the literature for land-based locomotion techniques, it was hypothesized that for swimming techniques there is also a non-linear dv-v relationship.
Materials and Methods
▼
Subjects
45 young swimmers (23 boys and 22 girls) with at least 4 years of experience in competitive swimming, participating on a regular basis in regional and national level competitions at the moment of data collection, volunteered as subjects (12.78 ± 1.15 years-old, 1.59 ± 0.10 m of height, 49.34 ± 10.15 kg of body mass, 2.57 ± 0.43 Tanner stages by self-evaluation). Parents and coaches gave their written consent for the swimmers’ participation in this study. All procedures were in accordance with the Declaration of Helsinki and approved by the Review Board of the Institution. Additionally, this study has been performed in accordance with the ethical standards proposed by Harriss and Atkinson [ 17 ] .
Protocol
The swimmers carried out a standard warm-up of approximate 1 500 m including continuous swim at low-moderate intensity, drills for legs and arms and some sprints at the end. Each swim-mer undertook a set of maximal 4 × 25 m (freestyle, backstroke, breaststroke and butterfl y stroke) swims with an underwater start in a randomized order. Participants performed the bout alone with no other swimmer in the lane or nearby lanes to reduce drafting and pacing eff ects, or being aff ected by extra drag force due to exogenous factors. The swimmers were advised to reduce gliding during the start to allow data collection between the 11 th and 24 th m. Passive recovery of at least 30 min took place between the warm-up and the fi rst bout, as well as, between each of the 4 bouts.
Data collection
A speed-meter cable (Swim speedo-meter, Swimsportec, Hild-esheim, Germany) was attached to the swimmer’s hip. The speed-meter was placed in the forehead-wall of the swimming pool, about 0.2 m above water surface. Young swimmers’ coaches and researchers are aware that weak kicking is a major issue in young swimmers. Although it seems there is no solid scientifi c evidence on that, it was assumed that the absolute contributions of kicking to total velocity might be even lower in children than in adult swimmers (~10–15 %). Therefore, the turbulent action of the water or kicking the cable and inducing data collection errors might be almost negligible for these young swimmers. During data collection an evaluator made a visual inspection of the curves being drawn in the software’s interface while the swimmer performed the bout. If some technical/methodological issue happened (e. g., bumping feet on the cable), evaluators asked the swimmers to repeat the bout once again.
Bio-signal was acquired on-line at a sampling rate of 50 Hz. A LabVIEW® (v. 2009) software interface was used to acquire, dis-play and process pair-wise velocity-time data on-line during the swim bouts. To transfer data from the speed-meter to the soft-ware application, a 12-bit resolution acquisition card (USB-6008, National Instruments, Austin, Texas, USA) was used as well. The integrated system (speed-meter plus software) was extensively described and validated for the dv with Doppler eff ect [ 10 ] and videometric system [ 11 ] . The same data collec-tion technique (e. g. [ 14 , 15 , 23 , 35 ] ) and even the commercial apparatus, specially the hardware, had already been used and reported in several other papers (e. g. [ 20 , 28 ] ).
the cut-off value was done according to residual analysis (resid-ual error vs. cut-off frequency). The hip’s dv was analyzed as [ 4 , 5 , 34 ] :
dv
(v v) F
n v F
n i
_
i i
i i
i
¦
¦
2100 ⭈
⭈ ⭈
(4)
where dv represents the intra-cyclic variation of the horizontal velocity of the hip, v represents the mean swimming velocity, v i represents the instant swimming velocity, F i represents the acquisition frequency and n is the number of observations. For further analysis the dv mean value of 3 consecutive stroke cycles between the 11 th m and 24 th m from the starting wall was con-sidered.
The hip’s dv it is not exactly the same as the centre of mass dv [ 3 , 16 , 26 ] . In spite of the same v-time graph profi le, there are 2 slight bias: (i) a temporal delay between major peaks in the anatomical landmark and the centre of mass of approximately 0.1 s (i. e., ~10 % of the stroke cycle duration); (ii) the v range is slightly higher for the hip than for the centre of mass in approxi-mately 0.2 m/s in front crawl and backstroke (i. e., ~10 % of the maximal velocity) and 0.4 m/s in butterfl y and breaststroke (i. e., ~15 % of the maximal velocity). The videometric system has some limitations, such as: (i) expensive apparatus to collect and process data; (ii) some errors due to data collection and bio-sig-nal processing and; (iii) methodological procedures are very time consuming. Those limitations are even higher when col-lecting data in an aquatic environment than in a terrestrial one. On the other hand, the speed-meter is more “coach-friendly” since it is an aff ordable piece of equipment, easy to operate allowing almost instant feed-back for swimmers. Considering the strong and weak points of each technique it seems that the speed-meter, although there is some slight bias, is an appropri-ate procedure to assess the swimmer’s kinematics. This is important when a large number of participants is assessed, reducing the time spend in data collection and data processing, which is relevant whenever convenience samples are selected, as in this research. Nevertheless, using the fi xed anatomical landmark as a measure, the associated errors should always be taken into consideration.
Statistical procedures
Normality was determined by the Shapiro-Wilk test. The homo-scedasticity assumption was checked with the Levene test. Box plots with quartile data from dv and v were calculated for each swimming technique, including mean values of 3 consecutive stroke cycles per swimmer. Mean ± 1 SD dv curves normalized to the stroke cycle duration were computed with MATLAB ® (v.7.11.0, MathWorks Inc., Massachusetts, USA) for each swim-ming technique.
Repeated measures (within-subjects ANOVA) analysis of the dv according to the swimming technique was performed. The repeated measures (within-subjects ANCOVA) interaction between the dv and the ∆v according to the swimming tech-nique (P ≤ 0.05) was assessed. For the ANCOVA, the ∆v was defi ned as being the swimming velocity amplitude (maximal velocity minus minimal velocity in the 4 bouts). ANOVA and ANCOVA repeated measures were followed by Bonferroni tests.
The level of statistical signifi cance was set at P ≤ 0.05. Eff ect size was computed based on Eta-squared (η2 ) procedure, and values interpreted as being: without eff ect if 0 < η2 ≤ 0.04; minimum if 0.04 < η2 ≤0.25; moderate if 0.25 < η2 ≤0.64 and; strong if η2 > 0.64.
Linear and polynomial regressions (2 nd and 3 rd power) between dv and v were computed and compared for each swimming tech-nique. For each case the mathematical model that presented the best goodness-of-fi t and the lowest standard error of the estima-tion was adopted. For all cases, polynomial regressions in 2 nd power were the selected ones. Reported were the fi t line equa-tions, the coeffi cients of determination (R 2 ), the adjusted coeffi -cients of determination (R 2 a ) and the standard errors of the estimation (s). The level of statistical signifi cance was set at P ≤ 0.05. As a rule of thumb, it was considered a: small eff ect size if 0 ≤ |r| ≤ 0.2; (ii) moderate eff ect size if 0.2 < |r| ≤ 0.5 and; (iii) strong eff ect size if |r| > 0.5.
Results
▼
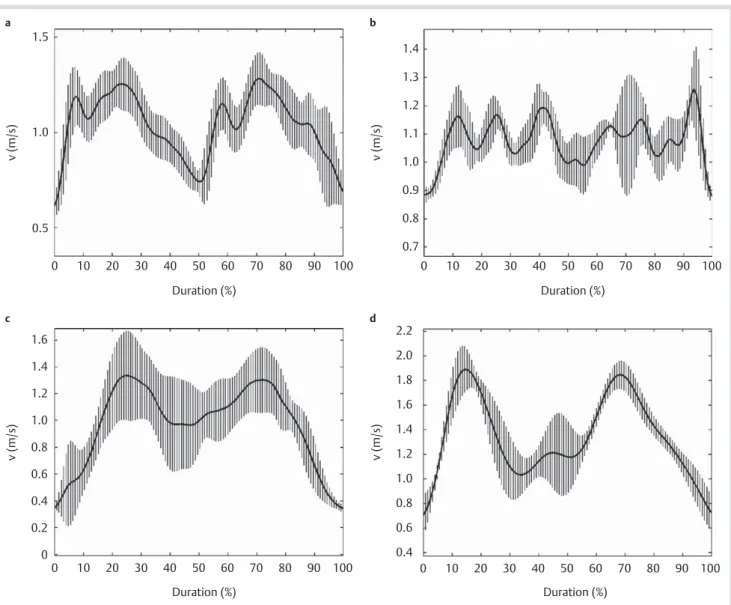
For qualitative assessment, ●▶ Fig. 1 presents the mean curves of dv normalized to the stroke cycle. In freestyle and backstroke dv was characterized by a multi-peak profi le. In breaststroke and butterfl y stroke dv was characterized by 2-peak and 3-peak pro-fi les, respectively.
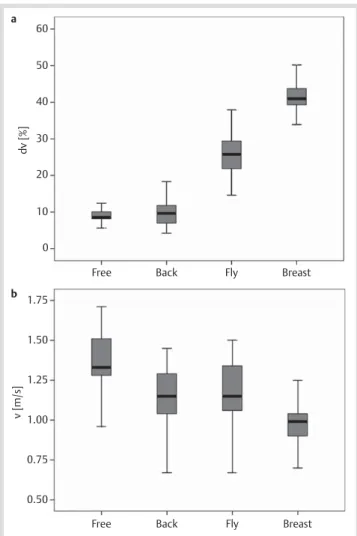
For quantitative assessment, ●▶ Fig. 2 presents the box plot of the dv ( ●▶ Fig. 2 , panel A) and the v ( ●▶ Fig. 2 , panel B). Within-subject test (ANOVA) presented meaningful variations in the dv based on the swimming technique [F(3,132) = 718.968; P < 0.001; η2 = 0.92]. Post-hoc test revealed signifi cant diff erences across all pair-wised swimming techniques (P < 0.001), except for the comparison between freestyle and backstroke (P = 0.98). The dv was higher in the breaststroke, followed by the butterfl y, the backstroke and the freestyle. Conversely, within-subject test with the ∆v as covariate (ANCOVA) presented non-signifi cant interaction in the dv with a moderate eff ect size [F(3,129) = 1.691; P = 0.95; η2 = 0.26].
●▶ Table 1 presents the fi t line equation for the dv-v relationship. The quadratic models were the ones with the best goodness-of-fi t and the lower error of estimation for all swimming techniques. All mathematical models were statistically signifi cant with a mode-rate-strong eff ect size (0.24 ≤ R 2 ≤ 0.51; 0.48 ≤ r ≤ 0.71). ●▶ Fig. 3 presents, for each one of the 4 swimming techniques, the dv-v relationship plus fi t line and 95 % confi dence interval.
Discussion
▼
and dv in comparison to the centre of mass kinematics (e. g., [ 3 , 16 , 26 ] ).
The fi xed point assessment can be made with mechanical tech-niques (e. g., cable or propeller based speed-meters and acceler-ometers), image-based techniques (e. g., image digitalization) and mixed ones (e. g. intermittent light-trace photography); while nowadays the centre of mass is mainly assessed with image-based techniques [ 34 ] . Within all the procedures availa-ble, the image-based techniques are often considered as the gold standard. Nevertheless, some weakness are apparent in the image-based techniques [ 34 ] : (i) digitalization process is very time-consuming: (ii) anthropometric biomechanical model used to compute the inter-limb inertial eff ects must be valid and accurate; (iii) it ignores the additional inertial eff ect of the added mass of water; (iv) it imposes several anatomical landmark ref-erence points to be digitized that are limited by images quality (e. g., distortions, water bubbles and waves, parallax errors); (v) the 2D or 3D kinematics assessment imply diff erent and com-plex procedures (e. g., hidden points, number of cameras, space references, calibration, coordinates and algorithm for 3D recon-struction); (vi) reduced interactivity with coaches and swim-mers to deliver information quickly. Some weaknesses of the
mechanical apparatus should be considered: (i) it only assesses an anatomical landmark; (ii) the mechanical connection to the subject might impose data bias (i. e., its consistency and the inca-pability to monitor the eff ective inertia of the swimmer’s body). On the other hand, main strengths of the mechanical velocime-try include: (i) it is an aff ordable technique; (ii) less time con-suming, allowing data collection for larger samples; (iii) it highly interactive, delivering quickly useful data to swimmers and coaches. So, considering a balance between strengths and weak-nesses of each method, the subjects’ characteristics and on the top of that the moderately large sample size adopted, the hip’s kinematics assessed with mechanical velocimetry seems to be a good solution.
Swimming is an aquatic locomotion technique based on periodic arms, legs and trunk actions leading to changes in the velocity within a stroke cycle:
ν = ν 0 + Δν ( t ) (5)
where v is the swimmer’s mean velocity, v 0 is the swimmer’s velocity at the beginning of the stroke cycle, ∆v is the variation of the swimming velocity throughout the stroke cycle and t is
Fig. 1 Mean ± 1 SD of the intra-cyclic variation of the horizontal velocity normalized to the stroke cycle duration in front crawl (panel a ), backstroke (panel b ),
breaststroke (panel c ) and butterfl y stroke (panel d ).
1.5
1.0
v (m/s) v (m/s)
v (m/s) v (m/s)
0.5
0.7 0.8 0.9 1.0 1.1 1.2 1.3 1.4
0
0 0.2
0.4 0.6 0.8 1.0 1.2 1.4 1.6 1.8 2.0 2.2
0.4 0.6 0.8 1.0 1.2 1.4 1.6
10 20 30 40 50
Duration (%)
60 70 80 90 100 0 10 20 30 40 50
Duration (%)
60 70 80 90 100
0 10 20 30 40 50
Duration (%)
60 70 80 90 100 0 10 20 30 40 50
Duration (%)
60 70 80 90 100
a b
the time. The dv , considering a given period of time, defi nes the swimmer’s acceleration and it is dependent upon the applied resultant force and the inertial term of the second Newton equation:
F = m · a (6)
Where F is the resultant force, m is the body mass and a is the acceleration. In competitive swimming the horizontal resultant force is the balance between propulsion and drag forces. The inertial term includes the swimmer’s body mass plus and some-times the added water mass. The body’s acceleration represents the dv . So, eq. 6 is developed as [ 34 ] :
Pr + D = (BM + m) · a (7) Where Pr is the total propulsive forces, D is the drag force, BM is the swimmer’s body mass, m a is the added water mass and a is
the swimmer’s acceleration (i. e., a = dv ). Re-arranging now eq. 7 towards the swimmer’s acceleration (i. e., dv ):
dv D
BM ma
= +
+
Pr
(8)
So, from a theoretical point of view, the dv represents a balance between propulsive and resistive forces, being an effi ciency esti-mator. Gaining both theoretical and experimental data about this topic is one of the most challenging and interesting projects in this scientifi c fi eld [ 34 ] . On a regular basis the energy cost it is reported as being related to mechanical, propulsive and overall effi ciency [ 9 ] . So, the energy cost it is an estimator of the move-ment effi ciency, where an increase of the fi rst means a decrease of the latter. Due to the complexity of assessing the effi ciency directly, researchers sometimes decided to estimate it through the energy cost of swimming. Not only theoretical research, as reported previously, but also experimental research demon-strated that a higher energy cost (i. e., lower effi ciency) is related to a higher dv in all swimming strokes. High variations on dv also impose a high energy cost, since extra energy must be delivered to overcome inertial forces [ 34 ] . Based on this, the dv is consid-ered as an informative kinematic variable to analyze the overall swimmers mechanics because it allows the [ 9 ] : (i) identifi cation of critical issues within the stroke cycle; (ii) collection of rele-vant data for practitioners and; (iii) the categorisation of the swimmer’s competitive level.
At freestyle and backstroke dv was characterized by a multi-peak profi le. These multi-peak profi les were similar to what was described for both techniques assessing a fi xed point [ 15 ] and the centre of mass [ 8 ] . 2 major peaks/curves were related to each arm’s actions and several small peaks due to the changes of pro-pulsive phases throughout the arm’s underwater path. The kick-ing action in front crawl and backstroke provides propulsion, as well as stabilization. These propulsive kick phases would likely show as several small peaks in velocity profi le trace. So, the small peaks might not just be from the arm action throughout the underwater stroke, but also from the leg kick action. In breaststroke and butterfl y strokes, dv was characterized by a 2-peak and a 3-peak profi le, respectively. At Breaststroke, one major peak is related to the arm’s action and the other one to the leg’s actions [ 8 , 15 ] . In the transition between arm’s and leg’s actions, the standard deviation increases. This can be related to another peak that some swimmers might do, as described else-where [ 21 ] . The variation in limb’s actions seems to be related to: (i) the added mass inertial eff ect during gliding [ 13 ] or, (ii) a lack of inter-limb coordination that imposes a signifi cant veloc-ity decrease [ 20 ] . In Butterfl y stroke, one major peak is related to the fi rst kick during arm’s entry [ 2 , 3 , 23 ] . The second peak is related to a more latero-medial component of the hand’s path, promoting an increased contribution from the insweep to pro-pulsion [ 2 , 3 ] . The third peak might be related to the upsweep movement of the arms combined with the second kick, before the arm’s exit [ 3 , 22 ] . Often in young swimmers, one of the 2 kicks per stroke cycle is not performed (either as the hands enter
Fig. 2 Quartile distribution of the intra-cyclic variation of the horizontal velocity (panel a ), and swimming velocity (panel b ) for the 4 swimming techniques.
60
50
40
30
20
10
0
1.75
1.50
1.25
1.00
0.75
v [m/s]
0.50
Free Back Fly Breast
Free Back Fly Breast
dv [%]
a
b
Equation R 2 R
a 2 P s
free dv = − 37.30 · v − 12.127 · v 2 + 36.923 0.35 0.32 < 0.001 2.267
back dv = − 19.062 · v + 4.088 · v 2 + 25.758 0.43 0.43 < 0.001 2.339
breast dv = − 72.576 · v + 31.922 · v 2 + 80.653 0.24 0.17 0.03 3.141
fl y dv = − 34.941 · v − 7.765 · v 2 + 55.607 0.51 0.49 < 0.001 4.011
or as they exit the water). All participants in this research were instructed in the training sessions to perform 2 kicks per stroke cycle on a daily basis. This seems to happen as the major peak occurs at the beginning of the stroke cycle (arm’s entry plus fi rst kick) and at the end of it (upsweep and arm’s exit plus second kick).
There were signifi cant dv diff erences across almost all pair-wised swimming techniques. The dv presented the highest value in the breaststroke, then in the butterfl y, in the backstroke and fi nally in the freestyle, respectively. Similar data was presented with adult/elite swimmers [ 14 ] . However, in this case, an inter-subject comparison was performed where the backstroke pre-sented a lower dv than the freestyle. Since all the swimmers did not perform the 4 swimming techniques during data collection, probably there were diff erences in the competitive level of each cohort group leading to these results. It seems there is a path-fl ow between the swimmer’s energetics, kinematical and kinetic profi le. The swimmer’s energetics depend on his/her kinematic behaviour and this depends on the kinetics [ 9 ] . Some papers demonstrated that when comparing energetics, kinematics and kinetics of the 4 swimming techniques all of these follow more or less the same pattern. The energy expenditure [ 6 ] , the teth-ered swimming force [ 24 ] and the intra-cyclic mechanical
impulse [ 1 , 2 , 32 , 33 ] are higher in breaststroke, thereafter in butterfl y, backstroke and freestyle in this order. These data sug-gest that actually there might be relationships among the swim-mers’ energetics, kinematics and kinetics profi les. Probably, swimming techniques producing higher forces (at least when tethered) impose a higher intra-cyclic mechanical impulse, dv and energy expenditure. Some partial relationships between these variables were already reported, e. g., the energy expendi-ture versus dv relationship [ 4 , 5 ] . However, to the best of our knowledge a research relating to all of them in a single research paper has not been published up to now.
The quadratic models were the ones with the best goodness-of-fi t and the lowest error of estimation for all swimming tech-niques. As for land-based locomotion techniques, the dv-v relationship is described as being non-linear [ 22 ] . Walkers and runners have a self-selected velocity in which there is a lower dv and probably a lower energy cost [ 12 ] . Although in land-based locomotion techniques there is some discussion between 2 main theories explaining gait (inverted pendulum vs. 6 determinants of gait) both of them aim to understand how walkers increase their movement effi ciency. Inverted pendulum theory is related to conservation of the mechanical energy [ 19 ] . It suggests that to cost less energy, stance leg has to act like an inverted pendulum
18.00
a
c
b
d
16.00
14.00
12.00
10.00
8.00
6.00
4.00
0.80 1.00 1.20 1.40
v Free [m/s]
dv Free [%]
dv Breast [%]
v Back [m/s]
dv Back [%]
1.60 1.80 0.60
15.00 20.00
10.00
5.00
40.00
50.00
45.00
40.00
35.00
35.00
30.00
25.00
20.00
15.00
10.00
0.60
0.60 0.70 1.00 1.10 1.20 1.30
v Breast [m/s] v Fly [m/s]
dv Fly [%]
0.90
0.80 0.80 1.00 1.20 1.40 1.60
0.80 1.00 1.20 1.40
Fig. 3 Scattergram plus fi t line and 95 % confi dence interval of the relationship between the intra-cyclic variation of the horizontal velocity (dv) and the
References
1 Alves F . Average resultant impulse per phase in swimming: a tool for technical analysis . In: Abrantes J ( ed ). Proceedings of the XIV Inter-national Symposium on Biomechanics in Sports . Lisbon : Faculty of Human Movement , 1996 ; 281 – 284
2 Barbosa T , Santos Silva J , Sousa F , Vilas-Boas J P . Measurement of but-terfl y average resultant impulse per phase . In: Ginaikellis K ( ed ). Proceedings of the XXth International Symposium on Biomechanics in Sports . Cáceres : University of Extremadura , 2002 ; 35 – 38 3 Barbosa T , Santos Silva J V , Sousa F , Vilas-Boas J P . Comparative study of
the response of kinematical variables from the hip and the center of mass in butterfl iers . In: Chatard J C ( ed ). Biomechanics and Medicine in Swimming IX . St Etienne : University of St Etienne Publications , 2003 ; 93 – 98
4 Barbosa T M , Keskinen K L , Fernandes R J , Colaço P C , Lima A B , Vilas-Boas J P . Energy cost and intra-cyclic variations of the velocity of the centre of mass in butterfl y stroke . Eur J Appl Physiol 2005 ; 93 : 519 – 523 5 Barbosa T M , Lima F , Portela A , Novais D , Machado L , Colaço P , Gonçalves
P , Fernandes R , Keskinen K , Vilas-Boas J P . Relationships between energy cost, swimming velocity and speed fl uctuation in competi-tive swimming strokes . In Vilas- Boas J P , Alves F , Marques A ( eds. ). Biomechanics and Medicine in Swimming X Porto: Port J Sports Sci . 2006 ; a 192 – 194
6 Barbosa T M , Fernandes R J , Keskinen K L , Colaço P C , Cardoso C , Silva J ,
Vilas-Boas J P . Evaluation of the energy expenditure in competitive swimming strokes . Int J Sports Med 2006 ; 27 : 894 – 899
7 Barbosa T M , Fernandes R J , Keskinen K L , Vilas-Boas J P . The infl uence of stroke mechanics into energy cost of elite swimmers . Eur J Appl Physiol 2008 ; 103 : 139 – 149
8 Barbosa T M , Silva A J , Reis A M , Costa M J , Garrido ND , Policarpo F B , Reis VM. Kinematical constrictions swimming front crawl and breast-stroke with the Aquatrainer ® snorkel . Eur J Appl Physiol 2010 ; 109 : 1155 – 1162
9 Barbosa T M , Bragada J A , Reis VM , Marinho D A , Carvalho C , Silva A J . Energetics and biomechanics as determining factors of swimming performance: updating the state of the art . J Sci Med Sports 2010 ; b 13 : 262 – 269
10 Barbosa T M , Costa M J , Morais J E , Jesus S , Marques M C , Batista J ,
Gonçalves J . Conception, development and validation of a software interface to assess human’s horizontal intra-cyclic velocity with a mechanical speedo-meter . In: Siny Jan S , Feipel V , Aerenhout D , Baey-ens J P , Carpentier A , Cattrysse E , Clarys J P , Duchateau J , Guissard N , Leloup T , Provyn S , Rooze M , Scafoglieri A , Schuind F , Roy P V , Warzée N ( eds. ). Proceedings of the XXIIIrd Congress of the International Society of Biomechanics. Brussels: Université Libre de Brussels & Université D´Europe . Brussels : 2011 a; 217
11 Barbosa T M , Costa M J , Morais J E , Jesus S , Silva A J , Batista J , Gonçalves J . Validation of an integrated system to assess horizontal intra-cyclic velocity with a mechanical speedo-meter . In: Vilas-Boas J P , Machado L , Kim W , Veloso A P ( eds. ). Biomechanics in Sports 29 . Porto : Port J Sports Sci , 2011 ; b 833 – 835
12 Cavanagh P , Kram R . The effi ciency of human movement – a statement of the problem . Med Sci Sports Exerc 1985 ; 17 : 304 – 308
13 Colman V , Persyn U , Ungerechts B . A mass of water added to the swim-mer’s mass to estimate the velocity in dolphin-like swimming below the water surface . In: Keskinen K L , Komi P V , Hollander A P ( eds ). Bio-mechanics and Medicine in Swimming VIII . Jyvaskyla : Gummerus Printing , 1999 ; 89 – 94
14 Craig A B , Pendergast D R . Relationships of stroke rate, distance per stroke, and velocity in competitive swimming . Med Sci Sports Exerc 1979 ; 11 : 278 – 283
15 Craig A B , Termin B , Pendergast D R . Simultaneous recordings of veloc-ity and video during swimming . In: Vilas- Boas J P , Alves F , Marques A ( eds. ). Biomechanics and Medicine in Swimming X . Porto : Port J Sports Sci , 2006 ; 32 – 35
16 Figueiredo P , Vilas-Boas J P , Maia J , Gonçalves P , Fernandes R J . Does the hip refl ect the centre of mass swimming kinematics? Int J Sports Med 2009 ; 30 : 779 – 781
17 Harriss D J , Atkinson G . Update – ethical standards in sport and exercise science research . Int J Sports Med 2011 ; 32 : 819 – 821
18 Hay J , Guimarães A . A quantitative look at swimming biomechanics . Swim Techn 1983 ; 20 : 11 – 17
19 Kuo A . The six determinants of gait and the inverted pendulum anal-ogy: a dynamic walking perspective . Hum Mov Sci 2007 ; 26 : 617 – 656 20 Leblanc H , Seifert L , Tourny-Chollet C , Chollet D . Intra-cyclic distance per stroke phase, velocity fl uctuation and acceleration time ratio of a breaststroker’s hip: a comparison between elite and non-elite swim-mers at diff erent race paces . Int J Sports Med 2007 ; 28 : 140 – 147 and describe such an arc. Conversely, the 6 determinants of gait
theory [ 19 ] propose that the pelvis rotation, the pelvis oscilla-tion, the knee fl exion at the support phase, the foot mechanics, the knee mechanics and the lateral displacing of the pelvis can reduce the displacement of the centre of mass and therefore improve gait effi ciency [ 19 ] . It is acceptable for 2 theories to dif-fer, but they serve the same goal of reducing the energy cost in an opposing rather than complementary fashion. Although gait and swimming are not the same kind of locomotion actions, it seems that the 6 determinants theory is not only valid for gait but also for dv in swimming. Both theories are based on the premise that vertical and horizontal centre of mass displace-ments/velocity cost energy.
In all 4 swimming techniques, the increases of the v lead to a decrease of the dv . This type of dv-v relationship was already reported once for elite swimmers in a 2D centre of mass kine-matics study [ 5 ] , although another study did not verify this in a 3D centre of mass kinematics study [ 27 ] . In the paper by Barbosa et al. [ 5 ] an inter-subject instead of a within-subject assessment was carried out. Probably Psycharakis et al. [ 27 ] did not fi nd any relationship because an assessment was made in a much lower range of velocities than in this research and that of Barbosa et al. [ 5 ] . This might suggest that dv it is not sensitive to very small changes in the v as happens from lap to lap throughout a short distance event such as the 200-m freestyle. On the other hand, Barbosa et al. [ 5 ] established such a relationship in a wider range of swimming velocities. Swimmers made a set of 7 bouts ranging from low to maximal velocities, which increased the range of velocities assessed.
Coaches training young swimmers should spend a large part of the training sessions presenting technique drills and giving feed-backs about the swimmer’s technique instead of focusing on heavy physical conditioning. According to swimming perio-dization programs and career plans, the main goal of training programs for young swimmers (aged between approximately 12–14 years) must be to improve their technical ability in all 4 swimming techniques. The main trend of this research was that swimmers able to achieve a higher v , seem to have a lower dv . Thus, a training session should be focused on technical drills to improve technique (i. e., increase swimming effi ciency and reduce dv at maximal pace).
In summary, in the 4 swimming techniques, there is a non-linear dv-v relationship. Swimmers, as walkers and runners, have a non-linear relationship where the increase of the velocity leads to a decrease of the dv and probably a lower energy cost, since these last 2 variables are also linked.
Affi liations
1 IPB, Sport Sciences, Bragança, Portugal
2 Research Center for Human Movement Sciences, Polytechnic Institute of
Leiria, Leiria, Portugal
3 Sport Sciences, Polytechnic Institute of Bragança/CIDESD, Bragança,
Portugal
4 Sport Sciences, University of Ceará, Fortaleza, Brazil
5 Departement of Sport Sciences, Polytechnic Institute of Bragança, Bragança,
Portugal
6 Sport Sciences, UBI, Covilhã, Portugal
7 Exercise and Health Sciences Department, University of Trás-os-Montes and
30 Takagi H , Sugimoto S , Nishijima N , Wilson B . Diff erences in stroke phases, arm-leg coordination and velocity fl uctuation due to event, gender and performance level in breaststroke . Sports Biomech 2004 ; 3 : 15 – 27
31 Togashi T , Nomura T . A biomechanical analysis of the swimmer using the butterfl y stroke . In: MacLaren D , Reilly T , Lees A ( eds. ). Biome-chanics and Medicine in Swimming VI . London : E & FN Spon , 1992 ; 87 – 91
32 van Tilborgh L , Willems E , Persyn U . Estimation of breaststroke pro-pulsion and resistance-resultant impulses from fi lm analyses . In: Ungerechts B , Wilke K , Reischle K ( eds. ). Swimming Science V . Illi-nois : Human Kinetics Books , 1988 ; 67 – 71
33 Vilas-Boas J P , Santos P . Comparison of swimming economy in three breaststroke techniques . In: Miyashita M , Mutoh Y , Richardson A ( eds. ). Medicine and Science in Aquatic Sports . Bassel : Karger , 1994 ; 48 – 54 34 Vilas-Boas J P , Barbosa T M , Fernandes R J . Speed fl uctuation, swim-ming economy, performance and training in swimswim-ming . In: Seifert L , Chollet D , Mujika I ( eds. ). World Book of Swimming: From Science to Performance . New York : Nova Science Publishers , 2010 ; 119 – 134 35 Vilas-Boas J P , Costa L , Fernandes R J , Ribeiro J , Figueiredo P , Marinho
D A , Silva A J , Rouboa A , Machado L . Determination of the drag coeffi -cient during the fi rst and second gliding positions of the breaststroke underwater stroke . J Appl Biomech 2010 ; 26 : 324 – 331
21 Manley P , Atha J . Intra-stroke velocity fl uctuations in paces breast-stroke swimming . In: MacLaren D , Reilly T , Lees A ( eds. ). Biome-chanics and Medicine in Swimming VI . London : E & FN Spon , 1992 ; 151 – 160
22 Minetti A . The three modes of terrestrial locomotion . In: Nigg B , Mac-Intosh B , Mester J ( eds. ). Biomechanics and Biology of Movement . Illinois : Human Kinetics , 2000 ; 67 – 78
23 Morouço P , Lima A B , Semblano P , Fernandes D , Gonçalves P , Sousa F ,
Fernandes R J , Barbosa T M , Correia M V , Vilas-Boas J P . Validation of a cable speedometer for butterfl y evaluation . In: Vilas- Boas J P , Alves F , Marques A ( eds. ). Biomechanics and Medicine in Swimming X . Porto : Port J Sports Sci , 2006 ; 236 – 238
24 Morouço P , Keskinen K L , Vilas-Boas J P , Fernandes R J . Relationship between tethered forces and the four swimming techniques perform-ance . J Appl Biomech 2011 ; 27 : 161 – 169
25 Nigg B . Selected methodology in biomechanics with respect to swim-ming . In: Hollander A P , Huijing P A , de Groot G 9 ( eds. ). Biomechanics and Medicine in Swimming IV . Champaign, Illinois : Human Kinetics , 1983 ; 72 – 80
26 Psycharakis S G , Sanders R H . Validity of the use of a fi xed point for intracycle velocity calculations in swimming . J Sci Med Sports 2009 ; 12 : 262 – 265
27 Psycharakis S , Naemi R , Connaboy C , McCabe C , Sanders R H . Three-dimensional analysis of intracycle velocity fl uctuations in front-crawl swimming . Scand J Med Sci Sports 2010 ; 20 : 128 – 135
28 Schnitzler C , Seifert L , Ernwein V , Chollet D . Arm coordination adapta-tions assessment in swimming . Int J Sports Med 2008 ; 29 : 480 – 486 29 Seifert L , Toussaint H , Schnitzler C , Alberty M , Chavallard F , Lemaitre F ,