Christine Luz Antunes
Licenciada em Ciências da Engenharia Química e Bioquímica
Adsorbent Particle Design
for Application in Gas Adsorption Processes
Dissertação para obtenção do Grau de Mestre em
Engenharia Química e Bioquímica
Orientadora: Isabel A.A.C. Esteves, Investigadora Auxiliar, FCT/UNL, LAQV-Requimte
Co-orientadores: Rui P.P.L. Ribeiro, Investigador Pós-Doutoramento, FCT/UNL, LAQV-Requimte
José P.B. Mota, Professor Catedrático, FCT/UNL, LAQV-Requimte
Júri
Presidente: Mário F.J. Eusébio Arguente: Ricardo J.S. Silva
Adsorbent Particle Design
for Application in Gas Adsorption Processes
Copyright © Christine Luz Antunes, Faculdade de Ciências e Tecnologia, Universidade NOVA de Lisboa.
A Faculdade de Ciências e Tecnologia e a Universidade NOVA de Lisboa têm o direito, perpétuo e sem limites geográficos, de arquivar e publicar esta dissertação através de exemplares impressos reproduzidos em papel ou de forma digital, ou por qualquer outro meio conhecido ou que venha a ser inventado, e de a divulgar através de repositórios científicos e de admitir a sua cópia e distribuição com objetivos educacionais ou de inves-tigação, não comerciais, desde que seja dado crédito ao autor e editor.
Este documento foi gerado utilizando o processador (pdf)LATEX, com base no template “unlthesis” [1] desenvolvido no Dep. Informática da FCT-NOVA [2].
A c k n o w l e d g e m e n t s
Quero agradecer à Professora Dr.ª Isabel Esteves e ao Dr. Rui Ribeiro por todo o apoio e orientação que me deram ao longo de todo este processo. Durante estes últimos seis meses a realizar esta dissertação mostraram-se sempre disponíveis e deram-me um apoio único ao ensinar-me e a motivar-me para desenvolver da melhor forma este trabalho. Também gostaria de agradecer ao Professor Dr. José Mota pelo o seu apoio e motivação que sempre me demonstrou ao longo do curso e durante a realização deste trabalho.
Um agradecimento especial à Aiala Garate que trabalhou e colaborou comigo e espe-cialmente pela sua amizade.
Tenho também que agradecer à Faculdade de Ciências e Tecnologias da Universidade Nova de Lisboa por me ter proporcionado as melhores condições de ensino e de trabalho nos últimos anos.
Aos meus pais, por acreditarem em mim desde de sempre, por me motivarem e me terem ajudado a ser a pessoa que sou hoje. Sem eles não estaria neste momento a con-cretizar um dos meus maiores desafios. A toda a minha família e em particular à minha irmã Laurie, por me terem apoiado sempre.
A ti Luis Reis, tiveste sempre ao meu lado nestes últimos anos e tens sido o meu pilar. Obrigado pela tua paciência e por todo o teu amor.
A b s t r a c t
Metal-organic frameworks (MOFs) are novel materials that are showing great po-tential for different applications and in particular for gas adsorption-based separation
processes. MOFs have been subject to a growing scientific interest due to their particular framework versatility and also because they have higher porosity and surface areas in comparison to other traditional adsorbents. Since these materials are relatively new, they are still only mostly studied in their primary powder form. To further study the feasibility of application of MOFs in gas adsorption processes such as Pressure Swing Adsorption (PSA), these must be shaped into body like forms, such as pellets or extrudates.
One particular MOF, aluminum terephthalate (MIL-53(Al)) has a very high surface area with a great capacity to adsorb a large amount of gases such as carbon dioxide (CO2). Due to its characteristics there is interest in further studying this material in gas adsorption processes. Therefore, the objective of this work is to shape MIL-53(Al) with different techniques and study the characteristics of the formulated particles.
MIL-53(Al) was shaped using two different methods: compression without a binder
(binderless) and extrusion with a binder. The binderless method resulted in two sam-ples, one with a 1ton-force compression and another with a 0.5ton-force compression. Polyvinyl alcohol (PVA) was used as a binder to shape four samples with percentages of binder between 2% and 15%. The obtained shaped materials were characterized using several mechanical, structural and physico-chemical techniques. Furthermore, CO2 ad-sorption equilibria measurements were performed to understand the adad-sorption capacity of shaped MIL-53(Al) and compared it to its primary powder form. The shaped mate-rials with the best characteristics to be used in CO2gas adsorption processes were the binderless sample of 0.5ton-force compression and the sample with 5% of PVA binder. Overall, both methods show good potential in shaping MIL-53(Al) and may be a good fit for future scale-up studies.
R e s u m o
Os adsorventes orgâno-metálicos, mais conhecidos como Metal-organic frameworks
(MOFs) em terminologia inglesa, são materiais recentes que têm vindo a demonstrar grande potencial para diferentes aplicações, em particular para processos de separação e purificação por adsorção gasosa. Os MOFs têm sido alvo de um crescente interesse pela comunidade cientifica devido às suas características particulares, possuindo uma estrutura flexível, adaptável à aplicação desejada e também elevadas porosidades e área superficial, quando comparadas com outros adsorventes tradicionais. Em geral, os MOFs são produzidos em pó, sendo maioritariamente estudados nesta forma. No entanto, para estes materiais serem aplicados em processos de separação de gases, como o comum em
Pressure Swing Adsorption(PSA) em terminologia inglesa, têm que ser moldados numa
forma mais compacta de maior dimensão, seja sob a forma de grânulos, esferas ou peletes cilíndricas, habitualmente por via da compressão ou extrusão.
Um MOF em particular, o tereftalato de alumínio MIL-53(Al), tem uma área superfi-cial e uma capacidade grandes para adsorver quantidades significativas de gases como o dióxido de carbono (CO2). Assim, devido às suas características, existe interesse em estudar este material em processos de adsorção gasosa. Portanto, chega-se ao objectivo principal deste trabalho, onde se pretende dar forma ao MIL-53(Al), explorando diferentes técnicas, caracterizando-se as partículas formuladas, e analisando-se a sua performance face à adsorção de gases de interesse ambiental.
O MIL-53(Al) foi formulado através de dois metodos diferentes: compressão sem um
binder(um agente ligante) e extrusão com umbinder. A partir do método sembinderfoi
obtido duas amostras com forças de compressão differentes,nomeadamente, 1ton-força e 0.5ton-força. Obinderusado para a extrusão foi o polivinil álcool (PVA),sendo obtidas
quarto amostras, com percentagens debinder entre 2% e 15% em massa. Os materiais
uma compressão de 0.5ton-força e a amostra com 5% de PVAbinder. Em geral, ambos os métodos mostram potencial para dar forma ao MIL-53(Al), e poderão vir a ser uma solução para futuros estudos de scale-up.
C o n t e n t s
List of Figures xv
List of Tables xix
Acronyms xxi
1 Introduction 1
1.1 Motivation . . . 1
1.2 Structure of the Dissertation . . . 3
2 Theoretical Background 5 2.1 Adsorption Phenomena . . . 5
2.2 Adsorbents . . . 8
2.2.1 Metal Organic Frameworks . . . 9
2.3 Shaping Techniques for Gas Adsorption Applications . . . 11
2.3.1 Binderless Shaping . . . 13
2.3.2 Shaping with Binder . . . 13
2.4 Characterization of Shaped Adsorbents . . . 14
2.4.1 Mechanical Characterization . . . 14
2.4.2 Structural and Physico-chemical Characterization . . . 15
2.4.3 Adsorption Equilibrium Measurement Techniques . . . 15
3 Methodologies and Experimental Work 17 3.1 MIL-53(Al) Shaping . . . 17
3.1.1 Binderless Shaping . . . 18
3.1.2 Shaping with Binder . . . 19
3.2 Characterization of Shaped MIL-53(Al) . . . 22
3.2.1 Mechanical Characterization of Samples . . . 22
3.2.2 Structural and Physico-chemical Characterization of Samples . . . 25
3.2.3 Adsorption Equilibria . . . 26
4 Experimental Results and Discussion 31 4.1 Shaping MIL-53(Al) . . . 31
CO N T E N T S
4.1.2 Shaping with Binder . . . 32
4.2 Characterization of Shaped MIL-53(Al) . . . 34
4.2.1 Mechanical Characterization of Samples . . . 34
4.2.2 Structural and Physico-chemical Characterization of Samples . . . 36
4.2.3 Adsorption Equilibrium Experiments . . . 40
5 Conclusions and Future Work 45 5.1 Conclusions . . . 45
5.2 Future Work . . . 46
Bibliography 49 A Appendix 57 A.1 Drop Test Results . . . 57
A.2 X-Ray Diffraction (XRD) Results . . . 59
A.3 Thermogravimetric Analysis (TGA) Results . . . 61
A.4 Calibration of the volumetric unit . . . 67
A.5 Adsorption Equilibria Measurements . . . 68
L i s t o f F i g u r e s
2.1 IUPAC classification of physisorption isotherms [33]. . . 7
2.2 Representation of the general classification of porous solids [28]. . . 10
2.3 Representation of the metastable large pore (lp) and narrow pore (np) struc-tures of the MIL-53(Al) material, as a 2 × 2 × 2 supercell viewed along the axis of the unidimensional channel [45]. . . 11
2.4 Representation of an extrusion method. . . 12
2.5 Representation of a dry pressing method. . . 12
3.1 Manual hydraulic press and pellet die. . . 18
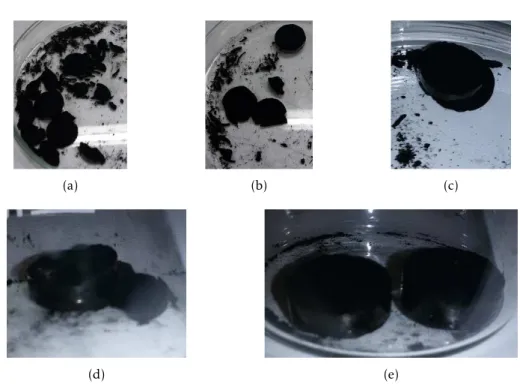
3.2 Activated Carbon Binderless Disks: (a) Batch Y1 & Y2; (b) Batch Y3 & Y4; (c) Batch Y5; (d) Batch Y6; (d) Batch Y7 & Y8. . . 19
3.3 Activated Charcoal with PVA Binder: (a) Batch Z1; (b) Batch Z2. . . 21
3.4 (a) Example of a MIL-53(Al)-PVA Mixture; (b) 5ml Syringe used for Extrusion. 22 3.5 (a) Apparatus used for the pressure/depressurization test unit; (b) Column used for the tests. . . 23
3.6 Schematic diagram of the pressure test unit. PT and V denote pressure trans-ducer and valves respectively. . . 24
3.7 Ballmill apparatus used in the abrasion tests. . . 24
3.8 Drop Test Apparatus. . . 25
3.9 (a) General view of the volumetric unit.; (b) Detailed view of the main tubing and valves of the volumetric unit. . . 26
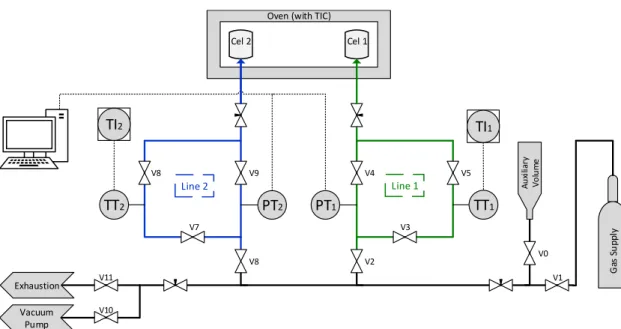
3.10 Schematic diagram of volumetric unit. The green section represents line 1; the blue section represents line 2; PT, TT and TI denote pressure transducers, temperature sensor and temperature indicator respectively; V represents the valves. . . 27
3.11 (a) New cells used in the volumetric unit.; (b) Example of a cell with shaped MIL-53(Al) inside. . . 28
4.1 MIL-53(Al) Binderless Samples: (a) Batch A1; (b) Batch A2. . . 32
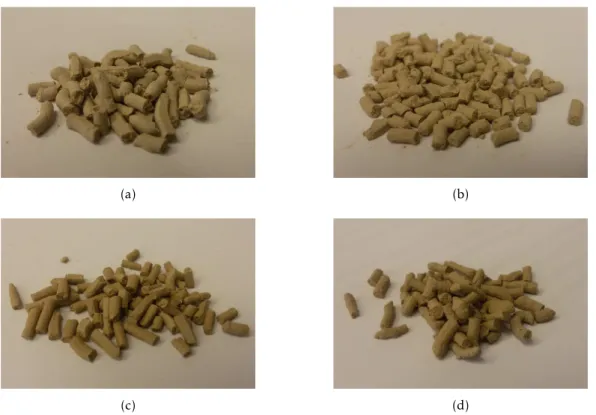
4.2 Example of a batch (B4) that was not possible to extrudate into pellet like shapes. . . 33 4.3 Selected MIL-53(Al)-PVA Dried Batches: (a) Batch B1 (with 2% PVA); (b) Batch
L i s t o f Fi g u r e s
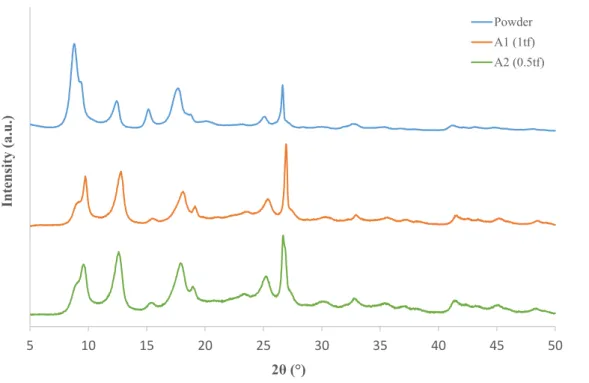
4.4 Experimental XRD paterns of MIL-53(Al) powder and binderless samples A1
and A2. . . 37
4.5 TGA of samples B1 (with 2% binder), B3 (with 5% binder), B5 (with 10% binder) and B7 (with 15% binder). . . 38
4.6 TGA of samples B1 (with 2% binder), B3 (with 5% binder), B5 (with 10% binder) and B7 (with 15% binder) between 300K and 460K. . . 39
4.7 TGA of pure PVA (Mowiol® 10-98). . . 39
4.8 Net adsorption equilibrium isotherms of CO2at 30ºC on the MIL-53(Al) pow-der, sample A1 (binderless MIL-53(Al) pellets compressed at 1tf) and sample A2 (binderless MIL-53(Al) pellets compressed at 0.5tf). Closed symbols denote adsorption data and open symbols denote desorption data. Lines are drawn as a guide to the eye. . . 41
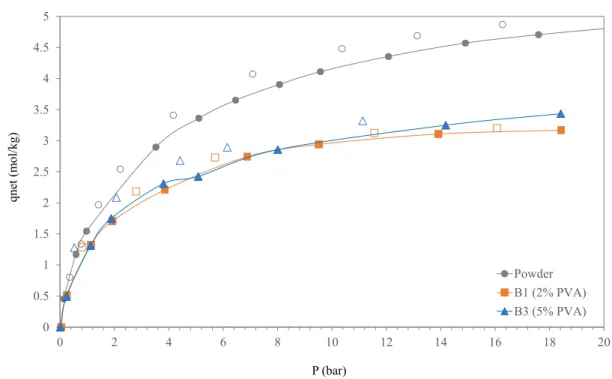
4.9 Net adsorption equilibrium isotherms of CO2at 30ºC on the MIL-53(Al) pow-der, sample B1 (MIL-53(Al) with 2% PVA binder) and sample B3 (MIL-53(Al) with 5% PVA binder). Closed symbols denote adsorption data and open sym-bols denote desorption data. Lines are drawn as a guide to the eye. . . 42
4.10 Net adsorption equilibrium isotherms of CO2at 30ºC on the MIL-53(Al) pow-der, sample B5 (MIL-53(Al) with 10% PVA binder) and sample B7 (MIL-53(Al) with 15% PVA binder). Closed symbols denote adsorption data and open symbols denote desorption data. Lines are drawn as a guide to the eye. . . . 42
4.11 Net adsorption equilibrium isotherms of CO2at 30ºC on the MIL-53(Al) pow-der, sample A2 (binderless MIL-53(Al) pellets compressed at 0.5tf), sample B1 (MIL-53(Al) with 2% PVA binder) and sample B3 (MIL-53(Al) with 5% PVA binder). Closed symbols denote adsorption data and open symbols denote desorption data. Lines are drawn as a guide to the eye. . . 43
A.1 Experimental XRD pattern of MIL-53(Al) powder. . . 59
A.2 Experimental XRD pattern of sample A1 compressed at 1tf. . . 60
A.3 Experimental XRD pattern of sample A1 compressed at 0.5tf. . . 61
A.4 TGA of sample B1 with 2% PVA binder. . . 62
A.5 TGA of sample B3 with 5% PVA binder. . . 62
A.6 TGA of sample B5 with 10% PVA binder. . . 63
A.7 TGA of sample B1 with 15% PVA binder. . . 63
A.8 TGA of sample B1 with 2% PVA binder at a 473K constant temperature. . . . 64
A.9 TGA of sample B3 with 5% PVA binder at a 473K constant temperature. . . . 64
A.10 TGA of sample B5 with 10% PVA binder at a 473K constant temperature. . . 65
A.11 TGA of sample B7 with 15% PVA binder at a 473K constant temperature. . . 65
A.12 TGA of pure PVA (Mowiol® 10-98) at a 473K constant temperature. . . 66
L i s t o f Fi g u r e s
A.14 Net adsorption equilibrium isotherms of CO2at 30ºC on the sample A2 (binder-less MIL-53(Al) pellets compressed at 0.5tf) Closed symbols denote adsorption data and open symbols denote desorption data. . . 75 A.15 Net adsorption equilibrium isotherms of CO2at 30ºC on the sample B1
(MIL-53(Al) with 2% PVA binder). Closed symbols denote adsorption data and open symbols denote desorption data. . . 76 A.16 Net adsorption equilibrium isotherms of CO2at 30ºC on the sample B3
(MIL-53(Al) with 5% PVA binder). Closed symbols denote adsorption data and open symbols denote desorption data. . . 76 A.17 Net adsorption equilibrium isotherms of CO2at 30ºC on the sample B5
(MIL-53(Al) with 10% PVA binder). Closed symbols denote adsorption data and open symbols denote desorption data. . . 77 A.18 Net adsorption equilibrium isotherms of CO2at 30ºC on the sample B7
L i s t o f Ta b l e s
2.1 Classification of pore sizes by IUPAC [36]. . . 9
3.1 Binderless Activated Charcoal Pellets Samples and Results. . . 19
3.2 Binderless MIL-53(Al) Samples. . . 19
3.3 PVA Solutions Prepared. . . 20
3.4 Activated Charcoal-PVA Mixtures and Observations. . . 21
3.5 MIL-53(Al)-PVA Mixtures and Samples. . . 22
3.6 Reference and cell volumes of the volumetic unit. . . 28
4.1 Binderless MIL-53(Al) Samples and Observations. . . 32
4.2 MIL-53(Al)-PVA Extruded Samples and Observations. . . 33
4.3 Pressure/Depressurization Test Results of Binderless Samples . . . 35
4.4 Pressure/Depressurization Test Results of Samples with Binder . . . 35
4.5 Abrasion Test Results . . . 36
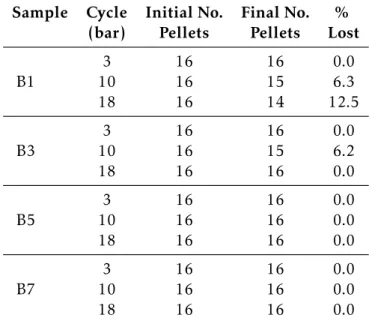
4.6 Drop Test Results . . . 36
4.7 He Pycnometry Results for the Binderless Samples and MIL-53(Al) powder. . 40
A.1 Results of the drop tests on the samples containing binder: Batch B1 (2% PVA binder), Batch B1 (5% PVA binder), Batch B1 (10% PVA binder) and Batch B7 (15% PVA binder) . . . 58
A.2 Crystallographic unit cell parameters obtained for MIL-53(Al) powder. . . . 61
A.3 Experimental results for the calibration of Vcell1. . . 68
A.4 Experimental results for the calibration of the volume Vcell2. . . 68
A.5 Calculated results of the cell volumes using equation A.3. . . 68
A.6 Samples Packed in the Volumetric Unit . . . 70
A.7 CO2adsorption equilibria measurements at 30ºC for sample A1 compressed at 1tf (Run 1). . . 70
A.8 CO2adsorption equilibria measurements at 30ºC for sample A2 compressed at 0.5tf (Run 1). . . 71
A.9 CO2adsorption equilibria measurements at 30ºC for sample A2 compressed at 0.5tf (Run 2). . . 71
L i s t o f T a b l e s
A.11 CO2 adsorption equilibria measurements at 30ºC for sample B3 containing 5% PVA binder (Run 1). . . 72 A.12 CO2 adsorption equilibria measurements at 30ºC for sample B3 containing
5% PVA binder (Run 2). . . 73 A.13 CO2 adsorption equilibria measurements at 30ºC for sample B5 containing
10% PVA binder (Run 1). . . 73 A.14 CO2 adsorption equilibria measurements at 30ºC for sample B7 containing
15% PVA binder (Run 1). . . 74 A.15 CO2 adsorption equilibria measurements at 30ºC for sample B7 containing
A c r o n y m s
This list of acronyms only specifies the most important ones
CCS Carbon Capture and Storage.
ESA Electric Swing Adsorption.
GHGs Greenhouse Gases.
lp large pore.
MIL Materials Institute Lavoisier.
MOF Metal Organic Framework.
np narrow pore.
PSA Pressure Swing Adsorption.
PVA polyvinyl alcohol.
TGA Thermogravimetric Analysis.
TSA Temperature Swing Adsorption.
C
h
a
p
t
e
r
1
I n t r o d u c t i o n
1.1 Motivation
Over the last decades global warming and climate change have been environmental is-sues with a growing concern. Today due to great scientific evidence it has been confirmed that greenhouse gases (GHGs) are the main cause for the rise of the mean global tem-perature [1, 2, 3]. This temtem-perature will lead to global climate changes with irreversible consequences on the environment and world economy [2, 4]. Therefore, it is necessary to significantly cut and mitigate greenhouse emissions.
In December 2015, the international community composed by more than 185 coun-tries agreed on a new global climate change agreement (Paris Agreement), with main goal of keeping the mean global temperature rise below 2ºC (above pre-industrial levels)[1, 5]. This commitment had already been taken by the European Union (EU) and is a part of the EU’s Europe 2020 and 2050 strategies to turn the EU into a "low-carbon" economy [6]. Europe has already decreased their greenhouse emissions by 19% (since 1990 levels), showing that it is possible to change the trends [4, 6]. However, this commitment will only be possible to accomplish with great effort, and various strategies must be applied
in order fulfil these goals.
C H A P T E R 1 . I N T R O D U C T I O N
the global temperature will rise well above the 2ºC target [2, 7].
Nowadays humankind has a great and growing demand on energy and we are totally dependent on its supply, as it is the backbone of all modern economies. Today more than 80% of energy supply comes from fossil fuels such as crude oil, coal and natural gas [8]. This is mainly due to the availability and relatively cheap cost of these fuels compared to alternative energies [3, 4, 8]. As stated, a need for alternative energy sources is crucial, but also other strategies are in need in order to ensure a secure energy supply while changing into a low-carbon energy supply system.
Carbon Capture and Storage (CCS) is considered to be a mid to long term strategy for cost effective CO2capture for power plants and CO2intensive industries [7, 9, 10]. CCS consists in three steps: capture, transport and storage of CO2, where the most expensive stage is the capture that represents two thirds of the total cost of CSS [9, 11, 12]. The most common technology for CSS is absorption processes such as amine-based scrubbing, which is a well established technology with high CO2recovery rates (up to 95%). However, there are drawbacks to this process, such as the production of wastewater, high energy demands and the solvents used are corrosive and degrade during the process [7, 9, 12]. Therefore, different technologies must be developed in order to make CCS processes more
efficient.
Adsorption-based separation processes are one of the potential alternatives for CO2 capture [7, 12, 13, 14]. Gas adsorption is carried out by the use of a solid adsorbent, in which the gaseous fluid phase adsorbate attaches itself either physically or chemically [12]. The separation of CO2and other gases using adsorption can be achieved by using different processes, that are usually carried out in a fixed bed system, which has basically two main steps: adsorption and regeneration [15]. Regeneration occurs when the adsorbates are removed or recovered from the adsorbent, thus allowing the solid to be used multiple times [11, 15]. Different adsorption technologies are used to apply adsorption processes
and mainly diverge on the regeneration step. As an example the most commonly used and mature process is dominated as Pressure Swing Adsorption (PSA), in which the adsorbent regeneration is carried out through reduction of the total pressure in the system [15]. Other examples of adsorption processes used for CO2 capture are Temperature Swing Adsorption (TSA) and Electric Swing Adsorption (ESA)[7, 9, 12, 16]
The advantages of adsorption processes is that there are no by-product production such as wastewater and they are potentially less energy demanding compared to absorp-tion processes [9, 17]. Although there are clear advantages with adsorpabsorp-tion processes for CSS there are still limitations compared to other well established technologies. Those lim-itations may lay on different factors such as operating temperature, selectivity, capacity and regeneration of the adsorbent, CO2removal efficiency, costs and scale-up of processes [9, 14]. In order to overcome these obstacles one important factor is the selection of a proper adsorbent for CO2capture. Therefore, it is of paramount importance to develop and study a wide range of different adsorbents and their applicability in CCS processes
1 . 2 . S T R U C T U R E O F T H E D I S S E R TAT I O N
A vast number of different adsorbents show potential in CO2capture. Metal Organic
Frameworks (MOFs) are a relatively novel class of materials that are now subject to diff
er-ent studies and in particular in gas adsorption processes [11, 14, 16, 18, 19, 20, 21]. Only recently some MOFs been available commercially but are still generally only commer-cialized in their powder form. If a powdered adsorbent, for instance a MOF, were to be used in a adsorption process, such as PSA, different problems would arise, such as high
pressure drops [18, 22, 23, 24, 25]. Therefore, it is necessary to shape an adsorbent into body like forms, such as pellets or extrudates to overcome these problems and further study their applicability in these processes. Here arises the main goal of this thesis, which is to shape adsorbents, and in particular MOFs, with different techniques and study their characteristics and applicability for adsorption processes.
The objective of this dissertation is to understand what different kinds of shaping
tech-niques and which optimized conditions can be applied to shape adsorbents, which in this work was the MIL-53(Al) MOF. Different mechanical, structural and physico-chemical
analysis are performed in order to characterize the obtained particles. Furthermore, these shaped materials are also characterized through CO2adsorption equilibrium mea-surements as it is essential to understand the viability of applying these materials in alternative CSS technologies.
1.2 Structure of the Dissertation
This dissertation is divided into five chapters.
• Chapter 1:Introduction.
This chapter demonstrates the motivation of the dissertation. The intent is to show the problems and issues related to the excess of carbon dioxide emissions and how adsorption processes and adsorbent materials are possibly viable alternative solu-tions. This chapter also summarizes the organization of this work.
• Chapter 2:Theoretical Background. This chapter comprises the review of the theo-retical background regarding adsorption phenomena, adsorbents and in particular MOFs, such as MIL-53(Al). This chapter also includes a review of different shaping
techniques for porous materials and the different characterizations that should be
performed in order to fully characterize a shaped adsorbent.
• Chapter 3:Methodologies and Experimental Work. This chapter shows the different methods and experimental work carried out. It starts by showing the two diff
er-ent shaping techniques used, followed by the description of the different methods
employed to characterize the different shaped materials.
C H A P T E R 1 . I N T R O D U C T I O N
used to shape the MOF MIL-53(Al) are discussed and compared. The different
characterization analysis of the samples and adsorption equilibrium measurements are also reported.
C
h
a
p
t
e
r
2
T h e o r e t i c a l Ba c k g r o u n d
2.1 Adsorption Phenomena
Nowadays adsorption phenomena is a part of numerous important processes in diff
er-ent technological applications [26]. The use of adsorption techniques are a part of our civilization dating all the way back to ancient Egypt and Japan, where wood char was already used to purify medicinal substances, yet only in 1881 was the term adsorption first introduced by Kayser [26, 27].
Today most of the attention regarding this phenomena focuses on its practical appli-cation in industries and in environmental protection [15]. Adsorption has a wide range of industrial applications, such as separation and purification of liquid and gas mixtures, bulk chemicals and isomers; drying gases and liquids; removal of impurities; recovery of chemicals from industrial vent gases and also gas storage [11, 15, 28].
The adsorption phenomena can be defined as adhesion of gas or liquid molecules on the surface of a solid adsorbent [27, 29]. In a mixture, each component of a gas or liquid (adsorbate) has a different affinity towards the surface of an adsorbent, thus separation
is achieved duo to a higher affinity of the adsorbate to the adsorbent. [29, 30]. Different
types of phenomena can occur during adsorption, mainly due to different bondings
be-tween the adsorbate and the adsorbent [31]. Depending on these different interactions
and energy between the bonds of the molecules can be divided into two different
cate-gories: physical adsorption (physisorption) or chemical adsorption (chemisorption) [11, 31].
C H A P T E R 2 . T H E O R E T I CA L BAC KG R O U N D
original identity [31, 32].
Chemisorption occurs due to chemical reactions that creates stong bonds between the adsorbate and the adsorbent [31]. As a result, since there are chemical bonds, the adsorbent loses its original identity. Therefore, desorption may not possible in this type of process [31, 32].
Adsorption depends on two parameters temperature and pressure (or concentration). Physisorption of gases are commonly reported through adsorption isotherms [33]. An adsorption equilibrium isotherm at constant temperature is the relationship between the amount adsorbed by unit mass of solid and the equilibrium pressure of the gas. This is, the equilibrium between the amount adsorbed q and the partial pressure p of the adsorbate at a constant temperatureT (Equation 2.1)[27, 33]. This equilibrium shows to which extent the solute is adsorbed in the selected conditions [30].
q=q(p) (at constantT) (2.1)
Different type of physisorption isotherms can occur in gas adsorption, for various
adsorbent-adsorbate pairs. Five experimental isotherms for pure gases were identified by Brunauer in 1940. The IUPAC recommends a classification based on 6 types of isotherms as shown in Figure 1 [33] . The first five types, I to V, were proposed in 1940 by Brunauer, Deming, Deming, and Teller and they are referred to as BDDT classification [15, 34]. There are a considerable number of borderline cases that are difficult to assign to one
group rather than another. The recommended IUPAC classification is expressed as being types: I(a), I(b), II, III, IV(a), IV(b), V and VI [33].
• Type I,this type of adsorption isotherm corresponds to a mono-molecular adsorp-tion, forming a mono-molecular layer of adsorbate. It presents a maximum limit of the amount adsorbed. Furthermore, this isotherm is typical of gases that are above their critical temperature [27, 30]. Type I(a) isotherms are typical of microporous materials having mainly narrow micropores (approximately < 1 nm); Type I(b) isotherms are found with materials having pore size distributions over a broader range (approximately < 2.5 nm) [33].
• Type II,this type of adsorption corresponds to a multi-layer BET adsorption. This type of adsorption occurs by layers, in which the heat of adsorption for the first adsorbed layer is higher than for the subsequent layers. Moreover, each layer is as-sumed to have a heat of adsorption equal to the heat of condensation. Usually this type of isotherm presents with gases at temperatures below their critical tempera-ture and for pressures that are bellow and approaching their saturation pressure [27, 30].
2 . 1 . A D S O R P T I O N P H E N OM E N A
heat of adsorption of the first layer approaches zero, adsorption is delayed until the saturation pressure is approached. Furthermore, this isotherm is quite undesirable, due to its low adsorption capacities at low pressures [30].
• Type IV and V,these types of adsorptions correspond to the capillary condensation versions of type II and III isotherms, respectively. Adsorption in these isotherms occur before before saturation pressure is reached. In the case of type IV(a) this isotherms demonstrate the phenomena of hysteresis. Hysteresis occurs in multi-molecular adsorption regions, in the figure it is shown by the upward adsorption branch due to simultaneous multi-molecular adsorption and capillary condensation. The downward branch is the desorption. This can also occur in other isotherms if impurities are present [30, 33].
• Type VI, corresponds to a reversible stepwise isotherm, this is a layer-by-layer type of adsorption on a uniform nonporous solid. Each step represents a layer of adsorption capacity[33].
C H A P T E R 2 . T H E O R E T I CA L BAC KG R O U N D
To further study adsorption, different techniques may be applied depending on the
characteristics of the adsorbate, adsorbent and the desired conditions.
2.2 Adsorbents
Many different materials have been developed for gas separation, the most commonly
known are: activated carbons, silica gel, ion-exchange resins, zeolites, mesoporous silicate, activated alumina and metal oxides [11, 26, 34]. Moreover up until the XX century only 4 types of adsorbents were commercially sold: activated carbon, zeolites, silica gel and activated alumina [34].
Recently new adsorbents have emerged showing more promising results in gas adsorp-tion, such as carbon fibers, carbon nanotubes, graphite nanofibers, mesoporous molecular sieves and Metal Organic Frameworks (MOFs) that have high surface areas and are very porous materials [11, 34]. However, these materials, are quite expensive essentially due to their raw material cost and are only commercially available as-produced powders and not in the proper form for process gas separation [35]. Further research is needed to develop these new adsorbent materials to their full potential [34].
Selecting an appropriate adsorbent is one of the most fundamental and critical steps in gas adsorption processes [36]. However, this selection is a quite complex problem, because it involves looking for different attributes [34]. Important attributes that should
be analysed when selecting an adsorbent are:
• Selectivity,this attribute can be based on three factors: affinity, kinetic selectivity
and pore size. Affinity is the adsorbents affinity to the target molecules that are
desired to be adsorbed. Kinetic selectivity is the intraparticle diffusion rate, this
defines the rate at which different components diffuse into a pellet. Size and shape
of the pores of an adsorbent are also a critical factor when choosing an appropriate adsorbent. The selected material should shave a small pore size, but large enough to accommodate the desired adsorbate [27, 34]. These three factores combined or independently define the selectivity of an adsorbent for a desired adsorption [27].
• Capacity,of an adsorbent depends on the nature of the material, the nature of the pores and the working conditions [28]. Adsorption is widely dependent on the inter-facial area. Therefore, when selecting an adsorbent it should show a high capacity of adsorption, this depends mostly on its surface area, that usually should be well over 100 m2/g [26, 27]. These type of materials are usually very fine particles or highly porous to achieve better results, between a micropore range and a macropore range [26, 36]. The classification of pore sizes recommended by the International Union of Pure and Applied Chemistry (IUPAC) is shown in Table 2.1.
2 . 2 . A D S O R B E N T S
recovered [27]. This factor is significant when determining if the chosen adsorbent is efficient for the desired process or not, because it is directly associated to the cost
of the process [28]. In some cases the same adsorbent may be reused for months or even for years [27]. Regeneration can be evaluated, for example, by temperature or pressure swing and by the energy required [34].
Table 2.1: Classification of pore sizes by IUPAC [36].
Micropores d < 2nm
Mesopores 2nm < d < 50nm
Macropores d > 50nm
2.2.1 Metal Organic Frameworks
Coordination polymers are in general materials in which a material possesses an extended connection of metal and ligand monomers through coordination bonds [19]. In this category we can find Metal Organic Frameworks (MOFs) that have the particularity of showing strong bonding, linking units and a geometrical highly ordered structure [19, 37]. MOFs are a new class of materials that were developed just about three decades ago [28, 38, 39]. For the last two decades (MOFs) have been more intensely developed and have been showing great potential for several applications such as in gas storage, gas adsorption, magnetic materials, luminescent and florescent materials, sensors and in drug storage and delivery [18, 19, 28, 38, 39, 40, 41].
MOFs can be described as being a “hybrid porous solid, in which the framework is en-sured by the linkage of inorganic moieties with functionalized organic molecules through covalent or iono-covalent bonds” or as “organic-inorganic hybrid solids with infinite, uni-form framework structures build from organic linkers and inorganic metal nodes” [28, 42]. Figure 2.2 shows a summarizing representation of the general classification of porous solids [28].
Today one of the best examples of the importance of porous material in industrial processes are zeolites, which already have a major role in chemical processes and other industrial applications [19, 28, 35, 38, 39]. MOFs are many times compared to zeolites due to their similarities in nature and structure. However, MOFs are captivating more interest, due to their greater versatility compared to other adsorbent materials [18]. This versatility is due to their framework structures and pore properties that can be tailored by choosing appropriate metal and ligand constituents [39, 43].
One of the most interesting properties that MOFs possess are their porosity. With higher porosity and larger surface areas, in comparison with other traditional porous ma-terials (e.g. activated carbons and zeolites), they are great options for the accommodation of different foreign chemical entities (e.g. H2, CO2, CH4). Hence their applicability in
C H A P T E R 2 . T H E O R E T I CA L BAC KG R O U N D
Figure 2.2: Representation of the general classification of porous solids [28].
2.2.1.1 MIL-53 (Al)
MIL-53(Al), also known as aluminum terephthalate, is a MOF that attracted attention for gas adsorption, especially due to its great flexibility and capacity to adsorbs large amounts of gases, such as H2, CO2and light alkanes [39, 44, 45]. This material is part of a class of MOFs that are classified as porous metal carboxylates of the MIL-n type, where MIL stands for Materials Institute Lavoisier. The MIL-53 framework is highlighted due to its great flexibility and ability to assume different pore conformations that is induced
when hosting different molecules, by temperature changes or by mechanical pressure [40,
45, 46, 47].
The flexible nature of this framework or "breathing capacity" is mainly due to tran-sitions that oscillate between two forms: a large pore (lp) and a narrow pore (np) (Fig-ure 2.3). Furthermore, the transition between each form can have a difference in cell
volume up to 40% [17, 39, 44, 45, 48]. This breathing transition and behavior can be induced by different factors, such as the adsorption of different types of molecules,
tem-perature changes and mechanical compression [44, 47, 49]. For example, at 30ºC the MIL-53 framework will transition between np and lp during adsorption of CO2and H2O, but during adsoprtion of H2 and CH4 this does not occure [16, 50]. Furthermore on commercialized MIL-53(Al) this breathing behaviour has not been reported [16, 51].
In gas adsorption processes MIL-53(Al) has been object of study for the last few years. Promising results have been shown with this MOF in adsorption of different gases such
as CO2, CH4, CO2/CH4mixtures, N2, of supercritical methane and of Xenon (Xe) [16, 25, 39, 44, 45, 48, 51, 52, 53, 54].
2 . 3 . S H A P I N G T E C H N I QU E S FO R GA S A D S O R P T I O N A P P L I CAT I O N S
(a) Metastable large pore (b) Metastable narrow pore
Figure 2.3: Representation of the metastable large pore (lp) and narrow pore (np) struc-tures of the MIL-53(Al) material, as a 2 × 2 × 2 supercell viewed along the axis of the unidimensional channel [45].
2.3 Shaping Techniques for Gas Adsorption Applications
Most porous materials such as MOFs are synthesized as a powder, but in order to apply them in processes such as fixed-bed gas adsorption these powders must be transformed or shaped into bodies known as extrudates, beads or pellets [18, 22]. Moreover shaping MOFs and other novel porous materials bring these materials a step closer to the use in industrial processes [24, 56].
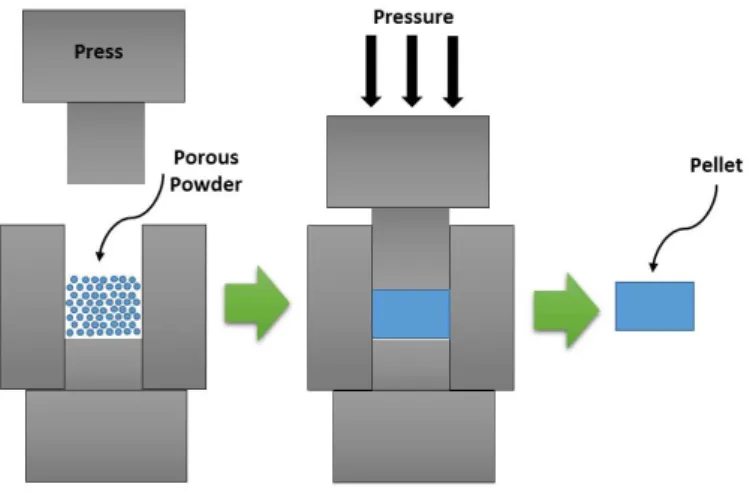
By giving shape to these materials it is possible to obtain structures that can be used in processes that help achieve lower pressure drops, better heat management and higher mechanical stability [23, 24, 25]. The major challenge in shaping adsorbents is to main-tain at its best, the original properties and characteristics of the powder material and a desirable mechanical resistance, in order to their proper usage in typical gas adsorption processes applications. [18, 57]. Many different properties relate to the performance of
these structured materials, but tradeoffs between these parameters are inevitable [23].
For example, with smaller pellets you can achieve faster mass transfer but this will lead to higher pressure drops in packed beds [23].
C H A P T E R 2 . T H E O R E T I CA L BAC KG R O U N D
Figure 2.4: Representation of an extrusion method.
overcomes heat transfer and pressure drop limitations compared to traditional extruded pellets. Colloidal processing is used to obtain macroscopic monoliths or bodies by dis-persing the powders into a liquid or a polymer. Templating techniques can be generally defined as a process in which a structured mould is used to shape a materiel [61]. These techniques are varied and can be differentiated as soft templating, hard templating and
solvent templating [23]. Dry pressing is another widely used technique, where a powder is compacted through a metal die to form a desired shape, as represented in Figure 2.5 [57, 62].
These techniques can be divided into two distinct categories: without binder (binder-less) or with binder. Being that a binder is material that binds other materials together, acting like a glue or as an adhesive between particles [18].
2 . 3 . S H A P I N G T E C H N I QU E S FO R GA S A D S O R P T I O N A P P L I CAT I O N S
2.3.1 Binderless Shaping
Binderless shaping relates to the process of transforming porous materials into shaped macroscopic bodies without the aid of binders [23]. The most common technique to shape porous powders, without a binder is by compression, in which the material is compressed together and creates a physical bond. The simplest way to achieve this is by pressing the material into pellets by use of a press and then these pellets can be crushed and sieved into a desired size, see image [22, 25, 63]. Previously other MOFs have been shaped using this method with different pressures: MIL-53(Al) with a pressure of 500bar and
Cu3(BTC)2with 25.33 bar [25, 63]. Although this method has the advantage of not using a binder that will inherently change the properties of an adsorbent, with the use of high pressures to shape structured adsorbents a possible degradation of their crystal structure is an issue [18, 57, 63]. Therefore further studies to understand the impact of this type of shaping on MOFs is necessary.
A more novel technique that has been applied to different porous materials is by the
use of Pulsed Current Processing (PCP), which uses high heating rates to partially fuse porous particles together [23]. The PCP process provides has been successful for many porous materials but since its heating process is very high (approximately 800ºC) this may not be applicable to some materials that are not resistant at high temperatures [18, 23].
2.3.2 Shaping with Binder
Shaping a porous material with aid of a binder is usually is achieved by blending the powder with an inorganic or organic binder and a liquid phase (plasticizer) into a paste [59, 64]. In general, to achieve high mechanical strength, inorganic binder is used, while an organic binder is used when a certain plasticity and mechanical strength is desired [59, 64]. The advantage of using a binder, for example in extrusion, is that the porous powders easily form into desired shaped and usually without the use of pressure [65]. The drawback using a binder is the fact that it also reduces the mass percentage of the adsorbent powder in a shaped body [65].
A wide range of binders have been used to structure porous powders. The great-est problem is to chose an appropriate binder and plasticizer for the material in hand. Furthermore, obtaining an adequate proportion between binder and powder is another challenge itself. In the case of shaping MOFs, the goal is to mix just enough binder to obtain good mechanical stability while maintaining a high specific surface area [59].
C H A P T E R 2 . T H E O R E T I CA L BAC KG R O U N D
PVA shows particular interest as a binder for adsorbents, including MOF materials. PVA is a thermoplastic and biodegradable synthetic polymer that is soluble in water. PVA shows good properties as a binder, with low toxicity, anti-electrostatic properties, chemical resistance, toughness and permeability [59, 66]
This binder has been previously applied to shape adsorbents and shows promising results with different MOFs, such as: MIL-53(Al), UTSA-16 and Cu3(BTC)2[25, 59, 63].
As discussed, the amount of binder applied to an adsorbent is a critical issue, because an excess of binder will decrease considerably the surface area, while too little will not give the mechanical and physical strength desired. It is suggested that the ideal amount of PVA should be used from 1 to 5% (2% is preferred) by weight of PVA based on the total weight of the adsorbent (w/w) [66]. This should give the adsorbent the desired hardness and adsorption capacity. In a previous study with MIL-53(Al) the surface area did decrease to a great extent when using over 10% (w/w) of PVA as a binder [25]. Most recently a research was developed with UTSA-16 showing better results with this binder as different and lower percentages of binder were studied [59].
In conclusion, further studies of different mixtures and shaping techniques with
binders should be conducted for different MOFs in order to achieve desirable shaped
bodies that maintain to its best the materials original properties.
2.4 Characterization of Shaped Adsorbents
When shaping materials, an important step is to evaluate the different characteristics of
the shaped material. In the case of adsorbent powders for gas adsorption, equilibrium experiments are conducted to determine the materials adsorption capacity and specific surface area. Other important properties that must be tested are mechanical, structural and physico-chemical characteristics. The determination of these different parameters
can give an overall image of the material and validate its usage in gas adsorption pro-cesses.
2.4.1 Mechanical Characterization
Shaped materials used in gas adsorption processes will be subjected to different
con-ditions that may lead to deterioration of its structure and thus leading to poor results. Adsorbents used in gas adsorption processes are generally used in fixed bed systems. In order to fill a column with shaped adsorbent it must be packed in order to achieve maxi-mum surface area, during the process the particles will be subject to very high pressure changes and different temperature ranges which can degrade the material. Therefore, a
2 . 4 . C H A R AC T E R I Z AT I O N O F S H A P E D A D S O R B E N T S
2.4.2 Structural and Physico-chemical Characterization
In the case of porous adsorbent materials such as MOFs it is essential to analyse their structure in terms of porosity and physical chemical properties. When shaping porous materials either with or without the use of a binder the stucture of the material can change as well as its physical and chemical properties. In order to analyse these properties different methods can be used such as: Scanning Electron Microscopy (SEM) imaging, X-Ray analysis (XRD) and mercury (Hg) porosimetry, thermogravimetric analysis (TGA) and nitrogen (N2) adsorption.
2.4.3 Adsorption Equilibrium Measurement Techniques
Adsorption equilibrium measurements are used to determine the adsorption capacity of an adsorbent under certain conditions. They are effective to understand the materials
ad-sorption properties in different pressure and temperature conditions. Various techniques
have been developed for adsorption equilibrium measurements of gases. Two well known methods are the volumetric/manometric and gravimetric, each presenting advantages and disadvantages.
• Volumetric, also known as gas adsorption manometry or as the BET volumetric method, is based on the measurement of the gas pressure in a calibrated, constant volume (at constant temperature) [26]. It is the oldest and most simple method to determine adsorption isotherms [31]. The apparatus for this method can have different configurations, but in general the layouts are simple and follow the same
principle. During a volumetric experiment a known amount of adsorbate gas is expanded into a confined, calibrated volume containing the adsorbent, which is maintained at a constant temperature. Once the adsorbate and the adsorbent are in contact adsorption starts to occur and the pressure in the volume falls until equi-librium is achieved. The difference between the initial and the final volume of gas gives us the amount of volume of the adsorbate that was adsorbed [31]. Advantages of this system is its simplicity and relatively low cost to build [67]. Although due to its more simplistic approach it shows some disadvantages. This method does not perform very well in lower pressures and the precision of the data is lower than compared to other methods, such as the gravimetric method [31, 33].
C H A P T E R 2 . T H E O R E T I CA L BAC KG R O U N D
C
h
a
p
t
e
r
3
M e t h o d o l o g i e s a n d E x p e r i m e n t a l Wo r k
This chapter is divided into two main parts. The first part consists in the description of the two methods employed to shape MIL-53(Al). The second part describes the character-ization techniques used.
3.1 MIL-53(Al) Shaping
The main objective of this thesis is to shape an adsorbent for application in adsorption processes. The MOF MIL-53(Al) will be the adsorbent under study in this work. This adorbent was purchased from Sigma-Aldrich (product no.688738) with the trade name Basolite® A100 (synthesized by BASF AG, Ludwigshafen, Germany). Basolite® A100 is sold in a powder form, its surface area is reported to be between 1100-1500m2/g, with a bulk density of 0.4 g/cm3and with a particle size distribution of 31.55µm [68]. Furthermore, since its production some researchers have studied and applied Basolite® A100 in adsorption processes and have confirmed the material characteristics reported by the manufacturer [16, 44, 51, 53].
Two different methods were used to shape this porous material: binderless
compres-sion and extrucompres-sion with binder. Initially both methods were first tested with activated charcoal in order to get a better understanding of how each process should be carried out on a cheaper adsorbent material. Activated charcoal generally costs less than 0.20€/g
, while Basolite® A100 costs 8.85€/g. Only visual results were taken into account and
C H A P T E R 3 . M E T H O D O LO G I E S A N D E X P E R I M E N TA L WO R K
3.1.1 Binderless Shaping
To create samples of binderless pellets a manual hydraulic press (15Ton manual hydraulic press, Graseby Specac) with a circular evacuable pellet die with 10mm diameter was used (Figure 3.1). Each sample was weighed (approximately 0.5g) and inserted into the pellet die.
Preliminary tests were done with activated charcoal in order to understand what pressures should be used on the MOF. The press used has a scale in ton-force (tf) and has a minimum force of 0,5tf and a maximum 10tf, which is approximately 624bar and 12482bar respectively. To convert the force applied into pressure the equation 3.1 was used, where: Pbaris the pressure in bar, Ftfis the force in ton-force, d is the diameter of the pellet in meters and 10.2 corresponds to the conversion of 1 bar to ton/m2[69].
Pbar≃
Ftf (d/2)2π
10.2 (3.1)
Figure 3.1: Manual hydraulic press and pellet die.
Different samples were made applying different forces from 0.5tf to 10tf for 10
min-utes. The results obtained with activated charcoal can be seen in Table 3.1 and in Fig-ure 3.2. From observation it was concluded that with forces above 1tf the activated charcoal pellets were less consistent and more brittle than the 0.5tf and 1tf pellets.
3 . 1 . M I L- 5 3 ( A L ) S H A P I N G
(a) (b) (c)
(d) (e)
Figure 3.2: Activated Carbon Binderless Disks: (a) Batch Y1 & Y2; (b) Batch Y3 & Y4; (c) Batch Y5; (d) Batch Y6; (d) Batch Y7 & Y8.
Table 3.1: Binderless Activated Charcoal Pellets Samples and Results.
Batch Force Pressure Observations
(tf) (bar)
Y1 & Y2 10.0 12482 Pellets are very brittle
Y3 & Y4 5.0 6241 Pellets are very brittle
Y5 1.5 1872 Pellet with more consistency but a little brittle
Y6 1.0 1248 Pellet with more consistency but a little brittle
Y7 & Y8 0.5 624 Pellets with more consistency
Table 3.2: Binderless MIL-53(Al) Samples.
Batch Force (tf) Pressure (bar) Sieve (mm)
A1 1 1248 1-2
A2 0.5 624 1-2
3.1.2 Shaping with Binder
C H A P T E R 3 . M E T H O D O LO G I E S A N D E X P E R I M E N TA L WO R K
3.1.2.1 PVA Solution Preparation
A PVA solutions are basically obtained by mixing PVA and distilled water. This polymer was purchased from Sigma-Aldrich (product no.10852) with the trade name Mowiol® 10-98(synthesized by Sigma-Aldrich, Steinheim, Germany).
PVA is initially mixed with cold distilled water in small amounts at ambient tempera-ture and under stirring. In order to solubilize completely the PVA, this solution must be heated up to a temperature range of 90ºC to 98ºC with continuous stirring [70]. Ideally, in order to insure that no water is lost by evaporation, this process should be carried out with in a three necked flask adjusted with a reflux condenser, a thermometer and a mechanical stirrer [25, 63]. Alternatively, as a three necked flask was not available, only a beaker, a magnetic stirrer and a thermometer were used. Heating was obtained with a magnetic hotplate stirrer (VMR-VMS-C7). During the heating process, the beaker was covered with tin foil in order to avoid water loss and the temperature was measured by the use of a thermometer. The mixing time varied from 2 hours to overnight depending on the amount of PVA being solubilized.
Four solutions were prepared with different weight/weight percentages from 2%(w/w)
to 15% (w/w). The PVA solutions prepared and the amount of water and PVA employed are shown in Table 3.3.
Table 3.3: PVA Solutions Prepared.
Batch PVA Solution PVA Distilled Water
(% w/w) (g) (g)
PVA2 2 0.51 25
PVA5 5 1.32 25
PVA10 10 2.78 25
PVA15 15 4.41 25
3.1.2.2 MIL-53(Al)-PVA Mixture and Extrusion
The amount of binder applied to MIL-53(Al) is a critical issue, if too much is employed the surface area of the adsorbent will decrease considerably, while if too little is used the material will not possess the mechanical resistance desired. The ideal amount of PVA to be used as a binder ranges between 1% and 5% [66]. Alternatively, previous studies with MOF shaping, suggest that more than 10% of binder can be employed [25, 63]. Therefore, different MIL-53(Al)-PVA mixtures were prepared. This may allow a better
understanding of the different characteristics that this adsorbent may have depending on
the amount of binder used. Furthermore, this process may permit us to select an ideal amount of PVA that should be used to shape this adsorbent for adsorption purposes.
3 . 1 . M I L- 5 3 ( A L ) S H A P I N G
3.4, here we concluded that the composition of the mixtures will be determinant to origin viscosities that can permit extrusion of the formed paste (Figure 3.3). With sample Z2 we achieved a relatively uniform extrudate using this method (Figure 3.3(b)).
In order to calculate the amount of adsorbent needed to obtain the desired percentage for the mixture equation 3.2 was used, whereWadsorbent is the mass of adsorbent used in
grams,WPV Asolis the mass of the PVA solution used in grams,PV Asol is the percentage
(% w/w) of PVA contained in the PVA solution used andBinderis the total percentage (% w/w) of binder contained in the binder/adsorbent mixture . Any additional amount of water that might be added to the mixture is discarded as it does not affect the percentage
of binder in the mixture.
Wadsorbent(g) =
[WPV Asol(g)×PV Asol(%w/w)]×[1−Binder(%w/w)]
Binder(%w/w) (3.2)
Table 3.4: Activated Charcoal-PVA Mixtures and Observations.
Batch Binder PVA PVA Activated Observations
(% w/w) Solution Solution Charcoal
(Batch) (g) (g)
Very fluid mixture and
Z1 23 PVA15 10.00 5.02 after extrusion did not
maintain it’s form. More viscous mixture
Z2 18 PVA15 15.00 10.25 and after extrusion
maintained it’s form.
(a) (b)
Figure 3.3: Activated Charcoal with PVA Binder: (a) Batch Z1; (b) Batch Z2.
Mixtures of the PVA solutions with the powdered MIL-53(Al) were done by simply manually mixing small amounts of MIL-53(Al) in a beaker using a spatula (Figure 3.4(a)). The different mixtures prepared are summarized in Table 3.5, where it is shown that
for each batch different mixtures of PVA were used due to their different viscosities. In
some situations it was observed that the PVA mixture alone was not sufficiently fluid to
C H A P T E R 3 . M E T H O D O LO G I E S A N D E X P E R I M E N TA L WO R K
(a) (b)
Figure 3.4: (a) Example of a MIL-53(Al)-PVA Mixture; (b) 5ml Syringe used for Extrusion.
Table 3.5: MIL-53(Al)-PVA Mixtures and Samples.
Batch Binder PVA Solution PVA Solution MIL-53(Al) Added Distilled
(% w/w) (Batch) (g) (g) Water (ml)
B1 2 PVA2 1.250 1.225 2.0
B2 5 PVA2 2.500 0.950 0.0
B3 5 PVA5 1.000 0.950 1.0
B4 10 PVA5 1.500 0.675 0.0
B5 10 PVA10 1.000 0.900 0.5
B6 15 PVA10 1.000 0.566 0.0
B7 15 PVA15 1.200 1.020 1.0
After the preparation of each mixture the following step is to extrude the paste ob-tained. Extrusion was carried out using a syringe that has an opening of 2mm (Figure 3.4(b)). Each sample was left to dry on a petri dish exposed to air overnight. To ensure that all of humidity was removed from each sample they were afterwards dried in a muf-fle furnace (Nabertherm B170 GmnH, Germany). The drying temperature was set up to 190ºC with a heating rate of 0.5ºC per minute, near the recommended degassing temper-ature for MIL-53(Al) and bellow the melting point the PVA which are both at 200ºC [44, 71]. After each sample was completely dried, they were cut into smaller sizes with 1mm to 4mm of length.
3.2 Characterization of Shaped MIL-53(Al)
3.2.1 Mechanical Characterization of Samples
3.2.1.1 Pressure/Depressurization Tests
3 . 2 . C H A R AC T E R I Z AT I O N O F S H A P E D M I L- 5 3 ( A L )
thus simulating similar conditions occurring in adsorption processes such as in a PSA or other fixed bed systems.
The different samples of binderless MIL-53(Al) and MIL-53(Al)-PVA were packed in
a small column (Figure 3.5). In the case of the binderless samples they were previously weighed, while for the samples with binder the number of extrudates inserted into the column were counted. The column is then placed in line as represented in the schematic diagram of the pressure test unit as shown in Figure 3.6.
Three different cycles were tested with each sample, at three different pressures of
3, 10 and 18 bar. For each cycle, the pressure in the column is controlled by opening valve 1 (V1) and valve 2 (V2) and checked with the pressure sensor (PT). This pressure transducer is connected to a computer that has a LabVIEW™ (National Instruments soft-ware) based software developed in-house which allows to record the instant pressure over time [67]. After the column at the desired pressure, the system is left up to 5 minutes and then depressurized to atmospheric pressure, by opening valve 3 (V3), for another 5 minutes. The process was repeated two more times for a total of 3 cycles. After each cycle the sample was removed from the column, in the case of the binderless samples they were once again sieved between 1mm and 2mm and weighed in order to determine the percentage of material that was fragmented during the each pressure cycle. For the samples with binder they were once again counted in order to determine if any extrudates were damaged or broken.
(a)
(b)
C H A P T E R 3 . M E T H O D O LO G I E S A N D E X P E R I M E N TA L WO R K
PT
V2
G
as
Supply
V1 V3
Exhaus�on Column
Figure 3.6: Schematic diagram of the pressure test unit. PT and V denote pressure transducer and valves respectively.
3.2.1.2 Abrasion Tests
A ballmill type aparatus, was used to obtain information about the mechanical resis-tance of the shaped MOF under high attrition conditions [65]. The ballmill (ULTRA-TURRAX®Tube Drive control, IKA) was used with steel balls with a diameter of 1.4cm
and with a velocity of 400rpm for 2 minutes (Figure 3.7. Each sample was weighed before each test. After each test the sample was sieved between 1mm and 2mm in order to define the percentage of material that was damaged during the test.
Figure 3.7: Ballmill apparatus used in the abrasion tests.
3.2.1.3 Drop Tests
3 . 2 . C H A R AC T E R I Z AT I O N O F S H A P E D M I L- 5 3 ( A L )
Figure 3.8: Drop Test Apparatus.
3.2.2 Structural and Physico-chemical Characterization of Samples
3.2.2.1 X-Ray Diffraction (XRD)
X-Ray diffraction (XRD) analysis was performed to evaluate the crystallinity of the
MIL-53(Al) powder and of the binderless samples of MIL-MIL-53(Al) obtained. This analysis is obtained by studying the XRD peak positions. The main advantage of this method is that its a non-destructive method [72].
These analysis were performed in a X-Ray Diffractometer (XRD, Rigaku MiniFlex™ II)
operating at room temperature. The radiation source was the Cu Kαline (λ= 1.5418Å) at a continuous scan at 0.5º (2θ) per minute over the range of 5º≤2θ≤50º, using a step of 0.02º (2θ) [44].
3.2.2.2 TGA
Thermogravimetric analysis (TGA) was performed to evaluate the samples weight loss while submited to increasing temperature. The extruded samples of MIL-53(Al)-PVA and also of only PVA were analysed by TGA (Model Q50 V6.7 Build 203, Universal V4.4, TA Instruments) under a nitrogen atmosphere at a heating rate of 10ºC/min up to 100ºC and kept at this temperature for 30 minutes and then heated at a rate of 5ºC/min up to 650ºC. Another analysis was performed with a initial heating rate of 10ºC/min up to 100ºC and kept at this temperature for 30 minutes and then heated at a rate of 10ºC/min up to 190ºC and then kept at this temperature for up to 24hours.
3.2.2.3 He Pycnometry
C H A P T E R 3 . M E T H O D O LO G I E S A N D E X P E R I M E N TA L WO R K
specify the skeletal density of the binderless samples. Before performing the analysis the samples were evacuated overnight at 200ºC. Helium intrusion was then measured at 35ºC in an automated gas displacement pycnometer (Accupyc 1330, Micromeritics).
3.2.3 Adsorption Equilibria
To measure the adsorption equilibrium of CO2at 30ºC of each sample the volumetric/-manometric method was used. The adsorption equilibrium measurements were obtained by using the volumetric unit shown in Figure 3.9 represented in the schematic diagram (Figure 3.10). This unit and its software were developed previously in-house [67] [73]. With this apparatus it is possible to measure simultaneously two different samples in
parallel and the degassing is done in situ, since the cells used to contain the samples are placed inside of an oven with temperature control and both lines are also connected to a vacuum pump.
(a)
(b)
3 . 2 . C H A R AC T E R I Z AT I O N O F S H A P E D M I L- 5 3 ( A L )
TT2 PT2 PT1
V2 V8
V3 V7
V8 V9 V4 V5
G as Su p p ly A u xi li a ry V o lu m e
Oven cwith TIC)
Cel 2 Cel 1
V0
V1 V11
V10
Line 2 Line 1
Exhaustion Vacuum Pump TT1 TI1 TI2
Figure 3.10: Schematic diagram of volumetric unit. The green section represents line 1; the blue section represents line 2; PT, TT and TI denote pressure transducers, temperature sensor and temperature indicator respectively; V represents the valves.
3.2.3.1 Calibration of the Volumetric Adsorption Unit
In order to use this unit for gas adsorption equilibrium measurements it is necessary to calibrate the sensors and the volumes. It is also important to refer that before pro-ceeding with any measurement it is always necessary to ensure there are no leaks. The pressure transducers (PT) were calibrated using the manufactures guidelines (Omega Eng. Inc, USA) by checking the acquired voltages at atmospheric pressure and vacuum. The reference volumes (V ref) and the cell volumes (V cell) must also be known.
The reference volumesV ref1andV ref2refer to the reference volumes of line 1 (green area in Figure 3.10) and line 2 (blue area in Figure 3.10), respectively.V ref1is the volume contained between valves V2, V4 and V5 (with V3 open).V ref2is the volume contained between valves V6, V8 and V9 (with V7 open). These volumes were calculated with aid of an auxiliary volume and were previously reported [73].
The calibration of the cells was necessary due to the fact that new cells were designed and built for the unit (Figure 3.11).
C H A P T E R 3 . M E T H O D O LO G I E S A N D E X P E R I M E N TA L WO R K
(a) (b)
Figure 3.11: (a) New cells used in the volumetric unit.; (b) Example of a cell with shaped MIL-53(Al) inside.
Table 3.6: Reference and cell volumes of the volumetic unit.
Line 1 Line 2
Vref (cm3) 41.54±0.03 41.51±0.03 Vcell (cm3) 6.32±0.03 6.46±0.03
3.2.3.2 Measurements of Adsorption Equilibria
After the calibration of the volumetric unit, conditions are set to start measuring the isothermal adsorption equilibrium on the prepared samples. The adsorption equilibria measurements were carried out in the volumetric unit as shown in Figure 3.10. Each sample was tested in either one of the unit cells (Cell 1 or Cell 2) and the quantities of adsorbent were previously weighed. Before proceeding with the equilibria measurements, leaks were once more checked by using He gas, since it is an inert gas. Afterwards, the adsorbate used was CO2provided by Air Liquid (Portugal) with a purity of 99.998%. All the gas densities obtained for the measurements were retrieved from the NIST Standard Reference Database [74].
The first step for the adsorption equilibria measurements is to degas the adsorbents. To degas the samples they were heated "in situ" at a rate of 2ºC/min up to 200ºC or 190ºC, for the binderless samples or for the samples with binder respectively, and maintained at these temperatures for 3 hours under vacuum. Afterwards, the temperature during the measurements was maintained at 30ºC. Carbon dioxide adsorption equilibria for the various samples were carried out with the same protocol, as described in Appendix A.5. To report adsorption equilibrium measurements different methods are used, one is
3 . 2 . C H A R AC T E R I Z AT I O N O F S H A P E D M I L- 5 3 ( A L )
of the adsorbent in excess of the amount that would be in found in the pore volume. Absolute adsorption (q) is another alternative to present equilibrium measurment results and relates three adsorption quantities: net, excess and absolute, but for these last two it is necessary to know the skeletal density and the specific pore volume of the adsorbent used [16]. Therefore, since the skeletal density and specific pore volume was not obtained for all of the samples the adsorption equilibrium measurements for this study are reported as qnet.
To calculate the net amount adsorbed at equilibrium, equations 3.3 and 3.4 are applied where:mnetis the net adsorbed mass at equilibrium (g);ρrefandρcellare the gas densities in the reference volume and in the cell volume respectively (g/cm3);V cellis the volume of the cell (cm3);qnetis the net amount adsorbed per unit of adsorbent (mol/kg);msis the adsorbent mass (g); andM(CO2) is the carbon dioxide molar mass (g/mol).
mnetn=mnetn−1+ [(ρref ,in−ρref ,fn)Vref + (ρcelln−1−ρcelln)Vcell] (3.3)
qnetn =
mnetn
ms×M(CO2)
C
h
a
p
t
e
r
4
E x p e r i m e n t a l R e s u lt s a n d D i s c u s s i o n
This chapter presents the results and analysis of the experimental work performed. Two different methods were used to shape the MOF MIL-53(Al) powder: binderless (by me-chanical compression) and with binder (by extrusion). Both methods and the results obtained are discussed and compared bellow. Several characterization analysis of the samples and their comparisons with the primary powdered material were performed. Mechanical characterization (pressure/depressurization, abrasion and drop tests), struc-tural and physico-chemical characterization (XRD analysis, TGA and He pycnometry) and adsorption equilibrium measurements are reported.
4.1 Shaping MIL-53(Al)
4.1.1 Binderless Shaping
Two different samples were obtained using this method: one batch compressed at 1tf
force and another compressed at 0.5tf. Both samples are visually identical (Figure 4.1). These forces were used for two reasons: i) when testing this method with activated carbon the pellets with more than 1tf compression were very brittle and fragile; ii) a previous study preformed with another MOF, ZIF-8, showed that with a compression of 0.5tf, the BET surface area of the MOF is completely preserved, with a compression of 1tf only 4.1% of the BET surface area is lost, while with forces above this range losses are above 10% in comparison to the powdered ZIF-8 [18].
C H A P T E R 4 . E X P E R I M E N TA L R E S U LT S A N D D I S C U S S I O N
a larger quantities of material and also the amount of waste of the adsorbent that is produced, since when crushing the pellets into smaller bodies, part of the material is crushed into very fine particles that can not be further used for this method.
Table 4.1: Binderless MIL-53(Al) Samples and Observations.
Batch Force Sieve Observations
(tf) (mm)
A1 1 1 - 2 Consistent particles with irregular shapes
A2 0.5 1 - 2 Consistent particles with irregular shapes
(a) (b)
Figure 4.1: MIL-53(Al) Binderless Samples: (a) Batch A1; (b) Batch A2.
4.1.2 Shaping with Binder
Mixtures with different PVA aqueous solutions and with distinct viscosities were
pre-pared. Seven samples were obtained (Table 4.2), although only four showed potential (B1, B3, B5 and B7) from a mechanical point of view. These samples when extruded with the syringe into "spaghetti" like shape maintained their form and when dried were easy to break into smaller pellet like particles. Therefore batches B1, B3, B5 and B7 (Figure 4.3) were the binder containing samples that were selected for further study of their mechani-cal, physico-chemical and adsorptive characteristics. The other batches (B2, B4 and B6) resulted into very fluid mixtures that when extruded did not keep the desired shape. For this reason, these were set aside and no further characterizations were performed (Figure 4.2).
The main challenge of this method was to get the right mixture and viscosity to obtain an uniform extrudate. The composition of the mixtures can vary from material to material, for example the same method was applied with another MOF, namely ZIF-8, and using also PVA aqueous solutions as a binder, the obtained extrudates were not as uniform and easily obtained [75]. Therefore it can be concluded that although this method shows good results with MIL-53(Al) when applying to a different powder adjustments to