Mestre em Engenharia Civil
Robustness Analysis of Structures in
Post-Earthquake Scenarios Considering
Multiple Hazards
Dissertação para obtenção do Grau de Doutor em Engenharia Civil
Orientador: Prof. Doutor Luís Armando Canhoto Neves
Professor Auxiliar, Faculdade de Ciências e
Tecnologia, Universidade Nova de Lisboa, Portugal
Co-orientador: Prof. Doutor André Ramos Barbosa
Professor Auxiliar, School of Civil and Construction Engineering, Oregon State University, E.U.A.
Júri:
Presidente: Prof. Doutor Fernando Manuel Anjos Henriques
Arguentes: Prof. Doutora Rita Nogueira Leite Pereira Bento Prof. Doutor Eduardo Soares Ribeiro Gomes Cavaco
Vogais: Prof. Doutor Luís Manuel Soares dos Santos Castro Prof. Doutor José Miguel de Freitas Castro
Prof. Doutor Filipe Pimentel Amarante dos Santos
Neves e do Doutor André R. Barbosa.
“Copyright” © 2016 Filipe Luís Alves Ribeiro, Faculdade de Ciências e Tecnologia, Uni-versidade Nova de Lisboa
This work is the result of a four-year research that could not have been possible without the support of several people to whom I would like to dedicate some words.
First of all, I would like to thank my advisor, Professor Luís Canhoto Neves, his patience, incentive, joy in developing research, and friendship. The advice he gave me, both technical and personal, as well as his experience, were fundamental and helped me discovering and exploring this new world of research. I am also thankful for the opportunity of studying at the University of Nottingham. The period I spent there was a catalyst of new projects and ideas. I do not forget the opportunity Professor Luís Neves created for me to continue developing my work there. This time at Nottingham was particularly pleasant due to his support and friendship, as well as his family.
I am also very thankful to my co-advisor, Professor André Ramos Barbosa, who is a reference that I have always tried to follow. His participation in this work was absolutely fundamental. In spite of the distance that separated us during most of the time period of this research, Professor André Barbosa have always been available and actively participating in the development of numeral analysis. His knowledge and experience in this field were the light that guided me throughout this time. The time I spent at the Oregon State University (OSU) was a very important first step in the development of this work. The opportunity to study of the OSU was unique, both in the professional and personal point of view. I have to thank him for this and so many other opportunities that him and his proactivity, excellence, and tenacity, helped me figuring out. I have to mention and truly thank the long hours we spent skyping at early or late hours in the US. I also thank his active and key participation in the workshop OpenSees Days Portugal 2014, and in my Research Plan defense.
I cannot forget the support of Professor Rita Bento and Professor José Miguel Castro. Their help and availability during the course of this work were great, as well as their support and valuable input in the evaluation moments, such as the defense of the research plan. I thank Professor Rita Bento for welcoming me in Instituto Superior Técnico and giving me the chance to attend some lectures there. I also thank Professor José Miguel Castro for the mentoring, active participation and support in the OpenSees Days Portugal 2014. Without his and Professor Xavier Romão help it could not have been possible to organize the workshop and bring to Portugal dozens of researchers.
I would like to thank to other Professor and researchers who helped me at various stages of this research. I thank Professor Michael H. Scott, Professor Eduardo Cavaco, Professor Filipe Santos, Professor Corneliu Cismasiu, Professora Ildi Cismasiu, Professor João Rocha de Almeida, Professor António Pinho Ramos, and Professor Válter Lúcio.
chal-with mu colleague Rúben Rosário. I started to collaborate chal-with him in 2013 during his master thesis and since then his help has been really important to this work, namely in what concerns structural fire analysis. I also thank Sérgio Domingues, with whom I collaborated in his master thesis. I thank them for their patience and friendship and for not giving up towards the adversities that came into our way.
I thank to my colleagues at the universities I have been during this period. The share of ideas, motivation, mutual help, and fun are some of the most important memories that will remain in my memory. I thank Hugo Fernandes, Renato Pereira, Leonardo Rodrigues, Cláudia Ferreira, Nuno Deusdado, André Oliveira, Fernando Jorne, Nuno Mamede, An-dré Rodrigues, Micael Inácio, Mariana Barros, Hugo Silva, Pedro Saldanha Santos, AnAn-dré Belejo, Therese Pflaum, Mohsen, Ravi Challa, Simon Stubbs, and many others that have seen our paths crossed.
The support of Faculdade de Ciências e Tecnologia of NOVA Lisbon University is greatly acknowledged. I have spent the last nine years as a student at NOVA University. I am proud to say that I take with me amazing memories and experiences. In spite of all contingencies NOVA University is the best. I also thank the support of the Oregon State University and the University of Nottingham during the time I spent at each of them. The support of Engineering Faculty of Porto University in the organization of the OpenSees Days Portugal 2014 is also greatly acknowledged.
The support of the Portuguese Science and Technology Foundation, from the Ministry of Science, Technology, and Higher Education, which financed this work through an indi-vidual doctoral grant is also acknowledged. My choice to stay in Portugal was hard but I conscientiously think that I am able and I want to support the development of my beloved country and return the investment that was made in my own development.
A sincere acknowledgment has to be made toProfico - Projetos, Fiscalização e Consul-toria, Lda., in particular to Eng. Jorge Meneses and to Eng. Carlos Lopes, who gave me the opportunity to continue my learning process after the Ph.D., as a Structural Engineer. I truly hope that my time at Profico will be full of success for many and good years.
I want to thank my friends, for the moments of fun, joy, and emotion that inspired me and gave me energy to complete this work. A special work for Filipe Pereira, for his friendship and incentive at all times.
Finally, but not less important, I want to thank the infinite love, support, incentive and comfort of my family, in particular to my parents, sister, and grandmother. They are a central key in my whole life and, of course, in the course of this work. The example and the advice they give me are essential to me, and without them I would not have followed this path.
At last, the biggest of all acknowledgments is due to my precious and beloved wife, Rosa, whose generosity, altruism, love, and infinite patience and support, I am not able to describe by words. She has been always by my side and I hope she will always be. No words exist to describe my gratitude and love.
Recent earthquakes have highlighted that the consideration of isolated seismic events, al-though necessary, may not be sufficient to prevent building collapse. In fact, the occurrence of a large number of aftershocks with significant intensity, as well as the occurrence of tsunamis, fires, and explosions, poses a safety threat that has not been addressed properly in the design and assessment of building structures over the last decade. Although research has been developed in order to evaluate the impact of multiple and/or cascading hazards in structural safety and economical losses, there is no established framework to perform such analysis. In addition, the available numerical tools lack a unified implementation in a widely used software in order to allow for the development of large numerical simulations involving these hazard events.
This work proposes a probabilistic framework for quantifying the robustness of struc-tures considering the occurrence of a major earthquake (mainshock) and the subsequent cas-cading hazard events, namely fire and aftershocks. These events can significantly increase the probability of collapse of buildings, especially for structures that are damaged during the mainshock. In order to assess the structural performance under post-earthquake hazards, it is of paramount importance to accurately simulate the damage attained during the earth-quake, which is strongly correlated to the residual structural capacity to withstand cascading events. In this context, the influence of ground motion characteristics, namely ground mo-tion duramo-tion, has been identified as one of the parameters that may induce significant bias on damage patterns associated with the mainshock. Thus, ground motion duration influence on structural damage is analyzed in this work.
Steel moment resisting frame buildings designed according to pre-Northridge codes are analyzed using the proposed framework. These buildings are representative of the design practice in the US and Europe for decades, and the conclusions of this work can be signif-icant in the assessment/retrofit of thousands of buildings. Fragility curves and reliability-based robustness measures are obtained using the proposed framework. The fragility curve parameters obtained herein can be used in the development of future probabilistic-based studies considering post-earthquake hazards. The results highlight the importance of the post-earthquake hazard events in the structural safety assessment. Further work is needed in order to better characterize these hazards as to include them in the code-based design and assessment methodologies.
Keywords:
Título em Português: Análise da Robustez de Estruturas em Cenários Pós-Sismo Con-siderando Exposições Múltiplas
Nas últimas décadas a ocorrência de eventos sísmicos de elevada intensidade tem ex-posto a necessidade de considerar os eventos secundários que normalmente se seguem ao sismo principal, i.e. ao sismo de maior intensidade. Estes eventos secundários, como ré-plicas do sismo principal, incêndios, tsunamis e explosões, colocam em risco os edifícios que, resistindo ao sismo principal, se encontrem danificados e, consequentemente, com a sua capacidade resistente diminuída face ao considerado em projeto. Embora tenham sido desenvolvidos recentemente esforços no sentido de desenvolver métodos de análise e di-mensionamento que consideram eventos múltiplos e/ou sequenciais, não se encontra es-tabelecida nenhuma ferramenta de análise para avaliar a segurança estrutural em cenários pós-sismo. Além disso, para executar tal avaliação é necessário dispor de modelos numéri-cos cuja implementação em ferramentas de simulação estrutural permitam a realização de análises neste tipo de cenários.
Neste trabalho é desenvolvida uma nova metodologia probabilística de análise da ro-bustez de estruturas considerando a ocorrência de um evento sísmico (sismo principal) e de eventos secundários, nomeadamente réplicas e fogo. De modo a avaliar a resposta es-trutural em cenários pós-sismo é fundamental que o dano induzido pelo sismo principal seja simulado de forma fidedigna. A capacidade resistente residual pós-sismo encontra-se correlacionada com o dano estrutural devido ao sismo. Assim, as características do sismo principal, em particular a sua duração, e a sua influência no dano estrutural é estudada neste trabalho.
List of Figures ix
List of Tables xvii
List of Abbreviations and Symbols xix
1 Introduction 1
1.1 Background and Motivation . . . 1
1.2 Objectives and Tasks . . . 3
1.3 Thesis Organization . . . 5
1.4 Resilience to Catastrophic Events . . . 10
1.5 Structural Robustness . . . 15
1.6 Performance-Based Earthquake Engineering . . . 20
2 Development of Enhanced Finite Element Models for Seismic Analysis. Part I: Formulation 33 2.1 Scope . . . 33
2.2 Introduction . . . 33
2.3 Literature Review . . . 34
2.4 Calibration of Force-Based Finite-Length Plastic Hinge Elements . . . 40
2.5 Numerical Examples . . . 45
2.6 Conclusion . . . 51
2.7 Dissemination . . . 52
3 Development of Enhanced Finite Element Models for Seismic Analysis. Part II: Implementation 55 3.1 Scope . . . 55
3.2 Introduction . . . 55
3.3 Literature Review . . . 56
3.4 Implementation of ModIMK Models for Cyclic Analysis . . . 59
3.5 Numerical Examples . . . 64
3.6 Conclusion . . . 72
3.7 Dissemination . . . 76
4 Influence of Connections Brittle Fractures on Structural Fragility 77 4.1 Scope . . . 77
4.2 Introduction . . . 77
4.4 Model Development . . . 81
4.5 Analysis Methodology . . . 88
4.6 Case Study Description . . . 89
4.7 Deterministic Performance Assessment . . . 91
4.8 Sensitivity Assessment of Fracture Model Parameters . . . 93
4.9 Probabilistic Analysis . . . 96
4.10 Conclusion . . . 109
4.11 Dissemination . . . 110
5 Influence of Ground Motion Duration on Structural Damage 111 5.1 Scope . . . 111
5.2 Introduction . . . 111
5.3 Literature Review . . . 112
5.4 Ground Motion Selection . . . 113
5.5 Building Models . . . 119
5.6 Analysis Methodology . . . 122
5.7 Preliminary Results and Damage Assessment Calibration . . . 124
5.8 Deformation and Energy Demands . . . 126
5.9 Damage Assessment . . . 132
5.10 Influence of Duration on Deformation-Damage Relationships . . . 135
5.11 Conclusion . . . 139
5.12 Dissemination . . . 140
6 Robustness Assessment of Structures Considering Post-Earthquake Aftershocks141 6.1 Scope . . . 141
6.2 Introduction . . . 141
6.3 Literature Review . . . 143
6.4 Framework . . . 144
6.5 Building models . . . 148
6.6 Analysis Description . . . 155
6.7 Deterministic Nonlinear Dynamic Time-History Response Analysis . . . . 159
6.8 Robustness Assessment Results . . . 162
6.9 Fragility Curves and Repair Cost Estimation . . . 166
6.10 Conclusion . . . 167
6.11 Dissemination . . . 174
7 Robustness Assessment of Structures Considering Post-Earthquake Fire 177 7.1 Scope . . . 177
7.2 Introduction . . . 177
7.3 Literature Review . . . 178
7.4 Framework . . . 182
7.5 Sensitivity Study on Structural Fire Response . . . 183
7.6 Incremental Fire Analysis . . . 194
7.7 Conclusion . . . 199
8 Conclusions 203
8.1 Work Overview . . . 203 8.2 Main Outcomes . . . 204 8.3 Limitations and Future Developments . . . 206
Bibliography 209
Appendix 229
A Chapter 2 - Computation of the Section Flexural Stiffness Modification
Param-eters 229
1.1 A three-story RC building collapsed during an aftershock (M5.7) of the 2010 M6.2 Taiwan earthquake (left; source: NCREE) and a fire at an oil refinery
after the 2011 Tohoku earthquake (right; source: The Times) . . . 2
1.2 PhD research program - general outline . . . 6
1.3 PhD research program - part I outline . . . 7
1.4 PhD research program - part II outline . . . 8
1.5 PhD research program - part III outline . . . 9
1.6 Representation of the functionality function (adapted from Bruneauet al.[6]) 11 1.7 Example of performance targets associated with a university campus . . . . 13
1.8 Resilience diagram [6] . . . 14
1.9 Partial collapses of the Ronan Point Building (left) and the Charles de Gaulle Airport Terminal (right) . . . 16
1.10 Interaction Diagram - Graphical representation of the capacity over demand ratio to simultaneous hazard events (adapted from [21]) . . . 20
1.11 Performance Objectives in a performance-based approach (adapted from [40]) 21 1.12 Framework for performance-based assessment of structural (adapted from [42]) . . . 22
1.13 Characterization of intensity measure (IM) as: (a) total annual frequency of exceedance; (b) probability of exceedance in T years; and (c) probability of occurrence in T years (adapted from [40]) . . . 24
1.14 Representation of damage measures (DM) as: (a) fragility curves (POE of DM|EDP); (b) probability of exceedance of DM (P(DM|EDP)); and (c) probability of DM (P(DM|EDP)) . . . 26
1.15 Assessment of the efficiency of dynamic structural analysis for computing fragility curves . . . 29
2.1 Representation of member simulation approaches used in this work . . . 35
2.2 Computed elastic flexibility coefficient of concentrated plasticity model ver-sus rigid-plastic approximation of end springs . . . 37
2.3 Basic system for two-dimensional frame elements . . . 38
2.4 Modified Gauss-Radau integration scheme . . . 40
2.5 Modified Gauss-Radau integration scheme with section flexural stiffness modification parameters . . . 41
2.6 Flexural stiffness modification parametersβ1, β2andβ3 as a function of the plastic hinge length to span ratioLp/L . . . 43
2.9 Moment-rotation model proposed by Lignos and Krawinkler [4] . . . 45 2.10 Example 1 - basic system with equal moments at both ends and plastic hinge
lengthLp/L= 1/16 . . . 47
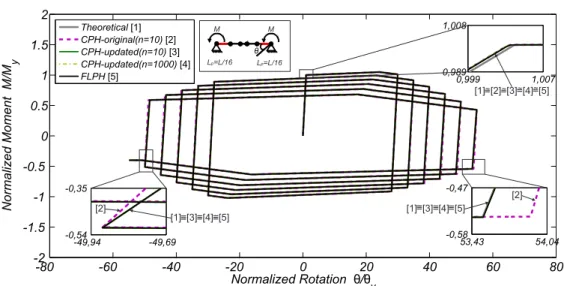
2.11 Example 1 - basic system with equal moments at both ends and plastic hinge lengthLp/L= 1/10 . . . 47
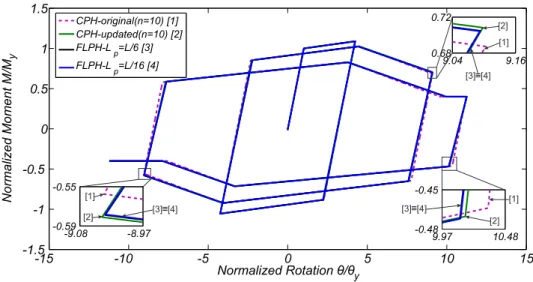
2.12 Example 1 - basic system with equal moments at both ends and plastic hinge lengthLp/L= 1/6 . . . 48
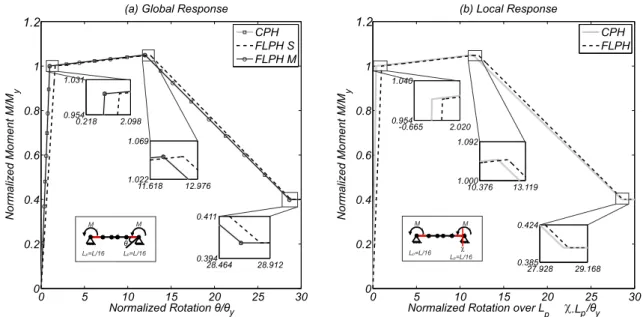
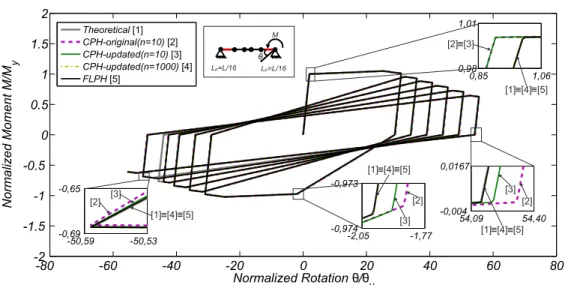
2.13 Example 2 - basic system with different moments at both ends and plastic hinge lengthLp/L= 1/16 . . . 49
2.14 Example 2 - basic system with different moments at both ends and plastic hinge lengthLp/L= 1/10 . . . 49
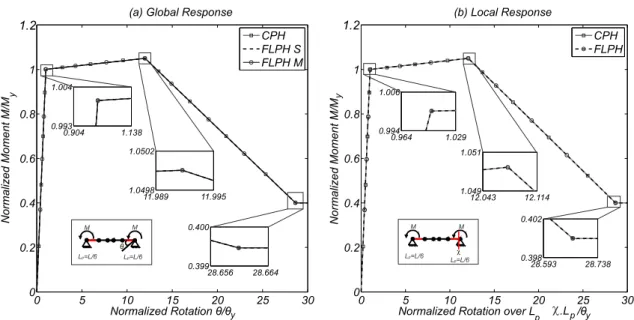
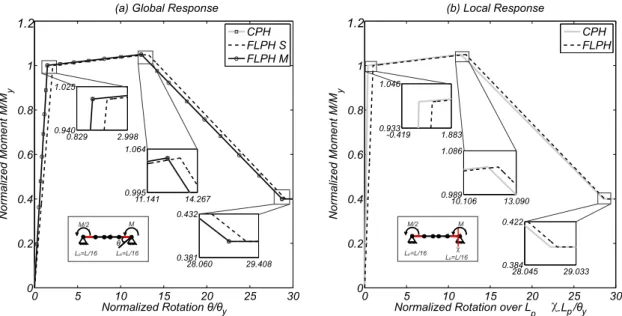
2.15 Example 2 - basic system with different moments at both ends and plastic hinge lengthLp/L= 1/6 . . . 50
2.16 Errors in the slopes of the elastic, hardening and softening regions for the
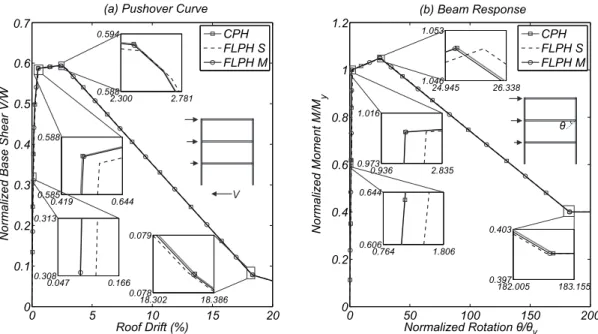
CPH,FLPH SandFLPH M models during a monotonic analysis . . . 50 2.17 Steel moment frame . . . 51 2.18 Example three-story frame used to demonstrate the proposed calibration
procedures . . . 52
3.1 Modified Ibarra-Medina-Krawinkler deterioration models: (a) backbone curve, (b) Bilin model, (c) Peak-oriented model, and (d) Pinching model. . . 57 3.2 General procedure for updating model parameters during cyclic analysis . . 60 3.3 Procedure for updating post-yielding ratio during cyclic analysis for
Con-centrated Plasticity Hinge model . . . 61 3.4 Procedure for updating reloading stiffness during cyclic analysis for
Con-centrated Plasticity Hinge model . . . 63 3.5 Pinching model - cyclic analysis considering a single end moment . . . 65 3.6 Pinching model - cyclic analysis considering anti-symmetric end moments . 66 3.7 Pinching model - cyclic analysis considering symmetric end moments . . . 66 3.8 Peak-oriented model - cyclic analysis considering a single end moment . . 67 3.9 Peak-oriented model - cyclic analysis considering anti-symmetric end
mo-ments . . . 67 3.10 Peak-oriented model - cyclic analysis considering symmetric end moments 68 3.11 Bilin model - cyclic analysis considering a single end moment . . . 68 3.12 Bilin model - cyclic analysis considering anti-symmetric end moments . . . 69 3.13 Bilin model - cyclic analysis considering symmetric end moments . . . 69 3.14 Comparison of error in the elastic stiffness for CPH-updated with different
values ofnF actor and FLPH . . . 70
3.15 Convergence stability analysis using the Bilin model . . . 71 3.16 Three-story steel moment frame analyzed with the implemented models . . 71 3.17 Cyclic pushover analysis of the 3-story frame with the ModIMK Pinching
model . . . 72 3.18 Cyclic pushover analysis of the 3-story frame with the ModIMK
Peak-oriented model . . . 73 3.19 Cyclic pushover analysis of the 3-story frame with the ModIMK Bilin model 73 3.20 Beam response during the cyclic pushover analysis of the 3-story frame with
3.21 Beam response during the cyclic pushover analysis of the 3-story frame with
the ModIMK Peak-oriented model . . . 74
3.22 Beam response during the cyclic pushover analysis of the 3-story frame with the ModIMK Bilin model . . . 75
4.1 Typical pre-Northridge WFBW connection detail [143] . . . 78
4.2 Fracture model developed by Luco and Cornell (2000) . . . 80
4.3 Conceptual description of the proposed modeling approach . . . 83
4.4 Illustrative example of the modeling approach behavior . . . 84
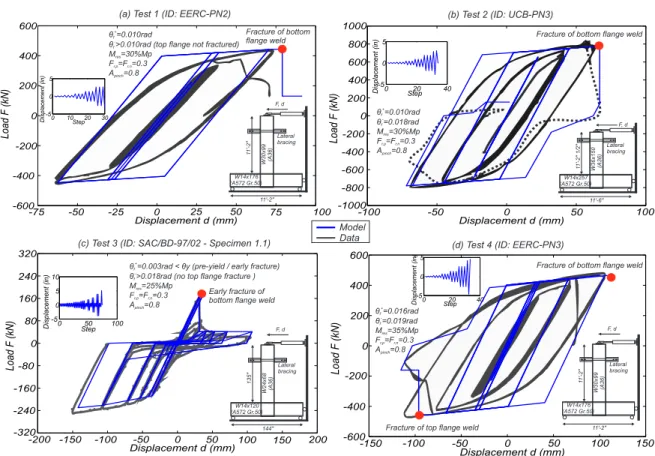
4.5 Numerical analyses performed to validate the modeling approach using four SAC Project tests . . . 86
4.6 Median and standard deviation of the fracture rotation of the connections for the two hundred samples of: (a) LA3 building; and (b) LA9 building . . 89
4.7 Median response spectra of the 10/50 SAC ground motion set . . . 90
4.8 (a) LA3 building; (b) LA3 Sections, Model Parameters, and Floor Masses; (c) LA9 building; and (d) LA9 Sections, Model Parameters, and Floor Masses. 91 4.9 LA3 building - Time-history response: (a) ground motion acceleration; (b) peak IDR obtained with the rigid connection model; (c) peak IDR obtained with the brittle connection model; (d) beam moment-rotation response ob-tained with the rigid connection model; and (e) beam moment-rotation re-sponse obtained with the brittle connection model. . . 93
4.10 LA3 building - (a) Fractured connections; and (b) variation in the periods of vibration. . . 94
4.11 LA9 building - Time-history response: (a) ground motion acceleration; (b) peak IDR obtained with the rigid connection model; (c) peak IDR obtained with the brittle connection model; (d) beam moment-rotation response ob-tained with the rigid connection model; and (e) beam moment-rotation re-sponse obtained with the brittle connection model. . . 95
4.12 LA9 building - (a) Fractured connections; and (b) variation in the periods of vibration. . . 96
4.13 Pushover analysis with different connection fractures rotations: (a) LA3 building; and (b) LA9 building . . . 96
4.14 Nonlinear dynamic analysis with different connection fractures rotations: (a) LA3 building; and (b) LA9 building . . . 97
4.15 LA3 building - peak IDR associated with: (a) brittle connection model; and (b) rigid connection model . . . 97
4.16 LA3 building - (a) Ratio of the peak IDR obtained with the brittle connection model and the rigid connection model; and (b) standard deviation of the peak IDR at each intensity level for the two models . . . 98
4.17 LA3 building - percentage of fractured connections (PFC) . . . 98
4.18 LA3 building - percentage of fractured connections histogram . . . 99
4.19 LA3 building - distribution of fractured connections in the building as a function of intensity level . . . 100
4.20 LA3 building - distribution of fractured connections in the building as a function of peak IDR . . . 100
4.22 LA9 building - peak IDR associated with: (a) brittle connection model; and (b) rigid connection model . . . 102 4.23 LA9 building - (a) Ratio of the peak IDR obtained with the brittle connection
model and the rigid connection model; and (b) standard deviation of the peak IDR at each intensity level for the two models . . . 102 4.24 LA9 building - percentage of fractured connections (PFC) . . . 103 4.25 LA9 building - percentage of fractured connections histogram . . . 104 4.26 LA9 building - distribution of fractured connections in the building as a
function of intensity level . . . 105 4.27 LA9 building - distribution of fractured connections in the building as a
function of peak IDR . . . 106 4.28 LA9 building - peak IDR as a function of the percentage of fractured
con-nections (PFC) . . . 107 4.29 LA3 building - fragility curves and repair cost ratio (RCR) estimation . . . 108 4.30 LA9 building - fragility curves and repair cost ratio (RCR) estimation . . . 108
5.1 Ground motion records characteristics and correlation . . . 114 5.2 Ground motion spectral acceleration at the fundamental period of the
in-tact structures versus significant duration for: (a) SEA3 Building; (b) SEA9 Building; and (c) SEA20 Building . . . 115 5.3 Comparison of the response spectra associated with the Subduction Zone
and Shallow Crustal ground motion sets: (a) unscaled Subducton ground motions; (b) unscaled Crustal ground motions; (c) selected 10 Subduction ground motions (unscaled); and (d) selected and scaled Crustal ground mo-tions. . . 116 5.4 SEA9 Building: Comparison of the Suduction Zone and Shallow Crustal
ground motion pair number 8: (a) Response Spectra; (b) Shallow Crustal Ground Motion; and (c) Subduction Zone Ground Motion . . . 116 5.5 SEA20 Building: Comparison of the Suduction Zone and Shallow Crustal
ground motion pair number 6: (a) Response Spectra; (b) Shallow Crustal Ground Motion; and (c) Subduction Zone Ground Motion . . . 117 5.6 SEA3 Building: Comparison of the Median Acceleration Response Spectra
of the Subduction Zone and the Shallow Crustal Selected Ground Motions . 117 5.7 Two-Dimensional Models of Steel Moment Resisting Frames Buildings in
Seattle : (a) SEA3 Building; (b) SEA3 Sections, Model Parameters, and Floor Masses; (c) SEA9 Building; (d) SEA9 Sections, Model Parameters, and Floor Masses; (e) SEA20 Building; (f) SEA20 Sections, Model Param-eters, and Floor Masses . . . 120 5.8 Nonlinear Static Pushover Capacity Curves Considering a1stMode Lateral
Load Pattern: (a) SEA3 Building; (b) SEA9 Building; (c) SEA20 Building . 122 5.9 Peak interstory drift ratio as a function of the significant durationD5−75and
spectral acceleration Sa(T1) for the 44 unscaled ground motions for: (a)
SEA3 Building; (b) SEA9 Building; and (c) SEA20 Building . . . 124 5.10 Park and Ang Structural Damage indexDIstructural
P A as a function of the
sig-nificant durationD5−75and spectral accelerationSa(T1)for the 44 unscaled
5.11 SEA3 Building: Damage indices as a function of the significant duration D5−75and spectral accelerationSa(T1)for the 44 unscaled ground motions:
(a) Park and Ang maximum damage indexDIP Amax,element; (b) Reinhorn and Valles Structural Damage index DIstructural
RV ; and (c) Reinhorn and Valles
maximum damage indexDIRVmax,element . . . 125 5.12 SEA3 Building: Response obtained with ground motion pair number 6 (with
scaled crustal ground motion) in terms of Interstory Drift Ratio and ratio between energy dissipated and total energy dissipation capacity (Eh/Etot)
for a specific plastic hinge at each story level . . . 127 5.13 SEA9 Building: Response obtained with ground motion pair number 8 (with
scaled crustal ground motion) in terms of Interstory Drift Ratio and ratio between energy dissipated and total energy dissipation capacity (Eh/Etot)
for a specific plastic hinge at each story level . . . 128 5.14 SEA20 Building: Response obtained with ground motion pair number 6
(with scaled crustal ground motion) in terms of Interstory Drift Ratio and ra-tio between energy dissipated and total energy dissipara-tion capacity (Eh/Etot)
for a specific plastic hinge at each story level . . . 129 5.15 Peak Interstory Drift Ratio (Peak IDR) obtained through Incremental
Dy-namic Analysis: (a) SEA3 Building; (b) SEA9 Building; and (c) SEA20 Building . . . 130 5.16 Residual Interstory Drift Ratio (RIDR) obtained through Incremental
Dy-namic Analysis: (a) SEA3 Building; (b) SEA9 Building; and (c) SEA20 Building . . . 131 5.17 Median Ratio of the Energy Dissipated to the Total Energy Dissipation
Ca-pacity (Eh/Etot) at Each Plastic Hinge Section and Median Interstory Drift
Ratio (IDR) at Each Story for a Spectral Acceleration Corresponding to the Seattle MCE intensity levels: (a) SEA3 Building at Sa(T1) = 0.56
g; (b) SEA9 Building at Sa(T1) = 0.21 g; and (c) SEA20 Building at
Sa(T1) = 0.15g . . . 133
5.18 Median Park and Ang Damage Index at Each Element for a Spectral Ac-celeration Corresponding to the Seattle MCE Intensity Levels: (a) SEA3 Building at Sa(T1) = 0.56g; (b) SEA9 Building at Sa(T1) = 0.21g; and
(c) SEA20 Building atSa(T1) = 0.15g . . . 134
5.19 Comparison of the Median Damage Indices Recorded in the Analyses Car-ried Out With Shallow Crustal and Subduction Zone Ground Motion: (a) Structural Index; and (b) Median Maximum Element Value . . . 135 5.20 SEA3 Building: Median Damage Indices as a Function of the Median Peak
Interstory Drift Ratio for Shallow Crustal and Subduction Zone Ground Mo-tions: (a) Park and Ang Damage Index (DIP A); and (b) Reinhorn and Valles
Damage Index (DIRV) . . . 136
5.21 SEA3 Building: Damage Indices as a Function of the Peak Interstory Drift Ratio for Ground Motion Pair Number 6: (a) Park and Ang Damage Index (DIP A); and (b) Reinhorn and Valles Damage Index (DIRV) . . . 136
5.22 SEA9 Building: Median Damage Indices as a Function of the Median Peak Interstory Drift Ratio for Shallow Crustal and Subduction Zone Ground Mo-tions: (a) Park and Ang Damage Index (DIP A); and (b) Reinhorn and Valles
5.23 SEA9 Building: Damage Indices as a Function of the Peak Interstory Drift Ratio for Ground Motion Pair Number 8: (a) Park and Ang Damage Index (DIP A); and (b) Reinhorn and Valles Damage Index (DIRV) . . . 137
5.24 SEA20 Building: Median Damage Indices as a Function of the Median Peak Interstory Drift Ratio for Shallow Crustal and Subduction Zone Ground Mo-tions: (a) Park and Ang Damage Index (DIP A); and (b) Reinhorn and Valles
Damage Index (DIRV) . . . 138
5.25 SEA20 Building: Damage Indices as a Function of the Peak Interstory Drift Ratio for Ground Motion Pair Number 6: (a) Park and Ang Damage Index (DIP A); and (b) Reinhorn and Valles Damage Index (DIRV) . . . 138
6.1 Event tree considering cascading hazard events following a mainshock . . . 145 6.2 Flowchart for the robustness assessment of buildings subjected to cascading
seismic events . . . 146 6.3 Variation of the proposed rosbustness factor (RF) as a function of the ratio
bewteen the failure probability of the intact and the damaged structure . . . 149 6.4 Two-Dimensional Models of Steel Moment Resisting Frames Buildings in
Los Angeles : (a) LA3 Building; (b) LA3 Sections, Model Parameters, and Floor Masses; (c) LA9 Building; (d) LA9 Sections, Model Parameters, and Floor Masses; (e) LA20 Building; (f) LA20 Sections, Model Parameters, and Floor Masses . . . 150 6.5 Fiber section P-M interaction curve . . . 152 6.6 LA3 building - Nonlinear static (pushover) capacity curve considering a1st
mode lateral load pattern . . . 153 6.7 LA9 building - Nonlinear static (pushover) capacity curve considering a1st
mode lateral load pattern . . . 153 6.8 LA20 building - Nonlinear static (pushover) capacity curve considering a
1stmode lateral load pattern . . . 154
6.9 LA3 building - Correlation in the story of maximum interstory drift ratio between modelsF ZLHandF MRH, and FEMA355C (2000) models M1 155 6.10 LA9 building - Correlation in the story of maximum interstory drift ratio
between modelsF ZLHandF MRH, and FEMA355C (2000) models M1 156 6.11 LA20 building - Correlation in the story of maximum interstory drift ratio
between modelsF ZLHandF MRH, and FEMA355C (2000) models M1 156 6.12 RMSE associated with roof acceleration and displacement as a function of
the analysis time-step (considering5×10−5 as reference time-step) . . . . 158 6.13 LA3 building - Example of a mainshock-aftershock back-to-back
accelera-tion and drift response time-histories . . . 159 6.14 LA3 building hinge moment-rotation response at: (a) bottom of first story
in grid line A; (b) left end of first floor level beam A-B . . . 160 6.15 LA9 building - Example of a mainshock-aftershock back-to-back
accelera-tion and drift response time-histories . . . 160 6.16 Deformed shapes of the buildings at two different instants: (a,c,d) - Peak
interstory drift ratio during the mainshock; and (b,d,f) - Peak interstory drift ratio during the aftershock, for LA3, LA9 and LA20, respectively. . . 161 6.17 LA3 building - AIDA curves for ten earthquake records and four different
6.18 LA9 building - AIDA curves for ten earthquake records and four different mainshock ground motion spectral accelerations . . . 163 6.19 LA20 building - AIDA curves for ten earthquake records and four different
mainshock ground motion spectral accelerations . . . 163 6.20 LA3 building - Post-mainshock pushover curves for three mainshock
inten-sities . . . 164 6.21 LA3 building - Aftershock ground motion spectral acceleration at the
fun-damental period of the intact structure that leads to failure as a function of the mainshock ground motion spectral acceleration for earthquake E5 . . . 165 6.22 Median lowest aftershock ground motion spectral acceleration at the
fun-damental period of the intact structure that leads to failure (solid line and left vertical axis) and median residual interstory drift ratio after mainshock (dashed line and right vertical axis) as a function of the median mainshock ground motion spectral acceleration . . . 165 6.23 LA3 building - Aftershock fragility curves: (a) Slight DS; (b) Moderate DS;
(c) Extensive DS; and (d) Complete DS . . . 168 6.24 LA3 building - Variation of the aftershock fragility curve parameters as a
function of the mainshock spectral acceleration: (a) variation of the θ pa-rameter; (b) variation of the β parameter; (c) ratio θ/θSm=0; and (d) ratio
β/βSm=0 . . . 169
6.25 LA3 building - Estimated structural repair cost ratio as a function of the aftershock spectral acceleration . . . 169 6.26 LA9 building - Aftershock fragility curves: (a) Slight DS; (b) Moderate DS;
(c) Extensive DS; and (d) Complete DS . . . 170 6.27 LA9 building - Variation of the aftershock fragility curve parameters as a
function of the mainshock spectral acceleration: (a) variation of the θ pa-rameter; (b) variation of the β parameter; (c) ratio θ/θSm=0; and (d) ratio
β/βSm=0 . . . 171
6.28 LA9 building - Estimated structural repair cost ratio as a function of the aftershock spectral acceleration . . . 171 6.29 LA20 building - Aftershock fragility curves: (a) Slight DS; (b) Moderate
DS; (c) Extensive DS; and (d) Complete DS . . . 172 6.30 LA20 building - Variation of the aftershock fragility curve parameters as
a function of the mainshock spectral acceleration: (a) variation of the θ parameter; (b) variation of theβ parameter; (c) ratioθ/θSm=0; and (d) ratio
β/βSm=0 . . . 173
6.31 LA20 building - Estimated structural repair cost ratio as a function of the aftershock spectral acceleration . . . 173
7.1 Probabilistic framework for performance-based structural engineering for fire following earthquake . . . 182 7.2 Thermomechanical model of Eurocode 3 and proposed models by
Kho-rasaniet al.[240] for deterioration of: (a) Young’s modulus; (b) yield strength; and (c) thermal elongation. . . 185 7.3 Verification example: (a) time-temperature curve; and (b) vertical
7.5 Tornado diagrams for fire scenario 1: (a) normalized peak horizontal deflec-tion; (b) normalized peak vertical deflecdeflec-tion; (c) normalized residual hori-zontal deflection; (d) normalized residual vertical deflection. . . 190 7.6 Tornado diagrams associated with post-fire analyses for fire scenario 1: (a)
pushover analysis; and (b) pushdown analysis. . . 190 7.7 Dispersion index associated with: (a) peak horizontal deflection; (b) peak
vertical deflection; (c) residual horizontal deflection; (d) residual vertical deflections; (e) post-fire pushover load; and (f) post-fire pushdown load. . . 191 7.8 Case Study 2: (a) structural model; (b) to (k) show fire scenarios 1 to 10. . . 192 7.9 Dispersion index associated with the peak and residual horizontal
deflec-tions: (a) and (d) scenarios 1, 2, 3, and 8; (b) and (e) scenarios 1, 4, 5, and 9; and (c) and (f) scenarios 1, 6, 7, and 10. . . 193 7.10 Dispersion index associated with the peak and residual vertical deflections:
(a) and (d) scenarios 1, 2, 3, and 8; (b) and (e) scenarios 1, 4, 5, and 9; and (c) and (f) scenarios 1, 6, 7, and 10. . . 193 7.11 Dispersion index associated with the pushover and pushdown forces: (a)
and (d) scenarios 1, 2, 3, and 8; (b) and (e) scenarios 1, 4, 5, and 9; and (c) and (f) scenarios 1, 6, 7, and 10. . . 194 7.12 Tornado diagrams associated with post-fire pushdown with the modified
load pattern (single bay loads) for: (a) fire scenario 1; and (b) fire scenario 2. 195 7.13 Radar plot and deformed shapes (amplification factor of 10) illustrating the
influence of load distribution in pushdown analysis for fire scenarios 1 and 2: (a) radar plot; (b) and (c) deformed shapes for vertical pushdown load in all bays; and (d) and (e) deformed shapes for vertical pushdown load in a single bay. . . 195 7.14 3-Story steel frame structure pushdown load distribution for Incremental
Fire Analysis . . . 196 7.15 Deflections as a function of fire load obtained through incremental fire
anal-ysis: (a) peak horizontal deflections; (b) peak vertical deflections; (c) resid-ual horizontal deflections; and (d) residresid-ual vertical deflections . . . 197 7.16 Pushdown (vertical) load inducing a vertical deflection ofL/50as a function
of fire load: (a) at the instant of maximum temperature; and (b) after fire analysis . . . 198 7.17 Pushdown (vertical) load inducing a vertical deflection ofL/50as a function
1.1 Physical Interpretation of the Damage Indices [81] . . . 28
2.1 Element properties for numerical examples . . . 45
3.1 ModIMK model parameters used in the numerical examples . . . 65 3.2 3-Story frame numerical models description . . . 71
4.1 Results obtained by other works on the response assessment of WFBW Pre-Northridge buildings . . . 81 4.2 Observations of the numerical analyses performed to validate the modeling
approach using four SAC Project tests . . . 87 4.3 Preliminary results obtained considering brittle connections withθf+ = 0.015rad
for all connections . . . 92 4.4 LA9 Building - Sensitivity analysis to pinching reloading parameters . . . . 95 4.5 Maximum values defining Damage States thresholds . . . 107 4.6 Fragility curves parameters associated with LA3 building . . . 108 4.7 Fragility curves parameters associated with LA9 building . . . 109
5.1 Database of Shallow Crustal and Subduction Zone Earthquake Ground Mo-tions . . . 118 5.2 Periods of Vibration for OpenSees Models and FEMA355 Model . . . 121
6.1 Models description . . . 151 6.2 Periods of vibration for OpenSees models and FEMA355C model . . . 152 6.3 Mean relative difference in peak interstory drift ratio to model M1 (FEMA355C
2000) . . . 155 6.4 Probabilities of failure, reliability indexes and redundancy index associated
with the scenarios considered . . . 166
7.1 Required attributes for PBEE and PBFE (adapted from Hamilton [251]) . . 181 7.2 Random variables considered and supporting references . . . 186
B.1 LA3 building - Comparison between results obtained with the developed models and the ones developed by Luco and Cornell (2000) . . . 234 B.2 LA9 building - Comparison between results obtained with the developed
models and the ones developed by Luco and Cornell (2000) . . . 235 B.3 LA20 building - Comparison between results obtained with the developed
Symbols - Latin Alphabet
Symbol Description Units
A Cross-section area [m2]
Apinch Reloading factor: ratio of the reloading force to the
target force
[−]
Af Room plan area [m2]
b Thermal inertia [J m−2 K−1 s−1/2] b(x) Interpolation function matrix [−]
Ci Structural capacity [F]
CAV Cumulative absolute velocity [m/s]
D Demand [N]
dmember Deformation of the member committed in the
pre-vious converged step
[mm]
D5−75 Significant duration [s]
dmax
i−1 Maximum deformation observed up to the i− 1 excursion
[mm]
dpc Post-capping deformation capacity [m or rad]
di Target deformation of the member [mm]
dm Maximum deformation [m or rad]
dp Plastic deformation capacity [m or rad]
du Ultimate deformation [m or rad]
dy Yield deformation [m or rad]
DIP A Park and Ang damage index [-]
DIP Amax−member Park and Ang maximum recorded damage index [-] DIstructural
P A Park and Ang structural damage index [-]
DIRV Reinhorn and Valles damage index [-]
DIRVmax−member Reinhorn and Valles maximum recorded damage index
[−]
DIstructural
RV Reinhorn and Valles structural damage index [−]
DSf Damage state after fire/blast [−]
DSm Damage state after mainshock [−]
dUf Increment of the displacement of the control DOF [m]
E Elastic modulus [GPa]
e(x) Vector of section deformations [−]
Et Hysteretic energy dissipation capacity [kNm.m]
E0 Modulus of elasticity at ambiente temperature [GPa]
Ef Efficiency [%]
Ei Hysteretic energy dissipated in excursioni [kNm.m]
EI Cross-section flexural stiffness [kNm.m] EImod Modified elastic stiffness of the element interior [kNm.m]
f Fire or blast scenario following mainshock [-]
F(dmember) Force associated with the displacementdmember [kNm or kN]
fI/J Flexibility of the I/J end spring [m/kN]
Fr,p/n Reloading factor: ratio of the reloading
deforma-tion to the target deformadeforma-tion
[-]
Fy,0.2% Reference steel yield strength with strain offset of 0.2% (at ambiente temperature)
[MPa]
Fy,2% Effective steel yield strength with strain offset of 2% (at ambiente temperature)
[MPa]
Fc Capping strength [kN or kNm]
FP Proportional limit strength [MPa]
Fr Residual strength [kN or kNm]
fS Section flexibility [-]
Fy Yield strength [kN or kNm]
imax Maximum number of iterations [−]
Irob Robustness index [−]
IA Arias intensity [m/s]
ima,c Minimum aftershock ground motion intensity leading to collapse
[g]
IMa Aftershock intensity measure [g]
IMm Mainshock intensity measure [g]
IMF Fire intensity measure [◦C]
IP s Integration points [−]
KE,θ Modulus of elasticity reduction coefficient [−]
KP,θ Proportional limit strength reduction coefficient [−]
Ky,θ Effective yield strength reduction coefficient [−]
Kint Stiffness of the element interior [kN/m]
Kmem Stiffness of the member [kN/m]
KT,m Tangent stiffness [kN/m]
Kspring
u,n Updated unloading stiffness of the zero-length
spring (load stepn)
[kN/m]
K0 Initial stiffness/Undamaged structure stiffness [kN/m]
Ke Effective stiffness [kN/m]
Kj Stiffness matrix of the structure after removal of
thejthelement or connection
[kN/m]
km Linear elastic stiffness [kN/m]
KS Secant Stiffness [kN/m]
kS Section stiffness [kN/m]
ˆ
k∗
y,θ Normalized effective yield strength based on EC3 [−]
L Element length [m]
Lint Length of the element interior (between plastic
hinges)
[m]
Lp Plastic hinge length [m]
LL Live load [kN/m]
Mc Capping moment [kNm]
me Effective mass [ton]
Mr Residual moment [kNm]
MW Moment magnitude [−]
My Yielding moment [kNm]
O Compartment opening factor m1/2 Pf(dmg) Probability of failure of the damaged structure [−] Pf(int) Probability of failure of the intact structure [−]
Pref Load pattern [kN]
Ph Section perimeter exposed to fire [m]
Py Yield axial load [kN]
q Vector of basic forces [kN and kNm]
Q(t) Functionality function [%]
qf d Fire load density [MJ/m2]
R Earthquake source-to-site distance [km] RX,10% Structural response recorded when random
vari-ableXis equal to its 10% percentile
[%]
RX,90% Structural response recorded when random vari-ableXis equal to its 90% percentile
[%]
RX,median Structural response recorded when random
vari-ableXis equal to its median
[%]
R2 Determination coefficient [−]
Rdir Direct risk [e]
Rij Robustness against events i and j [−]
Rind Indirect risk [e]
r0 Resistance of the undamaged system [kN] rd Resistance of the damaged system [kN]
RL Resilience loss [%]
RS Robustness measure [−]
RF Robustness factor [−]
s(x) Internal section forces [−]
Sa(T1) Spectral acceleration at the fundamental period of vibration
[g]
SGM Original ground motion spectral acceleration [g]
Sa Ground motion spectral accelerations associated
with the aftershock at the fundamental period of the intact structure
[g]
Sm Ground motion spectral accelerations associated
with the mainshock at the fundamental period of the intact structure
[g]
Smf Section massivity factor [1/m]
s0(x) Internal section forces particular solution associ-ated with element loads
[kN and kNm]
SF Crustal ground motions scale factor [−]
t Time [s]
Te Effective period [s]
Uf Displacement of the control DOF [m]
V Vulnerability [−]
v Vector of element deformations [m and rad] v(F) Probability of ignition [−]
VB Design base shear [kN]
Symbols - Greek Alphabet
Symbol Description Units
α′ Ratio of post-yield to elastic stiffness of the spring [−]
β Standard deviation of ln(IM) (dispersion of IM) [g] β1/2/3 Section flexural stiffness modification parameters [−] βconn Dispersion due to fragile connection variability [%]
βdamaged Reliability index of the damaged structure [−]
βintact Reliability index of the intact structure [−]
βRT R Dispersion due to record-to-record variability [%]
βi Cyclic deterioration parameter in excursioni [−]
βR Redundancy index [−]
βs Empirical non-negative strength deteriorating R
constant
[−]
ˆ
β Estimated standard deviation of ln(IM) (dispersion of IM)
[g]
∆t Time period [months/days]
R
Eh Hysteretic energy dissipated [kNm]
ε(E) Variable with standard normal distribution (used for uncertainty ofE)
[−]
ε(Fy) Variable with standard normal distribution (used
for uncertainty ofFy)
[−]
ε(qf d) Variable with standard normal distribution (used
for uncertainty ofqf d)
[−]
ε(T h) Variable with standard normal distribution (used for uncertainty of thermal elongation)
[−]
γk Cumulative deterioration of the unloading stiffness [−]
κ Residual moment ratio [−]
λ Pseudo-time [−]
Λ Ratio between the total hysteretic energy dissipa-tion capacity and the yielding moment
[−]
λelement,i Ratio of the energy dissipated by elementito total
element energy dissipated by all elements
[−]
µ Mean
Φ Standard normal cumulative distribution function [−]
φ Standard normal probability distribution function [−]
σ Standard deviation
θ Median of the fragility function (IM with 50% of collapse)
[g]
θf Fracture rotation [rad]
θp Plastic rotation capacity [rad]
θpc Post-capping rotation capacity [rad]
θu Ultimate rotation [rad]
θy Yielding rotation [rad]
ˆ
θ Estimated median of the fragility function (IM with 50% of collapse)
[g]
ξi Integration point location [-]
Abbreviations and Acronyms
Abbreviations Description
AFE Annual frequency of exceedance
AIDA Aftershock incremental dynamic analysis ASCE American Society of Civil Engineers ATC Applied Technology Council
BSSC Building Seismic Safety Council CDF Cumulative distribution function Comp Earthquake ground motion component CPH Concentrated plastic hinge
DBE Design Base Earthquake
DDBD Direct Displacement-Based Design Method DI Damage index
DM (Structural) Damage measure DS Damage state
DV Decision variable EC1 Eurocode 1 EC2 Eurocode 2 EC3 Eurocode 3 EC8 Eurocode 8
EDP (Structural) Engineering demand parameter FEMA Federal Emergency Management Agency FLPH Finite-length plastic hinge
FLPH M Finite-length plastic hinge using the proposed calibration proce-dure
FLPH S Finite-lenth plastic hinge using directly scaled moment-rotation laws without calibration
FMRB Force-based Column and Finite-length Modified Gauss-Radau with Bilin Beam Model
FMRH Force-based Column and Finite-length Modified Gauss-Radau with Hardening Beam Model
FZLB Force-based Column and Zero-length Modified Gauss-Radau with Bilin Beam Model
FZLH Force-based Column and Zero-length Modified Gauss-Radau with Hardening Beam Model
FO Flashover
ID Dispersion index
IDA I ncremental dynamic analysis IDR Interstory Drift Ratio
IFA Incremental fire analysis IL Intensity level
IM Intensity measure
LA20 20-Story SAC Project building designed to Los Angeles LA3 3-Story SAC Project building designed to Los Angeles LA9 9-Story SAC Project building designed to Los Angeles LS Limit state
Mag Earthquake magnitude MAR Mean annual rate
MCE Maximum Considered Earthquake MDOF Multi-degree-of-freedom
ModIMK Modified Ibarra-Medina-Krawinkler models MSA Multiple stripe analysis
NCREE National Center for Research on Earthquake Engi-neering
NEHRP National Earthquake Hazards Reduction Program OpenSees Open System for Earthquake Engineering
Simula-tion framework
OSU Oregon State University P/Py Axial load ratio
PBEE Performance-Based Earthquake Engineering PBFE Performance-based fire engineering
PBSE Performance-based structural engineering PC Partial collapse
PDF Probability distribution function
PEER Pacific Earthquake Engineering Research center PFC Percentage of fractured connections
PGA Peak Ground Acceleration PGC Progressive collapse PGV Peak Ground Velocity
P-M Axial force - bending moment interaction PMC Probabilistic Model Code
POE Probability of exceedance
PSHA Probabilistic seismic hazard analysis RC Reinforced concrete
RCR Repair cost ratio RDR Roof drift ratio
RIDR Residual interstory drift ratio RMSE Root mean square error RPE Return period of exceedance RTR Record-to-record
SAC Project Project leaded by three Joint Venture partners: the Structural Engineers Association of Califor-nia (SEAOC), the Applied Technology Council (ATC), and Consortium of Universities for Re-search in Earthquake Engineering (CUREE) SDOF Single-degree-of-freedom
SEA20 20-Story SAC Project building designed to Seattle SEA3 3-Story SAC Project building designed to Seattle SEA9 9-Story SAC Project building designed to Seattle SEAOC Structural Engineers Association of California SMRF Steel Moment Resisting Frame
Introduction
1.1
Background and Motivation
The study of the behavior of earthquake damaged structures still poses several challenges to the scientific community. This is, in part, due to the complexity of modeling the accumulated deterioration attained during the earthquake and taking it into account on the simulation of post-earthquake behavior. Additionally, the occurrence of an earthquake is hardly ever an isolated event. In fact, an earthquake is usually preceded by foreshocks (or premonitory earthquakes) and followed by aftershocks of the main earthquake, designated as mainshock. Moreover, other secondary events, such as fires, blasts, and tsunamis, are often recorded following a major earthquake.
Recent earthquakes have highlighted the potential risk arising from earthquake after-shocks [1]. According to data provided by the United States Geological Survey (USGS), the 2010 M8.8 Chile earthquake on February 27 triggered approximately 90 aftershocks with magnitudes of at least 5.0 in the next 24 hours. After the 2011, Great Tohoku earthquake in Japan, about 588 aftershocks with moment magnitudes of 5.0 or greater were recorded. The M8.6 Indonesia earthquake on April 11, 2012, was followed by several aftershocks with the largest measured at M8.2 just over two hours after the mainshock. In addition, a large number of aftershocks were recorded after the M7.9 earthquake in Nepal on 25 April 2015. As of 7 June 2015, over 304 aftershocks have occurred, the largest one having a mag-nitude of M7.3. Otherwise, in what concerns fire following earthquake, in the 1971 M6.6 San Fernando earthquake, 109 post-earthquake fires were recorded. After the 1989 M7.2 Loma Prieta earthquake, 67 fires were recorded, in the M6.7 1994 Northridge event, 97 fires broke out after the earthquake, while in 1995, 285 fires followed the M6.9 Kobe seismic event. Finally, the fire at a nuclear plant after the M9.0 2011 Tohoku earthquake induced great social, economic, and environmental losses [2]. Also tsunamis, have devastated entire regions after major earthquakes. After the M9.1 Sumatra earthquake in 2004 and the 2011 Tohoku earthquake there was, apart from the social and economic losses, a great number of human losses. As a consequence, the evaluation of the structural safety in post-earthquake scenarios should account for these multiple hazards that may affect the mainshock-damaged structures.
Figure 1.1: A three-story RC building collapsed during an aftershock (M5.7) of the 2010 M6.2 Taiwan earthquake (left; source: NCREE) and a fire at an oil refinery after the 2011 Tohoku earthquake (right; source: The Times)
involving these hazards. In this thesis, the assessment of structural behavior under post-earthquake hazards is carried out. In particular, two secondary events are studied, earth-quake aftershocks and fire following earthearth-quake. Methodologies are developed in order to study the influence of these hazard events on structural safety. As extremely rare events are being studied, the most effective way to assess the influence of these events on structural safety is to compute robustness metrics associated with the mainshock-damaged structure and the intact structure, considering the secondary multiple hazard events. Reliability-based measures that allow for estimation of the structural capacity to face these extreme events are used.
This work focuses on Steel Moment Resisting Frame (SMRF) structures designed ac-cording to pre-Northridge codes. Although these have long been identified as source of major uncertainties and possible problems, SMRF’s still persist as a large percentage of the existing steel buildings in the US and Europe. During the last decade, the seismic per-formance of SMRF buildings has raised many concerns regarding the occurrence of unex-pected collapse mechanisms. Even in cases in which collapse is not reached, the behavior of steel buildings can change significantly during an earthquake, mainly due to deterioration of strength and stiffness of the structure, which results in the reduction of the capacity and, ultimately, leads to the failure of the structural system [3]. To quantify the structural suscep-tibility to sequences of events, reliable analytical tools that capture component deterioration need to be considered [4].
Changes to the OpenSees source code were made as a result of the developed work, making these new contributions available to other users and to the public. The new implementations solved incongruences in previous models and made them usable in different finite element formulations. In addition, a new finite element formulation was proposed and implemented. The application of the proposed methodologies to assess the structural capacity to resist post-earthquake hazard events is exemplified by assessing the response of the 3-, 9-, and 20-story buildings designed as part of the SAC Steel Project [5] using pre-Northridge codes. Different designs were carried out in this project for Los Angeles, Seattle, and Boston. Due to this, different seismic hazard scenarios must be considered when analyzing these build-ings. The various seismic hazard sources must be considered when defining the seismic scenarios. In this context, ground motion duration has been referred as an important vari-able to be considered in structural performance assessment, namely due to the potential to trigger additional structural damage. In spite of this, no consensus exists on the influence of ground motion duration on structural ductility and damage. Thus, a study of the influence of ground motion duration on structural damage is carried out in this work. The conclu-sions of this study are important to identify deformation and energy dissipation patterns that produce increases in accumulated damage and significantly affect their post-earthquake structural damage. The study of the 3-, 9-, and 20-story Seattle SAC Steel Project buildings is presented as a representative case study.
In what concerns the aftershock hazard, the application of the proposed methodology is exemplified through the study of 3-, 9-, and 20-story Los Angeles SAC Steel Project buildings. Otherwise, the application of the proposed methodology for post-earthquake fire assessment was hindered by the validation and verification of the OpenSees models used to simulate structural response under fire. Moreover, the probabilistic structural response as-sessment under fire is still an open topic, in which several variables are involved. Due to this, it was decided that, prior to the application of the methodology to study post-earthquake fire, a sensitivity analysis should be carried out in order to identify the most important parame-ters influencing the structural response under fire. Due to this extra work that was required to develop, the application of the methodology is still on going and is not presented in this thesis and should be part of future works.
The following section summarizes the main objectives and tasks of this work.
1.2
Objectives and Tasks
The main goal of this work is to contribute to the performance assessment of building struc-tures under cascading events occurring after an earthquake. In this work reliability-based metrics are used to assess the structural robustness under the considered cascading hazards. Structural robustness is a key measure to ensure an adequate resilience [6]. In fact, the phys-ical resilience dimension strongly depends on the robustness of the infrastructures. Thus, the study of structural robustness is seen as the first step towards the quantification of the community resilience to cascading hazard events triggered by an earthquake. However, the accurate assessment of the other resilience dimensions (economical, social, and organiza-tional) is fundamental in order to develop strategies to increase community preparedness to these events. In spite of this, the study of these other dimensions falls outside the scope of this work.
performance-based engineering methods, structural performance under seismic events, post-earthquake risk scenarios, and structural performance under cascading hazards is first carried out. Then, the work is divided into three main parts, described next and summarized in Figures 1.2 (general outline), 1.3 (part I), 1.4 (part II), and 1.5 (part III). A brief description is provided next:
Part I - Development of enhanced finite element formulations and models for seismic anal-ysis
A new plastic hinge calibration procedure for force-based finite-length plastic hinge (FLPH) beam-column elements is developed, so that empirical moment-rotation re-lationships may be used in defining flexural behavior of these elements (Task I.1.1). The use of empirical relationships proved to be fundamental, as the reproduction of observed experimental behavior at element level is the most efficient yet credible way to simulate structural response. A unified implementation of a widely used empirical model is made in the OpenSees (Task I.1.2). This implementation allows for the use of this model in both concentrated plasticity models, which is the reference approach for simulating structural response under earthquake action, and finite-length plastic hinge (FLPH) models, making use of the proposed calibration procedure. A model extension is proposed for considering connection fracture. This extension uses FLPH elements to simulate member behavior, including nonlinear behavior, and zero-length fracture springs at both ends of the member to simulate connections (Task I.2). Af-ter validating the model, a probabilistic study is carried out to assess the influence of fractured connections on the structural performance and fragility assessment.
Part II - Assessment of the influence of ground motion duration on structural damage. A methodology for studying the influence of ground motion duration on structural damage is developed. A large database of earthquake records from different sources, namely from short-duration, shallow crustal, and long-duration, subduction zone, ground motions, is created. The combined influence of spectral acceleration and significant duration on structural performance is evaluated in this part. Next, pairs of spectrally equivalent short and long duration ground motions are created and the isolated influence of duration is assessed. The relationship between structural defor-mations and damage is assessed for the different ground motion types, allowing for establishing comparison between damage pattern for short and long duration ground motions and between the three buildings analyzed.
Part III - Development of a framework for the robustness assessment of structures subjected to post-earthquake cascading hazards.
fire analysis is performed to assess the structural response under fires with different intensities (Task III.2.3). These studies are necessary before proceeding to the imple-mentation the proposed framework for fire following earthquake, which is envisioned for a near future.
The dissemination of the developed research is done mainly through the publication of technical papers in international scientific journals. Accordingly, the following papers, which are detailed at the end of the corresponding chapter, are written as a results of the work developed during the time of this research project:
• 4 Papers published in international scientific journals.
• 2 Papers being prepared to be submitted to international scientific journals.
• 3 Papers in national conferences.
• 3 Papers in international conferences.
• 2 Papers in international workshops.
1.3
Thesis Organization
The present chapter is devoted to the introductory review of the research topic in which this work is integrated. The main objectives of the work are summarized and the associated tasks are described. In addition, a concise review of the main concepts involved in this work is presented next, including the concepts of structural resilience and robustness, as well as the formulation and the main steps of the Performance-Based Earthquake Engineering (PBEE). In the following, the thesis is divided into chapters that follow the tasks described in the previous section. Thus, the thesis is divided in three main parts. The first part presents the development of numerical tools. The second, the analysis of the influence of ground motion duration on structural damage. Finally, the third part presents the developed methodologies to assess the post-earthquake structural safety considering fire and/or aftershocks.
The development of numerical tools that are able to simulate the behavior of SMRF’s under multiple cascading hazard events is divided into three chapters, which correspond to the three tasks identified in the previous section. Chapter 2 presents the new formulation and implementation of a finite-length plastic hinge integration scheme that allows for the use of empirically calibrated moment-rotation laws to define hinge section behavior in force-based finite element integration. Chapter 3 builds on the formulation proposed and performs a cali-bration, as well as a new implementation, of recently developed empirical models (Modified Ibarra-Medina-Krawinkler models, ModIMK in short) [4] in order to be used in both finite-length plastic hinge elements and in the traditional concentrated plastic hinge approach. Chapter 4 is the last one associated with the first part of the work. This chapter presents the proposed modeling approach to add fracture elements that simulate fragile connections in SMRF’s. A case study of 3- and 9-story buildings is presented to illustrate the assessment of the influence of fragile connections on the fragility curves computation and in the estimated repair cost.
and presented in Chapter 5. A case study of the 3-, 9-, and 20-story Seattle SAC Steel Project buildings is presented.
Finally, Chapters 6 and 7 present the proposed methodologies to assess the robustness of structures under post-earthquake multiple hazards, namely aftershocks and fire, respectively. The conclusions of the developed research, as well as the envisioned future developments, are presented in 8.
Each Chapter follow a sequential organization composed by: (i) scope; (ii) introduction; (iii) literature review; (iv) framework description/analysis methodology; (v) case study; and (vi) conclusion.
1.4
Resilience to Catastrophic Events
1.4.1
Concept of Resilience
Resilience is usually seen as a measure of strength and flexibility. Ecologists were the first to introduce the notion of resilience. Holling [7] defined resilience as a measure of the systems persistence and their ability to absorb change and disturbance and still keep the same relationships between populations and state variables. In certain disciplines, such as sociology and psychology, resilience can be defined as the ability to recover quickly from illness, change, or misfortune. The dictionary also provides us an alternative vision by defining resilience as a property of a material that enables it to assume its original shape or position after being bent, stretched, or compressed (New International Webster’s Dictionary, 1996). Wildavsky [8] defines resilience as the capacity to cope with unanticipated dangers after they have become manifest, and learning to bounce back. Home and Orr [9], in turn, define resilience as the ability of a system to withstand stresses of environmental loading. Extensive discussions on the concept of resilience and community resilience were presented by Ainuddin and Routray [10] and Longstaff et al. [11]. Bruneau et al. [6] made the first approach into bringing resilience to the earthquake engineering field. This will be discussed on Section 1.4.4.
Resilience is thus seen as an intrinsic characteristic of systems or communities. Re-silient communities and systems are generally associated with high capacity to either pre-vent hazard-related damage and losses through execution of pre-epre-vent measures and cope with and minimize disaster impacts by following post-event strategies.
The development of disaster-resilient communities are one of the topics that have gath-ered more attention of agencies and groups engaged in disaster mitigation. The main goals of enhancing community resilience are to minimize losses, in terms of lifes, injuries, and economic losses. Improvement of seismic resilience, for example, can be achieved by im-proving the performance of the community’s infrastructure during and after an earthquake, as well as through post-disaster response that efficiently cope with and minimize losses and recovery strategies that allow communities to bounce back to the pre-disaster functioning as quickly as possible.
have been launched. Among others of interest, the TACTIC project (2014-2016), a 1.3Me
European Union funded project, aims at increasing preparedness to large-scale and cross-border disasters among communities and societies in Europe. This project focuses on iden-tifying and categorizing good practices of communication and education practices for pre-paredness. Four types of disasters are considered, namely terrorism, floods, epidemics, and earthquakes. The European Union Framework Programme for Research and Innova-tion (2014-2020) has also funds available for studying resilience, for example through the "DRS-14-2015: Critical Infrastructure Protection topic 3" which aims at developing a criti-cal infrastructure resilience indicator, as well as perform analysis and develop methods for assessing resilience.
One of the main challenges in achieving high community resilience is that it involves a continued work, thus not being possible to set a final deadline or an expected end for the project. For example in the United States, the Disaster Mitigation Act of 2000 requires communities to engage in mitigation and preparedness planning and offers incentives for disaster mitigation, thus bringing community into the center of the action. The community enrollment is fundamental for enhancing high resilience to catastrophic events.
1.4.2
Resilience Quantification
According to Bruneau et al. [6] resilience is strongly correlated to complementary mea-sures such as failure probabilities, consequences from failures, and time to recovery. High resilience usually leads to low values of these measures.
Resilience loss can be assessed through a functionality measure that takes into account the consequences of a disaster and the time to re-establish the normal performance. This functionality function, Q(t), vary in time and range from 0% to 100%, where 100% means perfect condition in service and 0% means total disruption. An example of the variation of this function throughout the life time of an infrastructure system is presented in Figure 1.6. In this Figure it is possible to see that a disaster (e.g., an earthquake), occurred at timet0, causing a significant damage and thus reducing infrastructure functionality to 70%. Service is then reestablished over a time period ∆t, until 100% functionality being achieved again
at timet1.
0 50 100
Time
Infrastucture functionality (%)
Expected variation Desirable variation
t
1
t
0
Figure 1.6: Representation of the functionality function (adapted from Bruneauet al.[6])