ISSN 2317-6431 https://doi.org/10.1590/2317-6431-2018-2021
Auditory processing screening: contributions of the
combined use of questionnaire and auditory tasks
Triagem do processamento auditivo central: contribuições do uso
combinado de questionário e tarefas auditivas
Inaie Maria Prado de Souza1, Nádia Giulian de Carvalho2, Samantha Dayane Camargo Brito Plotegher3, Maria Francisca Colella-Santos4, Maria Isabel Ramos do Amaral3
ABSTRACT
Purpose: To analyze the performance of school children in auditory tasks and to compare it with the self-perception questionnaire. In addition, it also aimed to compare the children’s answers with the same questionnaire answered by their parents and/or relatives. Methods: A total of 67 children aged 9.58 years old on average (±1.06) participated in the study, having been divided into two groups. Group I (GI) consisted of 40 children with normal development and good school performance (23 females) and Group
II (GII) consisted of 27 children with learning difficulties (12 females).
The procedures applied included: meatoscopy, immitanciometry, auditory
processing simplified assessment (ASPA) and a questionnaire based on the Scale of Auditory Behaviors. Results: A total of two GI (5%) and
14 GII (51.9%) children had abnormal ASPA performance. The temporal
ordering task demonstrated statistically lower performance of GII in relation
to GI (p = 0.001). In the questionnaire, risk of CAPD was identified in
14 children (35%) of GI and 23 children (85.2%) of GII (p <0.001). There
was a positive moderate correlation between their performance in ASPA
and in the questionnaire (p <0.05). Comparing the answers of the children
and their parents, considering each group separately, there was no difference
for GI (p = 0894) and GII (p = 0239) and the total sample (p = 0.363).
Conclusion: Both instruments were able to differentiate the groups studied
and to identify the schoolchildren who needed to be referred for a diagnostic
evaluation. From the correlation analysis, it was concluded that both ASPA
and the questionnaire should be used in a complementary way, regardless of whether they are applied to the children or their parents.
Keywords: Hearing; Hearing tests; Auditory perception; Child; Learning
RESUMO
Objetivo: Analisar o desempenho de escolares em uma bateria de triagem do processamento auditivo e comparar com um questionário de autopercepção. Além disso, comparar as respostas das crianças com questionário respondido pelos pais. Métodos: Participaram 67 escolares com média de idade de
9,58 anos (±1,06), divididos em Grupo I (GI), composto por 40 crianças com desenvolvimento normal e bom desempenho escolar (23 meninas),
e Grupo II (GII), composto por 27 crianças com dificuldades escolares
(12 meninas). Foram realizados meatoscopia, imitanciometria, avaliação
simplificada do processamento auditivo (ASPA) e questionário baseado no Scale of Auditory Behaviors. Resultados: No total, 2 crianças do GI (5%)
e 14 do GII (51,9%) tiveram desempenho alterado na ASPA. A tarefa de
ordenação temporal para sons verbais demonstrou desempenho estatisticamente inferior do GII, em relação ao GI (p=0,001). No questionário, 14 crianças
(35%) do GI e 23 (85,2%) do GII foram identificadas como risco para o TPAC
(p<0,001). Houve correlação positiva de grau moderado entre desempenho na
ASPA e o questionário (p<0,05). Na comparação das respostas das crianças
e dos pais, considerando cada grupo separadamente, não houve diferença para o GI (p=0,894) e GII (p=0,239) e na amostra completa (p=0,363).
Conclusão: Ambos os instrumentos foram capazes de diferenciar os grupos
estudados e identificar escolares que necessitam de encaminhamento para
realizar o diagnóstico. A partir da análise de correlação, concluiu-se que
a ASPA e o questionário devem ser utilizados de forma complementar,
independentemente de serem aplicados com a criança ou os pais.
Palavras-chave: Audição; Testes uditivos; Percepção Auditiva; Criança;
Aprendizagem
Study carried out at Escola Estadual Dona Castorina Cavalheiro and at Laboratório de Audiologia, Departamento de Desenvolvimento Humano e Reabilitação, Faculdade de Ciências Médicas, Universidade Estadual de Campinas – UNICAMP – Campinas (SP), Brasil.
1 Curso de Fonoaudiologia, Faculdade de Ciências Médicas – FCM, Universidade Estadual de Campinas – UNICAMP – Campinas (SP), Brasil.
2 Centro de Investigação em Pediatria – CIPED, Faculdade de Ciências Médicas – FCM, Universidade Estadual de Campinas – UNICAMP – Campinas (SP),
Brasil.
3 Departamento de Desenvolvimento Humano e Reabilitação – DDHR, Faculdade de Ciências Médicas – FCM, Universidade Estadual de Campinas – UNICAMP
– Campinas (SP), Brasil.
4 Departamento de Desenvolvimento Humano e Reabilitação – DDHR, Centro de Investigação em Pediatria – CIPED, Faculdade de Ciências Médicas – FCM,
Universidade Estadual de Campinas – UNICAMP – Campinas (SP), Brasil.
Conflict of interests: No.
Authors’ contribution: IMPS and NGC took part in the process of collection, analysis and interpretation of the data as well as of drafting of the article; SDCBP participated in the analysis of the data and its distribution in tables, in the drafting and proofreading of the article and in the final approval of the version to be published; MFCS had important intellectual participation in the processes of critical analysis of the data, proofreading of the article and approval of the final
version; MIRA guided the entire process of the study, having had important intellectual participation in the processes of analysis and interpretation of the data,
guidance on the drafting of the text, proofreading of the article and approval of the final version.
Funding: Fundação de Amparo à Pesquisa do Estado de São Paulo – FAPESP – Process No. 2016/22652-8.
Corresponding author: Nádia Giulian de Carvalho. E-mail: [email protected]
INTRODUCTION
It is known that the integrity of the auditory system, both central and peripheral, is critical for the proper development of oral and written communication, since language shares its underlying cognitive mechanisms with auditory skills(1).
In schools, the association between learning disabilities and hearing complaints is frequent, particularly in relation to noise, with studies having shown a worse performance of this pediatric population in both behavioral and electrophysiological hearing tests(2,3). In addition, the peripheral changes and/or a
history of serous otitis media, frequent in early childhood, may compromise the maturation of the auditory pathways, with repercussions on the central auditory skills and, consequently, on the process of learning(4,5).
A recent revision study highlighted the shortage of screening methods for the assessment of central auditory skills,
emphasizing the importance of the use of specific auditory tasks
combined with questionnaires(6). Thus, in the school context,
there is a considerable interest in auditory screening methods
to help identify, quickly and effectively, children at risk for central auditory processing disorder (CAPD)(7), the use of the
Auditory Processing Simplified Assessment (ASPA) standing out in Brazil(8).
ASPA is composed of open-field procedures and procedures
performed with sound instruments, which include sound localization and temporal ordering skills (memory of verbal and non-verbal sounds in sequence). It has advantages for use in schools, especially for being quick, using simple instruments and being easily accessible and low cost, in addition to being regarded as a sensitive predictor of auditory processing abnormalities(9).
Abnormalities in ASPA feature variations from 23.85% to 44%,
with worse performance in younger children(10-12).
Recently, the main guidelines have been recommending the use of self-perception questionnaires, also called checklists, in
auditory screenings, these still being rarely used in Brazil(13,14).
Some studies argue that the questionnaires can be used to
highlight concerns about a child, but do not determine whether
a CAP evaluation is really necessary(15,16), since the findings
in the literature still indicate weak to moderate correlations between the use of questionnaires and the performance in diagnostic tests. The importance of considering and comparing the impressions of parents/families regarding the children’s self-perception, using questionnaires, is also emphasized. There is a shortage of studies for this purpose, aimed at the understanding
of complaints associated with CAP. There are findings in the
literature associated with the analysis of peripheral auditory
complaints that indicate differences between the parents’
perception and the children’s self-perception(17).
Given the above, the objective of the present research was to analyze the performance of schoolchildren in auditory tasks and compare it with their score in an auditory self-perception questionnaire. In addition, it also aimed to compare the children’s answers with the same questionnaire answered by their parents and/or relatives, in order to contribute to the discussion on an adequate protocol of auditory processing screening to be performed in a school context.
METHOD
Type and location of the study
This is a prospective, analytical and descriptive cross-sectional study, developed in partnership with a school in the public school
system of the city of Campinas-SP, and with the institution’s
Audiology laboratory.
Ethical aspects and selection of subjects
This study is part of a broader research project, entitled “Triagem do processamento auditivo em escolares: validação de um programa online” [Auditory processing screening in school children: validation of an online program], approved
by the Research Ethics Committee of FCM/UNICAMP, under
opinion No. 1,538-278/2016.
An invitation letter was initially sent to the parents, for presentation of the proposal. The informed consent form was signed by all parents and/or guardians who agreed to participate, as well as by the children.
The school performance of the children was analyzed individually, through a questionnaire applied to the teachers of each class, with questions regarding the student’s performance in the classroom and in school assessments, presence or absence of
difficulties or hearing complaints, and relationships with peers.
Inclusion or exclusion criteria
Group I (GI): composed of male and female children aged from 8 to 12 years old. Children with good academic performance as reported by their teachers were selected. Children with a history of otologic and/or neurological disorders, children who had already undergone phonoaudiological and/or psycho-pedagogical assessments, as well as children with disabilities in the external acoustic meatus and middle ear were excluded.
Group II (GII): composed of male and female children aged from 8 to 12 years old, with low academic performance based on the data obtained from the questionnaires applied to the
teachers, and/or with difficulties in the acquisition and mastery of reading and writing. Children with a confirmed diagnosis of
cognitive and/or neurological disorders that could compromise the
understanding of the proposed activities, such as attention deficit hyperactivity disorder (ADHD) and/or pervasive developmental disorders (PDD), as well as children with disabilities in the external
acoustic meatus and middle ear were excluded.
Participants
The sample consisted of 67 schoolchildren, with 9.58 (+ 1.06) years of age on average, the minimum being 8 years old and the maximum 11.5 years old. In relation to sex, 35 (52.2%) children were girls and 32 (47.8%), boys.
Procedures
Data collection took place in two stages, with stage 1
consisting of auditory screening and application of the children’s self-perception questionnaire at the school. As part of the project which this study was a part of, the second step occurred in the institution’s Audiology laboratory, where the data on the application of a questionnaire directed to the parents of the children, who attended the diagnostic evaluation, were collected.
Step 1 of the data collection was performed in a quiet
room, courtesy of the school unit. Initially, in order to rule out possible conductive hearing disorders, a visual inspection of the external acoustic meatus was carried out, to attest the presence or absence of cerumen, in addition to tympanometry to examine the conditions of the middle ear, using a portable MT10 audiometer (Interacoustics). In the tympanometry, the tympanometric curves were analyzed, maximum compliance
peaking around an atmospheric pressure corresponding to 0 daPa,
an equivalent volume from 0.3 to 1.3 ml, and ipsilateral acoustic
reflex present in both ears being considered normal(18). At this
stage, the children with abnormal results in the examinations were referred for a medical evaluation and then called again.
After the prior examinations had been carried out, the data collection procedures were applied by an experienced
speech pathologist, as follows: Auditory Processing Simplified Assessment (ASPA): composed of sound location testing (LS), performed with a rattle, sequential verbal memory test (MSSV),
performed with syllables (pa-ta-ca-fa) in three sequences, to
be repeated by the child in the correct order, and sequential
non-verbal memory test (MSSNV), performed with a rattle,
coconut shell hand drums and agogô bells in three sequences.
In the LS test, the normality criterion was correctly guessing four or five directions, provided right and left had been correctly identified. In the MSSV and MSSNV tests, the normality criteria
for the ability of temporal ordering was correctly repeating two or three of the sequences presented(8). Incorrect answers in at
least one of the tests was enough for the child to be considered
as having “failed” ASPA.
– Self-perception questionnaire, based on the Scale of Auditory Behaviors – SAB, version translated into Brazilian Portuguese(19). The original questionnaire
features 12 sentences related to auditory difficulties and/or
behaviors associated with listening situations in quiet and noisy environments, understanding of instructions,
sound location, attention and academic difficulties.
The changes made to the original instrument consisted in the transformation of sentences into direct questions, with more accessible language for the understanding of the participant, in addition to the insertion of an example situation before each question, to contextualize the auditory behavior within the children’s experience and facilitate their understanding (Chart 1). The children orally
identified the frequency of the auditory behavior in these
situations, and a score was assigned to each answer: always (1 point); frequently (2 points); sometimes (3 points); rarely (4 points), and never (5 points). According to
Chart 1. Questionnaires based on the Scale of Auditory Behaviors – child version (self-perception) and parents version
Children’s questionnaire Parents/family’s questionnaire
You are in a classroom or in an environment where people are talking. 1. Do you have trouble listening or understanding what the teacher is saying?
When your child is in an environment where people are talking. 1. Does he/she have trouble listening or understanding what the people are saying?
The teacher or a person is speaking too fast while talking to you. 2. Do you have trouble listening or understanding what the teacher is saying?
If you speak too fast while talking to your child.
2. Does he/she have trouble understanding what has been said?
The teacher or a person is giving spoken instructions (explanations) to you.
3. Do you have trouble following the spoken instructions?
When you give spoken instructions (explanations) to your child. 3. Does he/she have trouble following the instructions spoken?
The teacher or a person is talking to you in a quiet environment. 4. Do you have trouble listening and clearly understanding the words without changing any letters?
If you are talking to your child in a quiet environment.
4. Does he/she have trouble listening and clearly understanding the words without changing any letters?
When the teacher or a friend is talking to you.
5. Do you have the feeling that sometimes you listen well and sometimes you do not?
When you are talking to your child.
5. Do you have the feeling that sometimes he/she listens well and sometimes he/she does not?
You are in the classroom or in the school yard and someone calls your name.
6. Do you have trouble noticing where the sound came from?
When your child is called by his/her name in an open space. 6. Does he/she have trouble noticing where it came from?
The teacher or a person is talking to you. 7. Do you ask them to repeat what was said?
When you are talking to your child.
7. Does he/she ask you to repeat what was said?
You are in the classroom. 8. Do you get easily distracted?
When your child is at home or in other environments. 8. Does he/she get easily distracted?
Last year in school.
9. Did you have trouble learning?
In the last year.
9. Did your child have trouble learning?
You are engaged in an activity. 10. Do you have trouble staying alert?
When your child is engaged in a school activity. 10. Does he/she have trouble staying alert?
When you are in the classroom or at home.
11. Do people say you are a day-dreamer or inattentive?
When your child is at home.
11. Do you think he/she is a day-dreamer or inattentive?
When you are at school or at home. 12. Are you disorganized?
Nunes et al.(19), scores equal to or below 45 points indicate
risk of CAPD, for the age group studied.
Subsequently, the 67 children screened at the school were
invited to come to the Audiology laboratory, so the central and peripheral hearing evaluation could be carried out, up to 72 hours after the school screening (step 2). This step included the application of the questionnaire directed to the guardians of the children (who were the focus of this study), basic audiological evaluation (tone audiometry, oral audiometry and tympanometry) and behavioral assessment of the central auditory processing. If the child showed signs of peripheral sensorineural hearing loss, he/she would be referred to otolaryngology services and would no longer be included in the research. No child showed this type of abnormality. Those who showed conductive abnormalities,
even if only in tympanometric curve type B or C, were referred
and subsequently reassessed, seeing as normal results in the basic audiological assessment was considered a requirement for application of the auditory processing behavioral assessment.
Of the 67 children screened, only 27 children participated in step 2, accompanied by their parents and/or guardians, 16 from GI (11 girls), with 8.62 years of age on average, and 11 from GII (7 girls), with 8.63 years of age on average.
Statistical analysis
Descriptive statistical analyses (mean, median and standard
deviation) were carried out to demonstrate each group’s
performance in the tests applied. ANOVA compared the groups for the mean of the quantitative variables age, ASPA and questionnaire. Pearson’s correlation test measured the degree of relationship of ASPA with the questionnaire, in GI and GII.
The significance level assumed in this study was 0.05 (5%) and all values considered statistically significant were highlighted
in bold in the results.
RESULTS
With respect to performance in ASPA, statistical difference was
observed between the groups in the task of temporal ordering of verbal sounds (p = 0.001). In addition, the average performance of GII was worse than GI’s. The data may be seen in Table 1.
In relation to the criterion for “passing” or “failing” ASPA, considering the minimum of an anomalous test, statistical difference
was observed between the groups, with higher percentage of
anomaly in GII (p < 0.001). In GI, 38 (95%) children passed and two (5%) failed. In GII, 13 (48.1%) children passed and 14 (51.9%) failed.
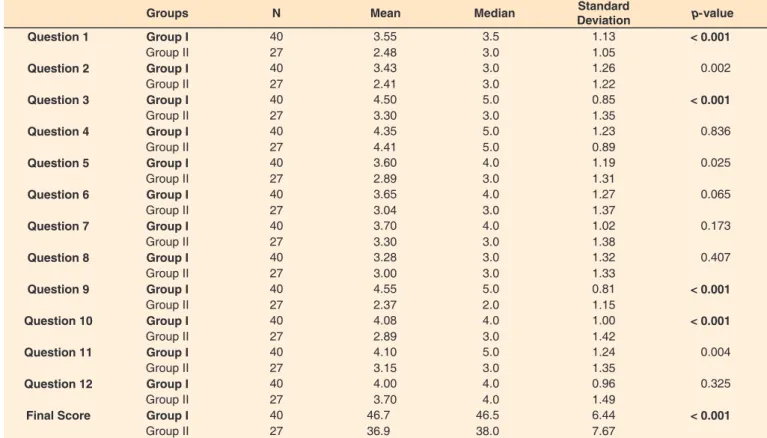
With respect to data of GI and GII related to the questions that make up the self-perception questionnaire applied to the children, the analysis considered each question separately, as well as the total score. It was possible to observe statistically
significant mean difference between the groups, in specific
questions and in the total score, with worse performance of GII in relation to GI (p < 0.001) (Table 2).
Considering the criterion of risk of CAPD, in relation
to the original validation study cited earlier, risk was found in 14 (35%) children of GI and 23 children (85.2%) of GII,
this being a statistically significant difference (p < 0.001).
The difference was observed in questions 1, 3, 9, 10 and in the final mean score of each group. The questions mentioned refer to figure-background hearing abilities and temporal ordering, and to inattentive behaviors and difficulties in the learning process.
Table 3 demonstrates the analysis of the correlation between
the self-perception questionnaire and performance in ASPA,
considering the two groups separately. Moderate and negative
correlations were found between the questions and specific tasks of ASPA, in each group. These data suggest that a good
performance in the questionnaire does not necessarily indicate
a good performance in ASPA.
In the diagnostic step, 27 children accompanied by their parents and/or guardians were evaluated. All schoolchildren included in this sample showed results within the standards of normality, considering the results of the tonal audiometry, oral
audiometry and tympanometry. Subsequently, the questionnaire
to the parents was applied.
Regarding the comparison of the groups in relation to the parents’ answers in the questionnaire (n = 27), it was possible
to note statistical differences in questions 9 (GI: 4.63 ± 0.62
and GII: 3.18 ± 1.25/p = 0.001) and 10 (GI: 4.13 ± 1.02 and GII: 3.18 ± 1.25/p = 0.041). There were no differences between
the groups in relation to the final score of the questions, the mean of the final score having corresponded to 47.38 ± 9.84
in GI and to 42.18 ± 7.48 in G2 (p = 0.152). There was no
difference for GI (p = 0.894) and GII (p = 0.239) and in the
total sample (p = 0.363). The comparisons of the children’s and parents’ answers, considering each group separately, may be seen in Table 4.
Table 1. Comparison between the groups regarding the percentage of right answers in the Auditory Processing Simplified Assessment (N = 67)
Groups N Mean Median Standard
Deviation p-value
Sound Location (%) Group I 40 83.0 80 15.4 0.179
Group II 27 77.0 80 20.5
MSSV (%) Group I 40 88.3 100 17.8 < 0.001
Group II 27 63.0 67 37.4
MSSNV (%) Group I 40 84.2 100 18.5 0.600
Group II 27 81.5 100 23.3
Table 2. Comparison between groups by performance (score) in the questionnaire, based on the children’s answers (N = 67)
Groups N Mean Median Standard
Deviation p-value
Question 1 Group I 40 3.55 3.5 1.13 < 0.001
Group II 27 2.48 3.0 1.05
Question 2 Group I 40 3.43 3.0 1.26 0.002
Group II 27 2.41 3.0 1.22
Question 3 Group I 40 4.50 5.0 0.85 < 0.001
Group II 27 3.30 3.0 1.35
Question 4 Group I 40 4.35 5.0 1.23 0.836
Group II 27 4.41 5.0 0.89
Question 5 Group I 40 3.60 4.0 1.19 0.025
Group II 27 2.89 3.0 1.31
Question 6 Group I 40 3.65 4.0 1.27 0.065
Group II 27 3.04 3.0 1.37
Question 7 Group I 40 3.70 4.0 1.02 0.173
Group II 27 3.30 3.0 1.38
Question 8 Group I 40 3.28 3.0 1.32 0.407
Group II 27 3.00 3.0 1.33
Question 9 Group I 40 4.55 5.0 0.81 < 0.001
Group II 27 2.37 2.0 1.15
Question 10 Group I 40 4.08 4.0 1.00 < 0.001
Group II 27 2.89 3.0 1.42
Question 11 Group I 40 4.10 5.0 1.24 0.004
Group II 27 3.15 3.0 1.35
Question 12 Group I 40 4.00 4.0 0.96 0.325
Group II 27 3.70 4.0 1.49
Final Score Group I 40 46.7 46.5 6.44 < 0.001
Group II 27 36.9 38.0 7.67
Subtitle: N = number of individuals
Table 3. Correlation between the questionnaire of self-perception and the auditory tasks of the Auditory Processing Simplified Assessment,
considering groups I and II (N = 67)
Group I Sound Location MSSV MSSNV
Corr (r) p-value Corr (r) p-value Corr (r) p-value
Score 1 -12.7% 0.436 20.0% 0,217 14.1% 0.385
Score 2 -14.7% 0.366 -19.3% 0.233 15.0% 0.356
Score 3 -15.7% 0.332 -5.6% 0.729 19.1% 0.237
Score 4 -0.3% 0.987 -23.8% 0.139 2.4% 0.881
Score 5 6.7% 0.681 -22.5% 0.162 -17.8% 0.271
Score 6 -23.3% 0.148 -14.7% 0.364 -35.1% 0.026
Score 7 19.0% 0.241 8.5% 0.602 24.1% 0.134
Score 8 -4.2% 0.799 -26.0% 0.105 7.8% 0.632
Score 9 -17.6% 0.278 10.0% 0.539 -31.5% 0.048
Score 10 1.8% 0.910 -4.6% 0.780 6.6% 0.685
Score 11 -25.9% 0.107 5.4% 0.739 -4.1% 0.800
Score 12 -34.7% 0.028 30.0% 0.060 9.6% 0.554
Score -20.5% 0.204 -10.6% 0.517 1.2% 0.939
Group II Sound Location MSSV MSSNV
Corr (r) p-value Corr (r) p-value Corr (r) p-value
Score 1 28.2% 0.154 4.7% 0.815 22.1% 0.267
Score 2 -1.1% 0.955 -33.2% 0.091 -8.6% 0.671
Score 3 17.1% 0.393 -38.3% 0.049 18.1% 0.367
Score 4 2.7% 0.895 -6.9% 0.734 -42.7% 0.026
Score 5 15.9% 0.429 -6.1% 0.762 26.6% 0.179
Score 6 25.0% 0.209 -47.2% 0.013 26.3% 0.185
Score 7 3.2% 0.874 17.1% 0.394 25.7% 0.196
Score 8 8.4% 0.675 0.0% 0.999 8.3% 0.680
Score 9 11.4% 0.573 3.3% 0.869 -21.3% 0.285
Score 10 17.3% 0.389 -29.7% 0.132 32.3% 0.101
Score 11 1.6% 0.935 -44.6% 0.020 25.4% 0.201
Score 12 -18.1% 0.367 -29.7% 0.132 24.3% 0.223
Score 17.9% 0.371 -37.3% 0.056 27.2% 0.170
DISCUSSION
Peripheral hearing should be the first step to be considered
in auditory assessment. Therefore, it should be noted that, based on the results of the otoscopy and tympanometry, the adequate
conditions of the middle ear of the 67 children submitted to CAP
screening in the school environment were ensured. This concern
is justified due to conductive hearing losses being more recurrent
in school-age children(20,21).
Given the limitation resulted from the absence of a portable device, that allowed the assessment of cochlear integrity in the school environment, the referral of the screened children in up to 72 hours was chosen for the diagnostic step, corroborating a
screening study with English-speaking children(7). The screened
children showed, necessarily, type A tympanometric curve and
presence of ipsilateral reflexes, at the time of the screening, and
there were no cases of peripheral hearing loss in the 27 children accompanied by their parents/family who participated in the diagnostic step. However, considering the complexity of the auditory system beyond its peripheral portion and the
relationship between auditory skills and learning, the findings
of this study demonstrated the importance of the association of
CAP screening methods with peripheral screening, due to the
occurrence of higher prevalence of abnormalities in auditory
skills in children with educational difficulties.
Considering the data presented, ASPA was consistent in the differentiation of the performance observed in the groups
(Table 1). The MSSV test influenced the higher frequency of
abnormal performance in ASPA in GII (51.9%), this being the only task with statistically significant difference, corroborating
other studies(10,12). The worse performance of GII corroborated
other studies with children of similar ages (8, 9 and 10 years old)(2,3), which demonstrates that children with educational
difficulties may have worse performance in central auditory
processing tests. These data warn of the need for screening and assessment of the auditory processing of schoolchildren, aiming at early diagnosis and intervention.
Similarly, the self-perception questionnaire applied to the children was an appropriate instrument for the differentiation of the groups studied, statistically significant difference having
been found when considering the total mean score (Table 2). The risk score was found in 85.2% of the children in GII.
The use of questionnaires as screening methods has been
greatly discussed in the literature. Some studies have pointed out
advantages and disadvantages of using questionnaires, noting that such tools may be vulnerable to interpretation issues and biased answers, especially when applied directly to the children
and in an isolated manner, and not all questionnaires available demonstrate a reliable relationship with the diagnostic tests(15,17,22).
In a study on the validation of the European Portuguese version of the SAB questionnaire, the authors correlated the score of the questionnaire filled out by parents with behavioral hearing tests applied to the children. Significant correlation
was observed between the questionnaire and diagnostic tests, the greatest correlation having occurred with the temporal processing tests. Therefore, the authors suggested the use of the questionnaire in auditory processing screening(19).
In the present study, GII obtained lower averages in all
questions, questions 1, 3, 9, 10 having influenced the statistically significant differences in the final score. Question 1 aims
to qualitatively assess the child’s perception in competitive listening activities, which correspond to an individual’s ability to focus their attention on the main auditory information in the presence of noise.
These findings may thus be associated with the situation of classrooms in Brazil, mainly in the public schools, where the
number of students per class is high, which causes elevated noise and hinders the understanding of the teacher’s speech. Although there are technical rules that determine the level of
acoustic comfort to be below 55 dB(A)(23), researchers found that
97.3% of the 37 classrooms evaluated were above the comfort
limit, with 62.25 dB(A) on average(24). This concern is due to the
knowledge that noise leads to a decrease of hearing thresholds and, consequently, to degradation in the representations of sounds, interfering with school performance, as well as reducing memory, motivation and reading skills(25).
Question 3 is related to the ability of temporal ordering
of speech sounds. This skill is responsible for an individual’s ability to correctly discriminate the order of occurrence, to memorize and to process sounds so they can then understand the message. In this way, it can be said that the ability of temporal ordering contributes to the acquisition of written language, to the perception of phonemes, to the learning of new words and also to the understanding of what is said by the teacher. This relation explains the fact of the lowest average for the question having been found in the group with educational
difficulties (GII), showing it to be a good predictor for the groups’ differentiation and corroborating the statement that
there is a relationship between the ability of simple temporal
ordering and school difficulties(26).
Question 10 of the questionnaire is directly related to lack of attention and the result showed that this difficulty is associated also with learning difficulties and abnormal auditory processing.
The need of multiple repetitions for the understanding of the
message and difficulty concentrating due to noise are manifestations
Table 4. Comparison of the final score of the children and their parents, considering the comparison in groups I and II and in the total sample (N = 27)
Groups N Mean Median Standard
Deviation p-value
GI Child 16 47.00 46 6.88 0.894
Parents 16 47.38 49 9.84
GII Child 11 37.82 39 8.91 0.239
Parents 11 42.18 45 7.48
GI + GII Child 27 43.26 44 8.89 0.363
Parents 27 45.26 47 9.18
Paired Student’s T-test
that can be related to attention. Studies have affirmed the relationship between attention and CAPD(27,28). However, despite
the fact CAP may coexist with other comorbidities, CAPD is known to feature more specific behavioral clinical features such as difficulties in the understanding of others’ speech due to noise, in the differentiation of similar sounds and in following complex auditory commands, complaints that may be confirmed
via special diagnostic tests(29).
Considering, therefore, the complexity of the diagnosis
of children who are referred for the CAP evaluation, often due to non-specific complaints or comorbidities that manifest themselves in a similar way in different cases, Barry et al.(22)
stressed that the use of the questionnaire or scales/checklists as a
screening method may be understood as a first step for the early identification of children at risk. In addition, the questionnaire
can be answered both by the children as well as other people involved in their academic and social context, thus providing
a comprehensive overview of the difficulties and perceptions reported, which may be specifically related to auditory skills.
Some studies(15,16) discussed the correlation between the
questionnaires and hearing tests, to understand how these instruments should be used. The discussions pointed to the fact that the use of self-perception questionnaires provides a
reasonable method for obtaining specific information about a child’s clinical history in a standardized and cost-effective
manner, corroborating the use of checklists as a method suitable
for assessing the children’s profile of auditory behavior and
complaints. However, despite the advantages discussed, the same authors highlighted the fact that the use of the questionnaire
alone is not a valid CAP screening or diagnostic tool. The authors stressed that, in addition to the questionnaire not being sufficient to determine whether a diagnostic CAP evaluation is justified,
there is a need of it being associated with auditory screening tasks pertaining to the skills assessed, so referral may then be determined(15,16).
In this study, the fact of moderate significant negative
correlations having been found between the questionnaire’s
score and performance in ASPA, in both groups, indicated
that a higher score in the questionnaire was not necessarily associated with a better performance in the auditory tasks evaluated (Table 3). One of the hypotheses for this finding
may be associated with the limitations of the CAP screening procedures conducted. ASPA is comprised of tasks that test only
a few auditory mechanisms, not covering all the complexity of
the central auditory system. However, ASPA is currently the only instrument validated in Brazil with feasibility for use within schools. Even considering the international scenario, there is no consensus on the most efficient CAP screening methods, this
being a current and relevant theme of researches aimed at the validation of instruments that address the hearing mechanisms
recommended by the American Speech-Language-Hearing Association (ASHA)(6,7,14).
Furthermore, considering the age group studied, it is worth
noting that previous studies that applied ASPA in school age
children between 4 and 10 years old found abnormalities with variation from 24.6% to 44%, ages under 8 years old having been associated with worse performances(10-12). These researches
indicated the fact that the isolated use of ASPA may not identify possible CAPD in older children, because performance in the
tests improves with age.
The analysis of Table 4 allowed noticing the similarity between the parents’ answers and those of the children, considering each
group separately. In the sample, the findings suggest increased
reliability of the application of the questionnaire only to the
child, as the first step to be conducted, taking into account the
feasibility of auditory screening in the school context. No other similar studies comparing the children’s answers with those of the parents have been found, based on the same instrument
specific to central auditory processing. Other studies were found, however, using different questionnaires and with a different research focus, aimed at abnormalities of the peripheral
auditory system(17,30).
Knobel and Lima(17) investigated the parents’ perception of
the children’s hearing and noted significant differences between
the answers. Most of the parents’ answers was contradictory in relation to the occurrence of hearing complaints by their children and, even when they reported noticing these complaints or
difficulties, most had never taken their children to audiological
services so they could be evaluated. It is worth mentioning that, in the aforementioned study, the questionnaire did not comprise
answers related to the children’s auditory behavior in difficult
situations only, but had as main objective the determination and characterization of auditory symptoms such as tinnitus and hyperacusis, considered to be subjective and complex to be described.
Teachers and health professionals should be mindful of the hearing health of school age children, and auditory screening
plays an important role in early detection. Despite the limitations
of this study in relation to the constitution of GI and GII, based solely on school performance as indicated by the teachers’ answers to the questionnaires, both instruments were sensitive
in the separation of the groups. ASPA and the complementary
use of the questionnaire are important and easily accessible tools for application in the school environment.
CONCLUSION
Worse performance in the auditory screening and in the self-perception questionnaire were observed in children with
educational difficulties (GII). Based on the correlation analysis conducted, it was concluded that ASPA and the questionnaire
should be used in a complementary way. There was no statistical
difference between the answers of children and parents, in the
questionnaires.
ACKNOWLEDGEMENTS
We thank FAPESP (Process No. 2016/22652-8) for the financial aid provided. We thank speech therapists Diana Faria, Ingrid Gielow and Letícia Reis Borges for their contributions
in the development of the versions of the questionnaires used in this study.
REFERENCES
2. Carvalho NG, Novelli CVL, Colella-Santos MF. Evaluation of speech in noise abilities in school children. Int J Pediatr Otorhinolaryngol.
2017;99:66-72. http://dx.doi.org/10.1016/j.ijporl.2017.05.019.
PMid:28688568.
3. Sanfins MD, Borges LR, Ubiali T, Colella-Santos MF. Speech auditory brainstem response (speech ABR) in the differential diagnosis of scholastic difficulties. Braz J Otorhinolaryngol. 2015;83(1):112-6.
http://dx.doi.org/10.1016/j.bjorl.2015.05.014. PMid:26631329.
4. Borges LR, Sanfins MD, Hein TAD, Paschoal JR, Colella-Santos MF.
Achados audiológicos e comportamentais em crianças submetidas
à miringoplastia bilateral - um estudo comparativo. Rev CEFAC.
2016;18(4):881-8. http://dx.doi.org/10.1590/1982-021620161843216.
5. Bayat A, Farhadi M, Emamdjomeh H, Saki N, Mirmomeni G, Rahim F. Effect of conductive hearing loss on central auditory function. Rev Bras Otorrinolaringol (Engl Ed). 2017;83(2):137-41. http://dx.doi. org/10.1016/j.bjorl.2016.02.010. PMid:27236631.
6. Carvalho NG, Ubiali T, Amaral MIR, Colella-Santos MF. Procedures for central auditory processing screening in schoolchildren. Rev Bras Otorrinolaringol (Engl Ed). 2018;S1808-8694(18)30067-3. http:// dx.doi.org/10.1016/j.bjorl.2018.02.004. PMid:29615299.
7. Barker MD, Purdy SC. An initial investigation into the validity of a computer-based auditory processing assessment (Feather Squadron). Int J Audiol. 2016;55(3):173-83. http://dx.doi.org/10.3109/14992027 .2015.1074734. PMid:26329098.
8. Pereira LD, Schochat E. Processamento auditivo central: abordagem passo a passo. In: Pereira LD, Schochat E, organizadores. Processamento auditivo central: manual de avaliação. São Paulo: Lovise; 1997. p.
49-60.
9. Vargas GC, Ferreira MIDC, Vidor DCGM, Machado MS. Avaliação
simplificada e comportamental do processamento auditivo em escolares:
estabelecendo relações. Rev CEFAC. 2014;16(4):1069-77. http:// dx.doi.org/10.1590/1982-021620142413.
10. Etges CL, Reis MCP, Menegotto IH, Sleifer P, Soldera CLC. Achados
na triagem imitanciométrica e de processamento auditivo em escolares.
Rev CEFAC. 2012;14(6):1098-107.
http://dx.doi.org/10.1590/S1516-18462012005000028.
11. Toscano RDGP, Anastasio ART. Habilidades auditivas e medidas da imitância acústica em crianças de 4 a 6 anos de idade. Rev CEFAC.
2012;14(4):650-8. http://dx.doi.org/10.1590/S1516-18462011005000080.
12. Colella-Santos MF, Bragato GR, Martins PMF, Dias AB. Triagem auditiva em escolares de 5 a 10 anos. Rev CEFAC.
2009;11(4):644-53. http://dx.doi.org/10.1590/S1516-18462009000800013.
13. American Academy of Audiology Clinical Practice Guidelines. Diagnosis, treatment and management of children and adults with central
auditory processing disorder [Internet]. 2010 [citado em 2017 Maio
16]. Disponível em: https://audiologyweb.s3.amazonaws.com/migrated/ CAPD%20Guidelines%2082010.pdf_539952af956c79.73897613.pdf 14. American Speech-Language-Hearing Association. (Central) auditory
processing disorders—the role of the audiologist [Position Statement] [Internet]. 2005 [citado em 2017 Maio 16]. Disponível em: www.asha.
org/policy
15. Wilson WJ, Jackson A, Pender A, Rose C, Wilson J, Heine C, Khan A. The CHAPS, SIFTER and TAPS-R as predictors of (C)AP skills
and (C)APD. J Speech Lang Hear Res. 2011;54(1):278-91. http:// dx.doi.org/10.1044/1092-4388(2010/09-0273). PMid:20689023.
16. Schow RL, Seikel JA. Screening for (central) auditory processing
disorder. In: Chermak G, Musiek F. editors. Handbook of (central)
Auditory Processing Disorder: auditory neuroscience and diagnosis. San Diego: Plural Pub; 2006. p. 137-61.
17. Knobel KAB, Lima MCMP. Os pais conhecem as queixas auditivas de seus filhos. Rev Bras Otorrinolaringol (Engl Ed). 2013;5:209-15. 18. Carvallo RMM. Timpanometria. In: Bevilacqua MC, Martinez MAN, Balen SA, Pupo AC, Reis ACM, Frota S. (Eds.) Tratado de Audiologia. São Paulo: Santos; 2012. p. 123 -33.
19. Nunes CL, Pereira LD, Carvalho GS. Scale of Auditory Behaviors e testes
auditivos comportamentais para avaliação do processamento auditivo
em crianças falantes do português europeu. CoDAS. 2013;25(3):209-15. http://dx.doi.org/10.1590/S2317-17822013000300004. PMid:24408330.
20. Araújo SA, Moura JR, Camargo LA, Alves W. Avaliação auditiva em escolares. Rev Bras Otorrinolaringol. 2002;68(2):263-6. http://dx.doi.
org/10.1590/S0034-72992002000200017.
21. Nogueira JCR, Mendonça MC. Avaliação auditiva em uma população de estudantes da rede pública municipal. Rev Bras Otorrinolaringol (Engl Ed). 2011;77:716-20.
22. Barry JG, Tomlin D, Moore DR, Dillon H. Use of questionnaire-based
measures in the assessment of listening difficulties in school-aged
children. Ear Hear. 2015;36(6):e300-13. http://dx.doi.org/10.1097/
AUD.0000000000000180. PMid:26002277.
23. ABNT: Associação Brasileira de Normas Técnicas. NBR 10.152. (NB – 95). Níveis de ruído para conforto acústico. Rio de Janeiro: ABNT; 1987.
24. Gonçalves VSB, Silva LB, Coutinho AS. Ruído como agente comprometedor da inteligibilidade de fala dos professores. Prod. 2009;19(3):466-76. http://dx.doi.org/10.1590/S0103-65132009000300005.
25. Shield BM, Dockrell JE. The effects of environmental and classroom noise on the academic attainments of primary school children. J Acoust Soc Am. 2008;123(1):133-44. http://dx.doi.org/10.1121/1.2812596.
PMid:18177145.
26. Rezende BA, Lemos SMA, Medeiros AMD. Aspectos temporais auditivos de crianças com mau desempenho escolar e fatores associados. CoDAS.
2016;28(3):226-33. http://dx.doi.org/10.1590/2317-1782/20162015170.
PMid:27462731.
27. Moore DR, Ferguson MA, Edmondson-Jones AM, Ratib S, Riley A. Nature of auditory processing disorder in children. Pediatrics.
2010;126(2):e382-90. http://dx.doi.org/10.1542/peds.2009-2826.
PMid:20660546.
28. Ahmmed AU, Ahmmed AA, Bath JR, Ferguson MA, Plack CJ, Moore DR. Assessment of children with suspected auditory processing disorder: a factor analysis study. Ear Hear. 2014;35(3):295-305. http://dx.doi. org/10.1097/01.aud.0000441034.02052.0a. PMid:24496289.
29. Chermak GD, Musiek FE, Weihing J. Beyond controversies: the science
behind central auditory processing disorder. Hear Rev. 2017;24:20-4.
30. Cone BK, Wake M, Tobin S, Poulakis Z, Rickards FW. Slight-mild
sensorineural hearing loss in children: audiometric, clinical, and risk
factor profiles. Ear Hear. 2010;31(2):202-12. http://dx.doi.org/10.1097/