505 Economic feasibility of timber management ...ECONOMIC FEASIBILITY OF TIMBER MANAGEMENT IN EXTRACTIVE
SETTLEMENT PROJECTS OF SOUTHWESTERN AMAZONIA
Ricardo da Silveira Carvalho1, Antônio Donizette de Oliveira2 (received: August 25, 2009; accepted: July 29, 2010)
ABSTRACT: Even recognizing the frailty of an isolated financial analysis for casting a glance at sustainability, it was decided that the analysis should be done because it is the market rationality, more financialized today than ever before, that embraces the macro environment in which to base forestry management, and thus it decisively influences its technical and decision-making foundations. Profitability is the most significant indicator of success, according to hegemonic thought. This work aims to investigate whether extractive forestry management as practiced in two communities of Acre state is financially feasible on the scales adopted for the 2005/2006 crop, and also to test result sensitivity against interest rate and subsidy swings. Net Present Value (NPV) was the indicator of choice to verify financial feasibility. Within the context of this particular subsidized crop, all six scales were found feasible, at all discount rates being considered. However, this feasibility is only confirmed upon evaluation of the cooperative’s cash flow – which ultimately is an extension of each forest worker’s cash flow –, resulting from subsidies granted on the price paid for timber. In a hypothetical situation, where subsidies are removed, only the larger scale operation (9.8 m3/ha) showed a positive NPV, again at all rates being considered.
Key words: Conservation, communities, profitability, subsidy, sensitivity.
VIABILIDADE ECONÔMICA DO MANEJO FLORESTAL MADEIREIRO EM PROJETOS DE ASSENTAMENTO EXTRATIVISTAS NO SUDOESTE DA AMAZÔNIA
RESUMO: Mesmo reconhecendo a fragilidade da análise financeira proposta isoladamente para se lançar um olhar sobre a sustentabilidade, decidiu-se realizá-la porque é a racionalidade de mercado, hoje mais financeirizada do que nunca, que embebe o macroambiente em que o manejo florestal se desenvolve e, portanto, influi decisivamente na sua base técnica e decisória. O pensamento hegemônico tem na rentabilidade seu mais significativo indicador de sucesso. Neste trabalho, buscou-se saber se o manejo madeireiro praticado em duas comunidades no Acre é viável financeiramente nas escalas praticadas na safra 2005/2006, testando, posteriormente, a sensibilidade dos resultados obtidos frente a oscilações na taxa de juros e nos subsídios praticados. O Valor Presente Líquido (VPL) foi o indicador escolhido para verificar a viabilidade financeira. No cenário ocorrido nessa safra subsidiada, todas as seis escalas testadas foram viáveis, em todas as taxas de desconto consideradas. No entanto, essa viabilidade só se confirmará caso se avalie o fluxo de caixa da cooperativa – que, em última instância, é uma extensão do fluxo de cada extrativista – decorrente dos subsídios no preço pago por ela pela madeira. No cenário hipotético, em que são retirados os subsídios, apenas a maior escala praticada (9,8 m3/ha) apresentou o VPL positivo, também em todas as taxas.
Palavras-chave: Conservação, comunidades, rentabilidade, subsídio, sensibilidade.
1Rural Administrator, Ph.D. candidate in Forest Engineering – Departamento de Ciências Florestais – Universidade Federal de Lavras/
UFLA – Cx. P. 3037 – 37200-000 – Lavras, MG – [email protected]
2Forest Engineer, Professor Dr. in Forest Sciences – Departamento de Ciências Florestais – Universidade Federal de Lavras/UFLA – Cx.
P. 3037 – 37200-000 – Lavras, MG – [email protected] 1 INTRODUCTION
In recent decades, community-based forestry management has been a common strategy in programs supporting local populations in preserving forests and improving livelihood conditions (AMARAL & AMARAL NETO 2005). The result is that, anchored in the sustainable development notion, many forestry management methods have been developed, disseminated and assessed both in Amazonia and in other tropical forests of planet Earth for testing the financial, environmental and social feasibility of exploration by such
communities in the long run, yet with the concern of first and foremost preserving local forest conditions.
506 CARVALHO, R. da S. & OLIVEIRA, A. D. de
production costs and sale prices, meaning that profitability prevails over the socioenvironmental aspects that are also present in the concept ‘sustainable development’.
Extractive forest workers being no price makers, whether working in large or small scale operations, competitiveness will be based on the costs incurred to undertake the activity. Average costs will be directly dependent on both the productivity and scale adopted, and this will likely lead forest workers to operate on the
same vol umetri c scal e (m3/ha)as their corporate
counterparts and/or to rely on subsidies should their strategy be to compete in the same commodity market where timber businesses are operating.
With a trend toward increasing scales of extractive activity, it is worth noting that the rationality mentioned previously, strictly financial, clearly limits verification of the socioenvironmental feasibility of forestry management initiatives in the relevant communities. Yet, according to Benatti et al. (2003), it is on this rationality that the vast majority of community-based forestry management initiatives in Amazonia are based, including the initiative addressed in this work, at least for the 2005/2006 crop.
This work thus aims to verify whether timber production management in two Acre communities is financially feasible on currently adopted volumetric scales and subsidy levels. The sensitivity of results was also tested against subsidy and interest rate swings.
2 MATERIAL AND METHODS
This study is not concerned with whether the structure, physiognomy and floristic conditions of the plant community were negatively affected by extractive operations, nor whether the human community relied or will rely on the material, organizational and technological means necessary for execution and management of extractive activity at the required scale and productivity to ensure financial feasibility. Instead, it is primarily concerned with the monetary result represented by present and future cash flows, constituting a strictly financial analysis of extractive forestry plans in two Extractive Settlement Projects (‘PAE’) run in Acre state, and whose feasibility results might dictate improvements in livelihood conditions of families involved. Given their important role in price formation, volumetric harvest scales will be given special attention in this analysis.
2.1 Study Site
Acre is a state in the southwestern portion of Brazil’s north region, bordered by Amazonas state to the north, by Rondônia state to the east, by Bolivia to the southeast and by Peru to the south and west, and boasting 153,589 km2 in area. Its 22 municipalities are distributed over five administrative regions: Baixo Acre, Alto Acre, Juruá, Purus and Taraucá/Envira (ACRE 2000). Its capital Rio Branco lies in the Baixo Acre region and concentrates nearly half the 653,620 inhabitants of the state, according to a 2007 demographic report published in the federal official gazette of October 2007. Most of Acre’s territory sits on a plateau, except the farthest west portion where Serra do Divisor lies. The local climate is Equatorial, with an average 2,300 mm annual precipitation and 22oC annual temperature (Acre 2000).
Results were analyzed of timber harvested in 2005 and sold in 2006 in Cachoeira and Equador ‘PAE’ communities, both located in Xapuri, a municipality in Baixo Acre. According to Humphries & Kainer (2006), until 2004 there were 18 community-based timber management ventures in Acre. Thus, the two ‘PAE’ communities addressed here account for about 10% of such ventures, noting that this analysis computes extractive plans devised in 2004. In the 2005/2006 year crop, Cachoeira ‘PAE’ relied on 19 families operating extractive forest management, while Equador relied on 10 families, all associated to COOPERFLORESTA, Acre’s main community-based forest producers cooperative. Together, these 29 families accounted for 48% of cooperative members in 2006 (Management Report 2006).
2.2 Cost Determination
Since all families involved in extractive forest management are members of COOPERFLORESTA, the organization charged with licensing and organizing timber harvest, transportation, processing and sale, this work computes revenues and costs ascertained by the organization for all operations concerning the 2005/2006 year crop.
507 Economic feasibility of timber management ...
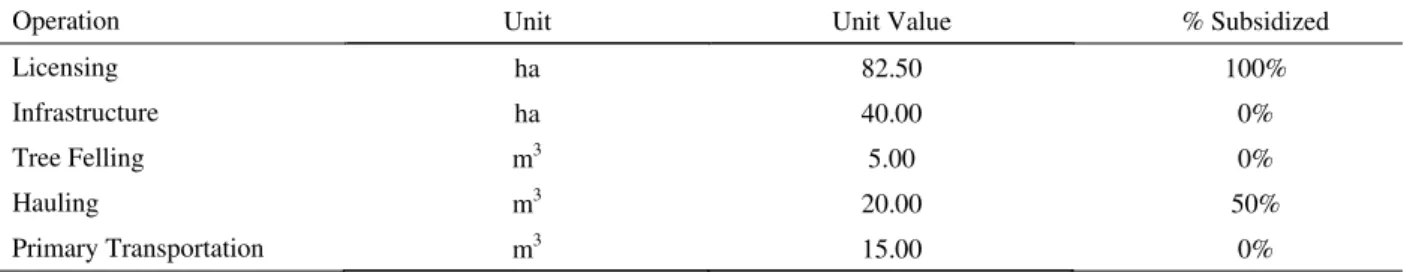
on the costs of some operations, as is illustrated in Table 1. Licensing refers to preparation of a Management Plan and an Annual Operation Plan (‘POA’); infrastructure refers to access routes and yards; tree felling refers to payment to chainsaw operators; hauling refers to amount paid for moving logs to the internal yard; and primary transportation refers to the cost of taking logs from internal yard to a storage yard close to the roadside.
Managed areas are certified by FSC and audited by the institute of forestry management and certification -IMAFLORA (2005), which receive from WWF (World Wide Fund for Nature) a nongovernmental subsidy worth R$ 2,500.00/year going toward the areas managed by the two above communities, and each community spends a further R$ 1,000.00 with annual field inspections. Thus, R$1,250.00 per community is fully paid by the WWF while the other R$ 1,000.00 is covered by each community—in Cachoeira being divided among the 19 rubber tappers involved, in Equador being divided among 10. This represents an average subsidy for the communities of about 55% with certification—R$62.48 per family in Cachoeira and R$83.79 per family in Equador. 2.3 Revenue Assessment
Similarly to cost determination, COOPERFLORESTA information was used here. To determine revenues, records were taken of fallen logs entering the cooperative, volume and quality rating as per log and per worker, as well as effective prices for the crop. Fallen logs are rated as first, second and third class quality, with rating being tied to a discount table according to volume harvested, as adopted by the cooperative. First class logs receive no volume discount, second class logs receive a 37.5% discount, while third class logs receive a 62.5% discount. Once the logs of each forest worker receive rating, the sum of log volume
Table 1 – Operations, unit areas, unit costs and subsidies on management operations of Cachoeira and Equador ‘PAE’ Communities, 2005/2006 year crop.
Tabela 1 – Operações, unidades, custos unitários e subsídios às operações de manejo nas Comunidades Cachoeira e Equador na exploração 2005/2006.
Operation Unit Unit Value % Subsidized
Licensing ha 82.50 100%
Infrastructure ha 40.00 0%
Tree Felling m3 5.00 0%
Hauling m3 20.00 50%
Primary Transportation m3 15.00 0%
per class was computed, the discount factor was applied and multiplied by the price.
Similarly to procedures for cost determination, here the subsidy granted on price paid by the cooperative for each cubic meter of timber was also specified. The average market price at the time for hardwood delivered to mill yard was R$150.00 per cubic meter. The price paid by the cooperative for timber delivered to a yard close to the roadside was R$200.00, also adding the cost of transportation to mill yard, R$61.50 per cubic meter. In effect, the cooperative paid R$261.50 per cubic meter of timber delivered to mill yard, 86.8% more than market price. 2.4 Analysis of Economic Feasibility
This analysis considered three cash flows for each community resulting from distinct volumetric scales, including largest and smallest scale workers and also a hypothetical worker adopting the average scale of all workers in the community. Cash flows were developed on the basis of unit areas.
As regards productivity in service execution, from the start, data collected showed that it does not affect costs since disbursement to pay third party labor is based on unit area or unit volume and all services are outsourced or provided by the government: licensing/planning (R$/ha), infrastructure (R$/ha), tree felling (R$/m3), hauling (R$/m3) and transportation (R$/m3). Consequently, no situations with distinct productivity were evaluated. The only expense incurred by each family is certification.
508 CARVALHO, R. da S. & OLIVEIRA, A. D. de
and floristic conditions of the relevant plant community, ruling out isolated use of financial analysis to this end in native forests - at least the annual average increase per species should be available. In the management plan of Equador community, cycle prediction lacks clarity: ‘the management cycle lasts 40 years on average, and return to the same area, 10 years’ (ASSOCIAÇÃO DOS PRODUTORES DO PROJETO DE ASSENTAMENTO AGROEXTRATIVISTA DO SERINGAL EQUADOR 2004). However, the above plan shows a clear intention of continual annual volumetric exploration with a similar area, in which case literature recommends dividing productive area by cutting cycle. The plan defines a total area of 100 ha per forest worker, divided into 10 annual plots 10 ha each, in which case the cycle lasts decidedly 10 years. In Cachoeira community, a 30-year cycle is adopted, which leaves forest workers with 100ha and 300ha respectively. That defined, models were developed over a successive cutting or infinite planning horizon, assuming the proposed
10- and 30-year cycles for each 10-ha ‘UPA’ (annual production unit).
2.4.1 Cash Flows over an Infinite Planning Horizon with 10- and 30-Year Cycle
Cash flow models as illustrated in Figures 1 and 2 assume a forest worker will license and plan for his area in year zero, devising the Management Plan and the first Annual Operation Plan (‘POA’) and always harvesting the same timber quantity.
In year 1, the forest worker will execute the necessary infrastructure (access routes, yards, hauling trails), tree felling, hauling to internal yard and primary transportation to main yard at roadside, besides selling timber and receiving the first installment of the transaction, followed in year 2 by the last installment. In this successive cutting model, each area will be ready again for extractive operation every 10 or 30 years, noting that each year of operation a new ‘POA’ must be devised for the ‘UPA’ being explored the following year.
Figure 1 – Cash flow for financial analysis of community-based timber management using an infinite planning horizon with a 10-year cycle, for a 10-ha UPA (Equador Community).
509 Economic feasibility of timber management ...
The higher the NPV value, the more attractive the management plan is. A negative value indicates a management plan is financially unfeasible while, conversely, a positive value indicates plan feasibility.
The choice of discount rate to use here was based on Lima Junior & Rezende (1993). These authors argue that, in Brazil, discount rates for forest investments reach considerably high levels, ranging between 6% and 15% a year, which is considered ‘normal’ in this sector. They conclude, citing various authors, that real discount rates adopted by most projects are about 8% a year. The rate adopted here for calculation purposes is 8%.
According to Rezende & Oliveira (2008), it is through sensitivity analysis that the effects of changes (percent and absolute) are verified on parameters, results and financial indicators. This work tested implications of variations in subsidy and interest rate on NPV.
To analyze the impact of subsidies, 2 model situations were established for NPV calculation, using data Figure 2 – Cash flow for financial analysis of community-based timber management over an infinite planning horizon with a 30-year cycle, for a 10-ha UPA (Cachoeira Community).
Figura 2 – Fluxo de caixa para análise financeira do manejo madeireiro comunitário em horizonte de planejamento infinito com Ciclo de 30 anos, em UPA de 10 ha (Comunidade Cachoeira).
2.4.2 Method for Economic Analysis
To analyze the economic feasibility of management under the above conditions, the Net Present Value method was used, considering an infinite planning horizon (NPV ). According to Rezende & Oliveira (2008), NPV is given by:
(1+i)n– 1
8 = NPV (1+i)n
Where:
NPV = n
o j
Rj (1 + i)-j - Cj (1 + i)-j
n
o j
In which: Cj = cost at the end of year j or relevant period; Rj = revenue at the end of year j or relevant period; i = interest or discount rate; n = project duration, in years, or in number of periods.
510 CARVALHO, R. da S. & OLIVEIRA, A. D. de
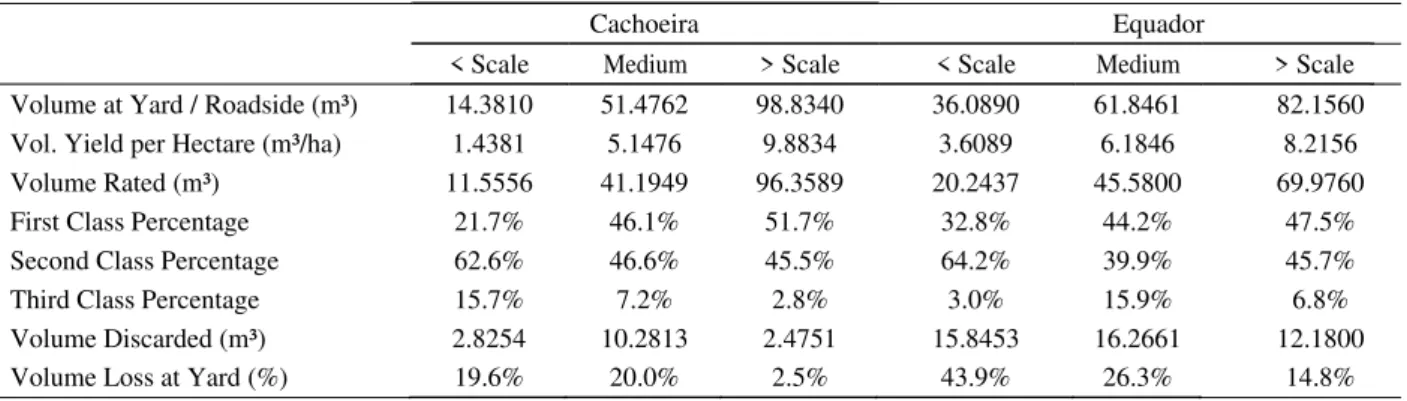
Table 2 – Volume data on small, medium and large scale extractive operations in 10-ha areas of Cachoeira and Equador Communities, 2005/2006 year crop.
Tabela 2 – Dados das explorações madeireiras em menor, média e maior escala de extração volumétrica em áreas de 10 ha nas Comunidades Cachoeira e Equador, referentes à safra 2005/2006.
Source: Management Report - COOPERFLORESTA (2006)
Cachoeira Equador
< Scale Medium > Scale < Scale Medium > Scale Volume at Yard / Roadside (m³) 14.3810 51.4762 98.8340 36.0890 61.8461 82.1560 Vol. Yield per Hectare (m³/ha) 1.4381 5.1476 9.8834 3.6089 6.1846 8.2156
Volume Rated (m³) 11.5556 41.1949 96.3589 20.2437 45.5800 69.9760
First Class Percentage 21.7% 46.1% 51.7% 32.8% 44.2% 47.5%
Second Class Percentage 62.6% 46.6% 45.5% 64.2% 39.9% 45.7%
Third Class Percentage 15.7% 7.2% 2.8% 3.0% 15.9% 6.8%
Volume Discarded (m³) 2.8254 10.2813 2.4751 15.8453 16.2661 12.1800
Volume Loss at Yard (%) 19.6% 20.0% 2.5% 43.9% 26.3% 14.8%
of small, average, and large scale operations, in each community. One model situation computed all subsidies while the other did not.
The influence of interest rate was calculated for all six scales, in both model situations, and results were tested at rates 6%, 8%, 10%, 12% and 14% p.a.
3 RESULTS AND DISCUSSION 3.1 Costs and Revenues from Extractive Operations
Table 2 illustrates extractive activity for the 2005/ 2006 year crop. The timber volume produced by each forest worker was stored in the main yard at the roadside. According to existing defects – cracks, bent shape, fungus attack, etc – logs were sorted by the cooperative rater and rated first, second and third class quality, and those failing to meeting requirements were discarded and regarded as losses. This procedure is justified if a problem is detected when timber is already stored, since transportation from the main yard to the destination mill constitutes a considerable cost (R$ 61.50 per cubic meter) and the final yield from defective logs is very low. And loss being unavoidable, the only realistic option is to minimize it. However, except for bent shape whose mensuration would be done prior to tree felling, suitable technical resources are already available that could be used to prevent cracks and fungus and/or insect attack during the storage period. In both communities it was noted that smaller relative losses were incurred precisely by forest workers operating larger volume scales. The same happens inside
communities if analyzed separately, also in absolute terms. This could be a sign of greater input by forest workers undertaking the activity on a larger scale, whose intensified participation in tree selection and carefully done storage ultimately would have brought these results.
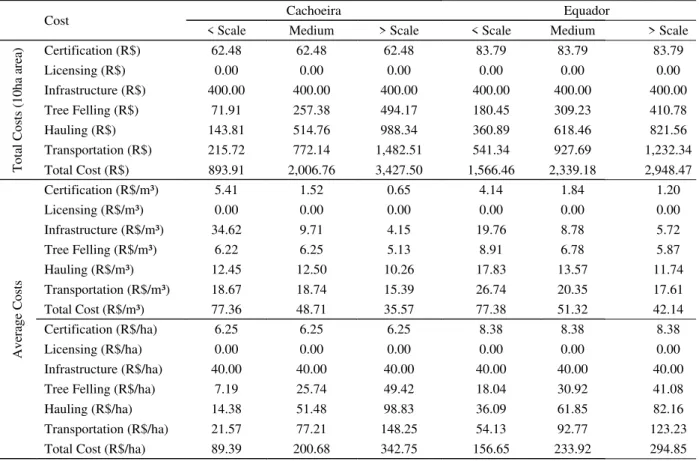
Judging by costs illustrated in Tables 3 and 4, these losses are directly reflected in average variable costs per cubic meter — tree felling, hauling and transportation — even with disbursements occurring in the same unit. In reality, despite the disbursements to fell, haul and transport the entire yielded volume, costs apply only to rated volume, which ultimately will be responsible for securing all others. Thus, the more loss increases, the more costs relating to these operations deviate from value originally paid: respectively R$5.00, R$10.00 (50% subsidy, real price then R$20.00) and R$15.00 per cubic meter. Average fixed costs, with certification, licensing and infrastructure, are not affected by losses because they are computed in R$/ha regardless of yielded volume.
511 Economic feasibility of timber management ...
Table 3 – Cost data on small, medium and large scale extractive operations in 10-ha areas of Cachoeira and Equador Communities, 2005/2006 year crop, considering subsidies.
Tabela 3 – Dados dos custos da madeira em menor, média e maior escala de extração volumétrica em áreas de 10 ha na safra 2005/2006 nas Comunidades Cachoeira e Equador, Xapuri, Acre, considerando os subsídios.
Cost Cachoeira Equador
< Scale Medium > Scale < Scale Medium > Scale
T ot al C os ts (1 0h a ar ea
) Certification (R$) 62.48 62.48 62.48 83.79 83.79 83.79
Licensing (R$) 0.00 0.00 0.00 0.00 0.00 0.00
Infrastructure (R$) 400.00 400.00 400.00 400.00 400.00 400.00
Tree Felling (R$) 71.91 257.38 494.17 180.45 309.23 410.78
Hauling (R$) 143.81 514.76 988.34 360.89 618.46 821.56
Transportation (R$) 215.72 772.14 1,482.51 541.34 927.69 1,232.34 Total Cost (R$) 893.91 2,006.76 3,427.50 1,566.46 2,339.18 2,948.47
A ve ra ge C os ts
Certification (R$/m³) 5.41 1.52 0.65 4.14 1.84 1.20
Licensing (R$/m³) 0.00 0.00 0.00 0.00 0.00 0.00
Infrastructure (R$/m³) 34.62 9.71 4.15 19.76 8.78 5.72
Tree Felling (R$/m³) 6.22 6.25 5.13 8.91 6.78 5.87
Hauling (R$/m³) 12.45 12.50 10.26 17.83 13.57 11.74
Transportation (R$/m³) 18.67 18.74 15.39 26.74 20.35 17.61
Total Cost (R$/m³) 77.36 48.71 35.57 77.38 51.32 42.14
Certification (R$/ha) 6.25 6.25 6.25 8.38 8.38 8.38
Licensing (R$/ha) 0.00 0.00 0.00 0.00 0.00 0.00
Infrastructure (R$/ha) 40.00 40.00 40.00 40.00 40.00 40.00
Tree Felling (R$/ha) 7.19 25.74 49.42 18.04 30.92 41.08
Hauling (R$/ha) 14.38 51.48 98.83 36.09 61.85 82.16
Transportation (R$/ha) 21.57 77.21 148.25 54.13 92.77 123.23
Total Cost (R$/ha) 89.39 200.68 342.75 156.65 233.92 294.85
One thing to note is the ‘subsidy’ on timber price as ‘offered’ by the cooperative. In analyzing the model situations for results of extractive activity, the Management Report (COOPERFLORESTA 2006) states that “despite considerable improvement in sawn timber results, they are still insufficient to restore the R$200.00 per meter [as approved in a meeting], although this value is unrealistic, as the market would pay R$150.00 at most, delivered to buyer’s yard”. In reality, the real price would then be R$88.50, should timber be sold to mills of Rio Branco, resulting from this R$150.00 price and deducting the freight value paid by the cooperative, as mentioned previously when addressing losses, R$61.50, but producers effectively received R$200.00 and obtained revenues shown in Table 5.
Tables 4 and 6 provide costs and revenues without computing subsidies. Comparing them to Tables 3 and 5, it
was noted that the subsidy on total costs ranged between 35.5% for the largest scale operation and 53.9% for the smallest scale operation. This difference is due to the participation of unsubsidized costs being higher in the largest scale operation (Tables 3 and 4). As for revenues, subsidy was linearly 55.7% (Tables 5 and 6).
3.2 Analysis of Financial Feasibility
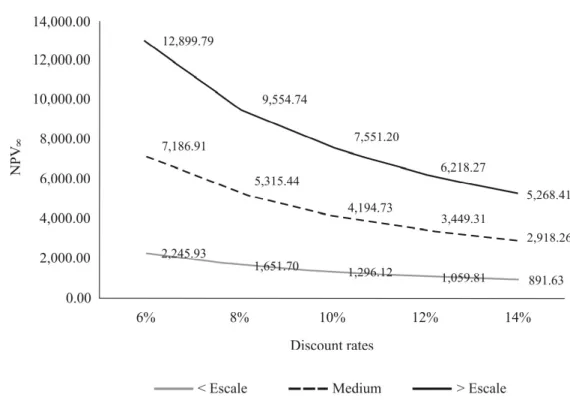
From the NPV calculation (Table 7) it was observed that in the subsidized situation all six scales proved feasible, while without subsidy only the larger scale operation (9.8 m3/ha) remains feasible. This pattern is repeated at all discount rates, as illustrated in Figures 3, 4, 5 and 6, tending toward increased feasibility at lower rates.
512 CARVALHO, R. da S. & OLIVEIRA, A. D. de
Table 5 – Revenue data on small, medium and large scale extractive operations in 10-ha areas of Cachoeira and Equador Communities, 2005/2006 year crop, considering subsidies.
Tabela 5 – Dados das receitas da madeira em menor, média e maior escala de extração volumétrica em áreas de 10 ha na safra 2005/2006, nas Comunidades Cachoeira e Equador, Xapuri, Acre, considerando os subsídios.
Table 4 – Costs data on small, medium and large scale extractive operations in 10-ha areas of Cachoeira and Equador Communities, 2005/2006 year crop, with no subsidies.
Tabela 4– Custos da madeira em menor, média e maior escala de extração volumétrica em áreas de 10 ha, caso se retire os subsídios da safra 2005/2006, nas Comunidades Cachoeira e Equador, Xapuri, Acre.
Cachoeira Equador
< Scale Medium > Scale < Scale Medium > Scale Total Revenue (R$) 1,541.90 6,425.83 15,648.66 2,998.90 6,845.05 10,999.66 Revenue per Rated m³ (R$/m³) 133.43 155.99 162.40 148.14 150.18 157.19 Revenue per Hectare (R$/ha) 154.19 642.58 1,564.87 299.89 684.50 1,099.97
Cost Cachoeira Equador
< Scale Medium > Scale < Scale Medium > Scale
T
ot
al
C
os
ts
(1
0h
a
ar
ea
) Certification (R$) 138.84 138.84 138.84 186.21 186.21 186.21
Licensing (R$) 825.00 825.00 825.00 825.00 825.00 825.00
Infrastructure (R$) 400.00 400.00 400.00 400.00 400.00 400.00
Tree Felling (R$) 71.91 257.38 494.17 180.45 309.23 410.78
Hauling (R$) 287.62 1,029.52 1,976.68 721.78 1,236.92 1,643.12
Transportation (R$) 215.72 772.14 1,482.51 541.34 927.69 1,232.34 Total Cost (R$) 1,939.08 3,422.88 5,317.20 2,854.77 3,885.05 4,697.45
A
ve
ra
ge
C
os
ts
Certification (R$/m³) 12.01 3.37 1.44 9.20 4.09 2.66
Licensing (R$/m³) 71.39 20.03 8.56 40.75 18.10 11.79
Infrastructure (R$/m³) 34.62 9.71 4.15 19.76 8.78 5.72
Tree Felling (R$/m³) 6.22 6.25 5.13 8.91 6.78 5.87
Hauling (R$/m³) 24.89 24.99 20.51 35.65 27.14 23.48
Transportation (R$/m³) 18.67 18.74 15.39 26.74 20.35 17.61
Total Cost (R$/m³) 167.80 83.09 55.18 141.02 85.24 67.13
Certification (R$/ha) 13.88 13.88 13.88 18.62 18.62 18.62
Licensing (R$/ha) 82.50 82.50 82.50 82.50 82.50 82.50
Infrastructure (R$/ha) 40.00 40.00 40.00 40.00 40.00 40.00
Tree Felling (R$/ha) 7.19 25.74 49.42 18.04 30.92 41.08
Hauling (R$/ha) 28.76 102.95 197.67 72.18 123.69 164.31
Transportation (R$/ha) 21.57 77.21 148.25 54.13 92.77 123.23
513 Economic feasibility of timber management ...
Table 6 – Revenues data on small, medium and large scale extractive operations in 10-ha areas of Cachoeira and Equador Communities, 2005/2006 year crop, with no subsidy.
Tabela 6 – Receitas da madeira em menor, média e maior escala de extração volumétrica em áreas de 10 ha, caso se retire o subsídio da safra 2005/2006, nas Comunidades Cachoeira e Equador, Xapuri, Acre.
Cachoeira Equador
< Scale Medium > Scale < Scale Medium > Scale Total Revenue (R$) 682.29 2,843.43 6,924.53 1,327.01 3,028.93 4,867.35 Revenue per Rated m³ (R$/m³) 59.04 69.02 71.86 65.55 66.45 69.56 Revenue per Hectare (R$/ha) 68.23 284.34 692.45 132.70 302.89 486.73
Table 7 – NPV of small, medium and large scale extractive operations in 10-ha areas of Cachoeira and Equador Communities, 2005/2006 year crop, for an interest rate of 8% p.a.
Tabela 7 – VPL em menor, média e maior escala de extração volumétrica em áreas de 10 ha na safra 2005/2006, nas Comunidades Cachoeira e Equador, Xapuri, Acre, para taxa de juros de 8% a.a.
Cachoeira Equador
NPV8 < Scale Medium > Scale < Scale Medium > Scale
With Subsidy 738.60 5,226.34 14,551.98 1,651.70 5,315.44 9,554.74 Without Subsidy -1,685.08 -938.46 1,606.08 -2,053.63 -1,292.88 -95.46
Figure 3 – NPV sensitivity to changes in interest rate for Cachoeira community, considering subsidies.
Figura 3 – Sensibilidade do VPL a mudanças na taxa de juros para a comunidade Cachoeira, considerando os subsídios.
514 CARVALHO, R. da S. & OLIVEIRA, A. D. de
Figure 5 – NPV sensitivity to changes in interest rate for Cachoeira community, without subsidies.
Figura 5 – Sensibilidade do VPL a mudanças na taxa de juros para a comunidade Cachoeira, desconsiderados os subsídios. Figure 4 – NPV sensitivity to changes in interest rate for Equador community, considering subsidies.
515 Economic feasibility of timber management ...
Figure 6 – NPV sensitivity to changes in interest rate for Equador community, without subsidies.
Figura 6 – Sensibilidade do VPL a mudanças na taxa de juros para a comunidade Equador, desconsiderados os subsídios.
their product via the cooperative, forest workers did have to cope with the unrealistic situation created in this crop under state influence. The concrete feasibility of subsidy to these initiatives can only be truly assessed on the basis of the cooperative’s cash flow, as cost coverage could only be transferred from individual to corporate body, in the expectation that processing and sale of timber could cover them at the same level of this significant pass-through by means of prices paid. Cooperative competitiveness against closer competitors was seriously affected, as the cost of its timber delivered to mill yard was R$261.50/m3, against R$150.00/m3 of closer competitors—74.3% higher. The unfeasibility of five out of the six scales tested under market conditions proved beyond repair.
4 CONCLUSIONS
In the current context, relying on subsidies, the volume scale of the operation matters little. From the smallest scale, 1.43 m3/ha, to the largest scale, 9.88 m3/ha, all showed a positive NPV , that is, they are feasible at all interest rates being tested. If subsidies are removed, only the largest scale remains feasible, at all rates being considered. This indicates a tendency toward increasing
extractive scales, potentially threatening environmental sustainability, if it is not already threatened. Therefore, the core of the current policy to promote timber management in Acre’s forest communities, judging by the two cases analyzed here, is feasibility through subsidy rather than through technique.
5 BIBLIOGRAPHICAL REFERENCES ACRE. Zoneamento ecológico-econômico do Acre. Rio Branco, 2000. 356 p.
AMARAL, P.; AMARAL NETO, M. Manejo florestal comunitário: processos e aprendizagens na Amazônia brasileira e na América Latina. Belém: IEB; IMAZON, 2005.
ASSOCIAÇÃO DOS PRODUTORES DO PROJETO DE ASSENTAMENTO AGROEXTRATIVISTA DO SERINGAL EQUADOR. Plano de manejo florestal sustentável comunitário. Xapurí, 2004. 40 p.
516 CARVALHO, R. da S. & OLIVEIRA, A. D. de
COOPERATIVA DOS PRODUTORES FLORESTAIS COMUNITÁRIOS DO ACRE. Relatório da administração. Rio Branco,2006. 20 p.
HUMPHRIES, S. S.; KAINER, K. A. Local perceptions of forest certification for community-based enterprises. Forest Ecology and Management, Amsterdam, v. 235, p. 30-43, 2006.
INSTITUTO DE MANEJO E CERTIFICAÇÃO FLORESTAL E AGRÍCOLA. Resumo público de certificação de associação
de moradores e produtores do projeto de assentamento agroextrativista Chico Mendes – AMPPAECM. Piracicaba, 2002. 25 p.
LIMA JÚNIOR, V. B.; REZENDE J. L. P. Deteminação da taxa de desconto a ser usada na análise econômica de projetos florestais. Revista Árvore, Viçosa, v. 11, p. 23-36, 1993.