Catarina Isabel da Silva Oliveira
Tailored deposition of coloured coatings:
on the widening of the available colour range
Catarina Isabel da Silva Oliveira
Tailor ed deposition of colour ed coatings: on t he widening of t he a vailable colour r ang e
Escola de Engenharia
Dissertação de Mestrado
Ciclo de Estudos Integrados Conducentes ao
Grau de Mestre em Engenharia de Materiais
Trabalho efectuado sob a orientação de
Professor Doutor Luís António Carvalho Gachineiro da
Cunha
e coorientação do
Doutor Diego Martínez Martínez
Catarina Isabel da Silva Oliveira
Tailored deposition of coloured coatings:
on the widening of the available colour range
Acknowledgements
Though out this project I had the fortune of having the support of several people which contributed in a very positive way to the realization of this thesis. Without this persons this task would be much more difficult to accomplish, so here I leave my sincere acknowledgement to them.
First I want to to thank to Professor Luis Cunha, my supervisor, for allowing the realization of this work, and for his incentive and guidance thought out the work.
I want to acknowledge Dr. Diego Martinez for his presence each set of the way, for his extremely helpful advices and for always taking the time to elucidate all my draughts always contributing to my learning. The name 'Co-supervisor' does not make justice to his role in this work. .
I would also like to thank to the researchers of the Laboratory of functional coatings III, Joel Borges, Marco Rodrigues and Claudia Lopes, for their sympathy and for always helping me around the lab.
To Mihai Apreutesei, from MATEIS Laboratory-INSA de Lyon, for performing the XRD measurements in my samples.
To Professor Carlos Tavares for providing the software required to analyses the XRD measurements.
To the technicians from the science school of Universidade do Minho for their technical support.
To my family, my mother and brothers, for always being present and for giving me the strength and support to achieve all my goals.
To my boyfriend, for being my safe spot, for his kind words, and for always standing by my side in the good and bad times.
At last, but definitely, not least, to my friends. Either the ones that I met during my academic journey and with whom I shared so many good memories, or the ones prior to that who occupy a special place in my life. All of them are incredible and I am lucky enough to call them ‘friends’.
Abstract
Decorative coatings are important for several consumer products such as jewellery, eyeglass frames, and wristwatch casing among others. They are supposed to provide properties such as scratch-resistance and protection against corrosion. But from a consumer’s point of view, it is important that those objects process an appealing appearance, and colour is fundamental to achieve that goal.
Decorative coatings have been largely based binary nitrides, witch possess outstanding optical and mechanical properties but lack in terms of the available colour range which is restricted to colours as golden yellows, greys, and black.
Additionally, over the time the requirements of decorative coatings are more and more demanding leading to the application of physical vapour deposition (PVD) processes. However, in order to obtain different coloured coatings, it is necessary to use different target materials and/or the reactive gas. This is time consuming, and not economically viable, and even so, there are still some colour limitations.
Recently a new class of materials became important regarding decorative applications, the metal oxynitrides. This materials allow tailor the properties of the film between a metal nitride and a metal oxide. This could allow to obtain a range of colours, within the same system, by simply varying the ratio between oxygen and nitrogen.
So in order to obtain new coloured coatings, zirconium oxynitride thin films were deposited using reactive magnetron sputtering, in several batches and varying different deposition parameters. Some of the samples were also doped with titanium.
The samples were then characterized in terms of: microstructure using Scanning Electron Microscopy, chemical composition by mean of Rutherford Backscattering Spectroscopy, structure by X-ray diffraction and colour through spectrophotometry.
The results indicate a tight relation between the chemical composition and the structure and colour of the films, and it was possible to verify that a certain compositional range leads to a certain structure.
In terms of the colours obtained the films are restricted to silver, golden-yellow and dark-greys, besides the interference colours.
Keywords: Colour, Decorative coatings, Reactive magnetron sputtering, Titanium, Zirconium oxynitrides.
Resumo
Os revestimentos decorativos são importantes em diversos produtos de consumo tais como joias, armações de óculos, caixas de relógio de pulso, entre outros. Estes revestimentos devem possuir propriedades tais como resistência ao risco e proteção contra a corrosão. Mas, do ponto de vista do consumidor, é extremamente importante que os objetos tenham uma aparência apelativa e, para isso, a cor é fundamental.
Os revestimentos decorativos têm sido maioritariamente baseados em nitretos binários, sendo que estes possuem excelentes propriedades óticas e mecânicas, mas, por outro lado, têm um número muito reduzidos de cores que se limitam a amarelos- dourados, cinzentos e pretos.
Adicionalmente, ao longo do tempo, os requisitos dos revestimentos decorativos são cada vez mais exigentes levando a que a produção se direcione para o uso de processos por deposição física de vapores (PVD). Contudo, de forma a obter filmes com cores variadas normalmente é necessário recorrer a diferentes materiais para o alvo e/ou para os gases reativos. Esta constante mudança de materiais leva tempo, e não é viável do ponto de vista económico, e mesmo assim, há, ainda, limitações em termos das cores obtidas.
Recentemente uma nova classe de materiais tem-se tornado importante em termos de aplicações decorativas, os oxinitretos de metais. Estes materiais permitem ajustar as propriedades dos filmes entre as propriedades de nitretos e óxidos metálicos. Isto pode permitir a obtenção de uma gama de cores usando o mesmo sistema, simplesmente variando o rácio entre oxigénio e azoto.
Assim, de forma a obter revestimentos com novas cores, oxinitretos de zircónio foram depositados através de deposição física de vapores, em várias series e com parâmetros de deposição diferentes. Algumas das amostras foram dopadas com titânio.
As amostras foram depois caracterizadas em termos de microestrutura usando microscopia ótica de varrimento, composição química através de espectroscopia de retrodispersão de Rutherford, estrutura através de difração de raio-x e cor por espetrofotometria.
Os resultados indicam uma íntima relação entre a composição química a estrutura e a cor dos filmes, e foi possível verificar que uma certa gama de composições leva a uma certa estrutura.
Em relação a gama de cores obtida, os filmes estão restritos a cores como prateado, amarelo-dourado e cinzentos-escuros, além das cores de interferência.
Palavras-chave: Cor, Revestimentos decorativos, pulverização catódica reativa em magnetrão, Titânio, Oxinitretos de zircónio
Table of Contents
CHAPTER 1 Introduction ... 1
1.1. Decorative thin films ... 1
1.2. Motivation ... 2
1.3. Objectives ... 2
1.4. Organization and structure of the thesis... 2
CHAPTER 2 State of the art... 5
2.1. Colour and light ... 5
2.2. Decorative coatings ... 10
2.3. ZrOxNy system: properties and applications ... 13
2.4. ZrOxNy coatings deposited by physical vapour deposition ... 17
2.5. Summary of the main results from the work of Carvalho et al.21 ... 20
2.5.1. Deposition conditions ... 20
2.5.2. Structure ... 20
2.5.3. Chemical composition ... 22
2.5.4. Colour ... 25
CHAPTER 3 Experimental details ... 31
3.1. Introduction ... 31
3.2. Deposition: Reactive magnetron sputtering ... 32
3.3. Deposition conditions of the coatings ... 36
3.4. Characterization techniques ... 40
3.4.1. X-ray diffraction ... 40
3.4.2. Scanning electron microscopy ... 42
3.4.3. Rutherford Backscattering Spectroscopy (RBS) ... 44
3.4.4. Colour spectrophotometry... 44
CHAPTER 4 Variation of the N2+O2 flow ... 47
4.1. General overview... 47 4.2. Chemical composition ... 51 4.3. Microstructure ... 53 4.4. Crystallographic structure ... 56 4.4.1. Zone I ... 57 4.4.2. Zone II ... 58
4.4.4. Comparison with the results of Carvalho 21 ... 60
4.4.5. Evolution of the crystallographic structure with the temperature ... 61
4.5. Colour ... 65
4.6. Conclusions ... 70
CHAPTER 5 Exploration of the deposition parameter space ... 73
5.1. Chemical composition ... 73
5.2. Microstructure ... 75
5.3. Crystallographic structure ... 78
5.3.1. Evolution of the crystallographic structure with the temperature ... 82
5.4. Colour ... 83
5.4.1. Individual control of the N2 and O2 flows during the deposition ... 87
5.5. Conclusions: ... 88
CHAPTER 6 Films doped with titanium (Ti:Zr-N-O) ... 91
6.1. Chemical composition ... 92
6.2. Film growth ... 94
6.3. Crystallographic structure ... 97
6.3.1. Evolution of the crystallographic structure with the temperature ... 101
6.4. Colour ... 103
6.5. Conclusions ... 106
CHAPTER 7 Conclusion and Future works ... 107
7.1. Conclusions ... 107
List of Figures
Figure 2.1 Colour experiencing (adapted from[11]) ... 5
Figure 2.2 Schematic representation of the electromagnetic spectrum[16] ... 8
Figure 2.3 Schematic representation of the light-matter interaction processes: a) Absorption; b) Transmission; c) Scattering; d) Refraction; e) Reflection; f) Diffaction[16]. ... 9
Figure 2.4 Types of optical absorption; (1) transition of high-lying bands, (2) excitons, (3) fundamental absorption, (valence band to conduction band transition), (4) impurity absorption, (5) free-carrier absorption and (6) Reststrahlen absorption. ... 12
Figure 2.5 Summary of the types of structures observed in the films and the correspondent gas flow ranges... 21
Figure 2.6 Plot of the chemical composition evolution of the four series of samples, the filled point in the series 1-3 represent the lower gas flow, and in the series 4 the lower Ton/T ... 24
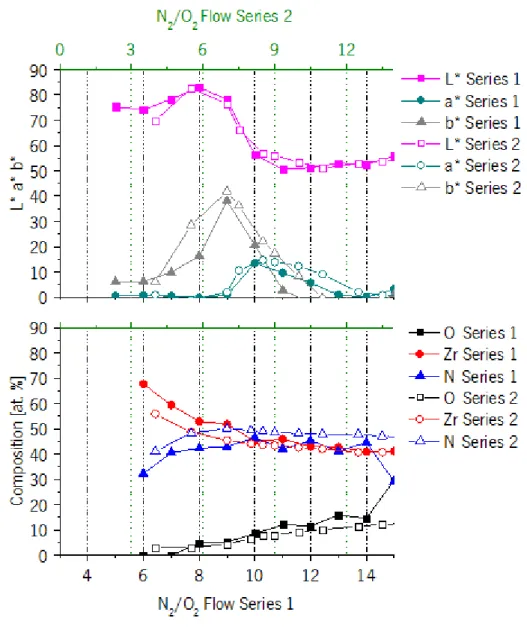
Figure 2.7 Comparison of the evolution of Series 1 and 2 elemental composition and colour coordinates with the deposition flow ... 26
Figure 2.8 Comparison of the evolution of Series 1 and 3 elemental composition and colour coordinates with the deposition flow ... 27
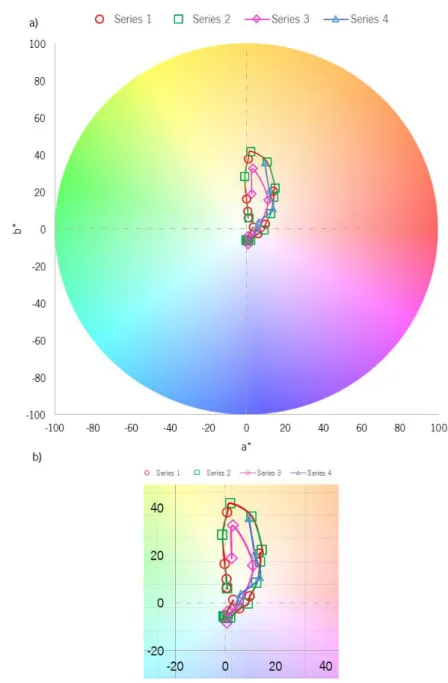
Figure 2.9 Colour coordinates of the four series of samples a) colour wheel b) zoom of the colour wheel ... 28
Figure 3.1 Representative scheme of the several parameters changed in the films ... 31
Figure 3.2 Flowchart which summarize the methodology used in this thesis... 32
Figure 3.3 Representation of the sputtering process[61] ... 33
Figure 3.4 Non-uniform erosion of the target – ‘race track’[63] ... 34
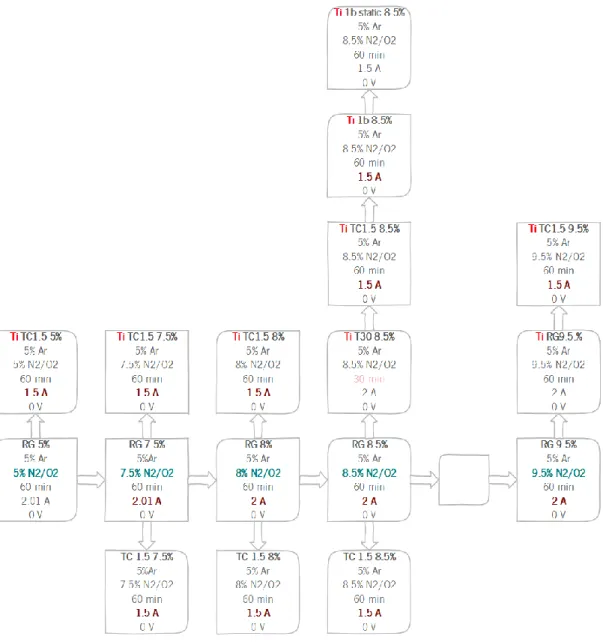
Figure 3.5 Schematic representation of the titanium introduction: a) 1 Titanium bars, 2 Zirconium target and 3 Pieces of glass; b) Top view of the deposition chamber: 4 Substrate holder, 5 zirconium target and 6 Titanium bars; c) 7 Titanium bar, 8 Glass ... 35 Figure 3.6 Schematic representation of the ZrON samples deposited with different
parameters ... 39
Figure 3.7 Schematic representation of the Ti:Zr-Ox-Ny samples deposited with different parameters ... 40
Figure 3.8 Representation of the diffractometer configuration[65] ... 41
Figure 3.9 Example of the results obtained on the same specimen using the three different geometries explored in the XRD measurements ... 41
Figure 3.10 Schematic representation of the Scanning electron miscroscope[68] ... 43
Figure 3.11 Electron beam impingement and signal emission from the sample surface[67] ... 43
Figure 3.12 Representation of the structure Zone model for thin film growth[64] ... 17
Figure 3.13 Example of a composition profile ... 44
Figure 3.14 Illustration of the spectrophotometer functioning [71] ... 45
Figure 3.15 Representation of the CIELAB colour space ... 45
Figure 4.1 Variation with the increase of the reactive gas flow of the: a) Deposition rate; b) Target potential (Equilibrium values - steady state); c) Elemental chemical composition .... 48
Figure 4.2 Model of the Evolution of the metal flux as a function of reactive gas pressure[21] ... 49
Figure 4.3 Ternary diagram of the composition evolution of the samples with the increase of the reactive gas flow. The filed dot corresponds to the samples with the lowest reactive gas flow. ... 52
Figure 4.4 SEM cross section images of films prepared at different reactive gas flows: a) RG 5%; b) RG 7.5%; c) RG 8.5%; d) RG 9.5%; e) RG 10%; f) RG 10.5%. ... 54
Figure 4.5 SEM cross section images at higher magnification of samples prepared at different reactive gas flows: a) RG 5%; b) RG 7.5%; c) RG 8.5%; d) RG 9.5%; e) RG 10%; f) RG 10.5%. ... 55
Figure 4.6 Diffractograms at 4º GI of the films prepared at different values of the reactive gas flow ... 56
Figure 4.7 Diffractogram of the films belonging to Zone 1, with the respective indexed crystallographic phases ... 57
Figure 4.8 Diffractogram of the films of Zone II with the respective indexed crystallographic phases ... 58 Figure 4.9 Diffractogram of the samples belonging to Zone III with the respective indexed
crystallographic phases ... 59 Figure 4.10 Structure types of the different Zones from a) Carvalho’s series 1 and b) RG#
series ... 60 Figure 4.11 Diffractograms of RG# series samples with the heating of the samples a) RG
5%; b) RG 7.5%; c) RG 8.5% d) RG 9.5%... 63 Figure 4.12 Diffractograms of RG# series samples before (a) and after (b) the heat
treatment ... 64 Figure 4.13 Films obtained with the variation of the reactive gas flow in the different
substrates (silicon, glass and steel) – RG# series ... 65 Figure 4.14 L*a*b* coordinates for the samples depending on the flow of reactive gas -
RG# series ... 65 Figure 4.15 Schematic representation of the calculation of the standard deviation of the
colour coordinates from substrate to substrate ... 66 Figure 4.16 Standard deviations of the colour coordinates for the samples deposited with
different reactive gas flows (RG# series) ... 67 Figure 4.17 Scheme of the three regions distinguished in the samples in terms of colour
with the increase of the SD ... 68 Figure 4.18 Variation of the L*a*b* coordinates for the intrinsic coloured samples with the
flow of reactive gas ... 68 Figure 4.19 Colour wheel with the a* and b*colour coordinates from the RG# series
intrinsic coloured coatings. The sample with the filed dot corresponds to the sample deposited with the lower reactive gas flow. The dashed line indicates the transition between intrinsic and interference colours ... 69 Figure 5.1 Evolution of the chemical composition for samples prepared to explore the
deposition parameter space in comparison with the base Series a) Bias voltage; b) Deposition time; c) target current; d) Ar flow. The filled points correspond the lower value of the parameter under study (cf. Table 5.1) ... 74
Figure 5.2 SEM cross section micrographs of the samples used to study the influence of bias: a) sample RG 8.5% – 0 V; b) sample B -40 8.5% -40 V ... 76 Figure 5.3 Cross section micrograph of the samples prepared with different deposition
times: a) sample RG 10% – 60 min; b) sample T 120 10% - 120 min ... 76 Figure 5.4 Cross section micrograph images of the samples with different target currents:
a) sample RG 7.5% – 2 A; b) sample TC 1.5A 7.5% - 1.5 A ... 77 Figure 5.5 Diffractograms of the samples deposited with different bias with the respective
indexed crystallographic phases ... 78 Figure 5.6 Diffractogram of the samples deposited with different deposition times with the
respective indexed crystallographic phases... 79 Figure 5.7 Diffractogram of the samples deposited with different target currents with the
respective indexed crystallographic phases... 80 Figure 5.8 Diffractogram of the samples deposited with different working gas flow with the
respective indexed crystallographic phases... 81 Figure 5.9 Diffractograms with the heating of the samples a) Grounded sample – RG 8.5%
b) Biased sample – B 30 8.5% ... 83 Figure 5.10 Colour wheel with the a* and b*colour coordinates for the samples prepared
while exploring the deposition parameter space compared with the base series ... 85 Figure 5.11 Detailed view of the colour wheel with the a* and b*colour coordinates for the
samples deposited for exploration of the deposition parameter space, compared with the base series. a) RG 8.5% (0V), B 30 8.5% and B 40 8.5%; b) T 30 9%, RG 9%, T 120 9%; c) RG 8.5% and TC 1.5 8.5%; d) WG 2% 8.5%, RG 8.5%, WG 8% 8.5%. The filled sample and the doted ones corresponds to the lower value of the parameter ... 86 Figure 5.12 Colour well with the a* and b*colour coordinates from the trial series
deposited with independent control of the reactive gases. ... Erro! Marcador não definido. Figure 5.13 scheme of the division of the base series in different zones in terms of
chemical composition, structure, growth mode and colour. ... 88 Figure 6.1 Chemical composition of the samples with (Ti TC1.5 7.5%; Ti TC1.5 8.5% and
Ti T30 8.5%) and without Ti doping (TC 1.5 7.5%, TC 1.5 8.5% and RG 8.5%) for different deposition parameters. ... 92
Figure 6.2 Chemical composition of Ti doped samples with different deposition parameters: 2 bars (Ti TC1.5 8.5%); 1 bar (Ti 1b 8.5%) and 1bar static mode (Ti 1bstatic 8.5%) ... 93 Figure 6.3 Cross section micrograph of the samples with (a) Ti TC1.5 7.5%; c) Ti TC1.5
8.5% and d) Ti T30 8.5%) and without titanium doping (b) TC 1.5 8.5% and e) RG 8.5%) ... 96 Figure 6.4 Cross section images of the Ti-containing samples deposited with two Ti bars (Ti
TC1.5 8.5%), one Ti bar ( Ti 1b 8.5%) and one bar in static mode ( Ti 1b static 8.5%) ... 97 Figure 6.5 Diffractogram of the sample with and without titanium doping deposited with
different parameters ... 99 Figure 6.6 Diffractogram of the titanium doped samples deposited with different amounts
of titanium and in static mode ... 101 Figure 6.7 Diffractograms with the heating of the titanium samples with different reactive
gas flows: a) Ti TC1.5 5% and b) Ti TC1.5 7.5% ... 102 Figure 6.8 Colour well with the a* and b*colour coordinates from the Ti samples deposited
with different deposition parameters in comparison with the base series ... 104 Figure 6.9 Zoom of Colour wheel with the a* and b*colour coordinates from the Ti samples
deposited with different parameters compared with the base series. a) Reactive gas flow b) Target current c)Ti amount; d) Static (filed dot) vs dynamic mode. The filed symbols correspond to the lower value of the parameter. ... 105 Figure I.1 Representation of the different contributions for the overall SD of the colour. ... 110
List of Tables
Table 2.1 The 15 causes of colour and examples15 ... 7
Table 2.2 Examples of the evolution of the colour in oxynitride systems whit the variation of reactive gas ... 19
Table 2.3 Summary of the deposition parameters of the four series ... 20
Table 2.4 Evolution of the atomic percentage of oxygen and nitrogen for the four structural Zones identified by XRD for the 4 series of samples ... 22
Table 3.1 Summary of the deposition conditions of the ZrOxNy samples. The varied parameters are highlighted in bold. ... 37
Table 3.2 Deposition parameters of the ZrTiOxNy samples ... 38
Table 4.1 Chemical characterization and thickness of the RG# samples ... 51
Table 4.2 chemical composition of each Zone limits for RG# series and Carvalho’s series 1 ... 53
Table 4.3 Resume of the characteristics of the Zones depending on each parameter ... 71
Table 5.1 Parameters varied in respect to the base series, chemical composition and deposition rate ... 73
Table 5.2 Colour coordinates of the samples prepared to explore the parameter space ... 84
Table 5.3 Resume of the effect of each parameters in the properties of the samples ... 89
Table 6.1 Chemical composition and deposition rate of the Ti:Zr-N-O films in comparison with similar Zr-N-O coatings (highlighted rows) ... 91
Table 6.2 Colour coordinates of the Ti:Zr-N-O films in comparison with similar Zr-N-O coatings. The highlighted rows correspond to the samples without titanium doping. ... 103
Abbreviations
AFM Atomic Force Microscopy
BB Bragg Brentano
BCC Body Centred Cubic
DC Direct Current
EDS Energy-dispersive X-ray Spectroscopy FCC Face Centered Cubic
MIRR Modulated Infrared Radiometry OSA Optical Society
PVD Physical Vapour Deposition
RBS Rutherford Backscattering Spectroscopy RGPP Reactive Gas Pulsing Process
SCCM Standard Cubic Centimeters per Minute SD Standard Deviation
SEM Scanning Electron Microscopy SZM Structure Zone Model
XPS X-ray Photoelectron Spectroscopy XRD X-ray Diffraction
CHAPTER 1
Introduction
1.1. Decorative thin films
Modern societies have high standards and demands and the pursuit for quality products is constant[1]. Nevertheless bulk materials often fail to provide all the desirable properties (mechanical, optical, electrical…) for a certain application[2]. In that manner coatings may provide a competitive path to modify the surface of materials in order to achieve those properties[2]. Among all the properties achieved by coatings, colour is of interest when it comes to consume products such as jewellery[1], eyeglass frames[1,3,4], wristwatch casings[1,3,4], and wristbands[1,3,4], among others. These coatings, whose aesthetic function is important, are called decorative coatings and, besides their decorative functions, they are expected to provide scratch-resistance and protection against corrosion among other properties[1,3,4].
Over the past years decorative coatings have been largely based on elementary materials and binary nitrides (TiN, ZrN, HfN)[3]. Transition metal nitrides have outstanding optical and mechanical properties such as high hardness[1], good wear and corrosion resistance[1] and adhesion[1]. But despite that, with this composition, the colour tones achievable are limited to golden yellows[3,5], greys[3,5] and black[3,5]. Furthermore, over the time the requirements of decorative coatings are more and more demanding leading to the application of physical vapour deposition (PVD) processes, which allow to fulfil these requirements[5]. However, in order to obtain different coloured coatings, there is the need to use different target materials and/or the reactive gas, which is time consuming, and not economically viable, and even so, there are still some colour limitations[5].
In order to avoid the issues above mentioned (colour tones limitations and practical and economic issues), other materials are being explored. Recently, a new class of materials became important regarding decorative applications, the metal oxynitrides MOxNy (M= early transition
metal). The importance of the transition metal oxynitrides arises from the presence of oxygen which makes possible to tailor the properties of the film between a metal nitride and a metal
oxide[3–5]. This could allow to obtain a range of colours, within the same system, by simply varying the ratio between oxygen and nitrogen
1.2. Motivation
There are several examples of metal oxynitrides systems using titanium and/or zirconium as transition metal in the production of decorative coatings[1,5–8]. The colour range achieved with this system ranges from golden, several shades of grey, to bluish and reddish coatings. But despite that, white, green and light blue coatings are yet to be achieved using this systems. In fact a German company named Biointerface GmbH is actively interested in obtain light blue and white colorations for decoration of its products. Therefore, this thesis aims to successfully deposit zirconium oxynitride thin films with new colour tones such as the ones referred above by reactive dc magnetron sputtering technique.
1.3. Objectives
The main goal of this work is to produce new coloured coatings mainly white and light blue ones using zirconium oxynitrides, for decorative applications.
The coatings will be produced by reactive dc magnetron sputtering which is a type of physical vapour deposition (PVD) technique. The samples will be deposited in glass, silicon and high-speed steel substrates. Several depositions will be made with different parameters, and adding titanium, as a dopant, in some cases, in order to study the influence of these parameters on the properties of the coatings.
The depositions will be made in several sequential batches in order to characterize the samples between depositions and adjust properly the parameters for the following batch. The samples will be characterized in terms of chemical, morphological and structural characteristics as well as in terms optical properties.
1.4. Organization and structure of the thesis
CHAPTER 2 consists on a general introduction to the main topics discussed in this thesis. First, a brief description to colour and light phenomena is made. After that, the decorative coatings are briefly introduced as well as the concept of intrinsic colour. Further ahead, the
oxynitride films and its properties and applications are revised. In the next subchapter, the deposition of the oxynitride thin films by physical vapour deposition is addresses and some examples present on the literature are referred. The state of the art ends with a detailed analyses of the main results of a previous Ph D thesis carried out in this research group on a similar topic. These results will serve as a guide line to the work developed in this thesis.
CHAPTER 3 describes the experimental details of the samples deposited in this work, starting with the methodology used and followed by a description of the deposition technique. After that, the deposition conditions of the different sets of samples are reported. Finally, the characterization techniques are briefly introduced together with the operational parameters used in each one of them.
CHAPTER 4 is the first chapter of the results and discussion, and it is focused in the base series of samples where the influence of the flow of the N2+O2 gas mixture is studied. The
aim of this chapter is to evaluate the reproducibility of the main results of the prior Ph.D. thesis on the same field in our deposition setup and conditions. Therefore, the differences and similarities with previous results are analysed in detail. This base series is used in the following chapter as the ‘baseline’ to evaluate the influence of the different deposition parameters.
In CHAPTER 5 the results and discursion of the exploration of the deposition parameters space are presented, namely the bias voltage, working gas flow, target current and deposition time, in comparison with the base series. The aim of this chapter is to understand the effect of the different deposition parameters in the system and its effect in the colour properties of the films, and evaluate if new characteristics are achievable.
CHAPTER 6 is similar to the previous one, since it involves a modification of the base series, in this case by the doping of the samples with titanium. Similarly to the Chapter 5, the objective of this chapter is to understand the effect of the Ti in the Zr-N-O system, with the final goal of finding new colours.
CHAPTER 7 englobes the main conclusions archived thought the realization of this work and the proposals for the next steps necessary to the concretization of the objectives of this thesis.
CHAPTER 2
State of the art
With the constant development of modern societies, the consumer is becoming increasingly demanding. Additionally, nowadays a great importance is placed in one’s appearance and some objects such as jewellery, glasses and watches tend to be viewed as a symbol of social status. In that way, from a consumer’s point of view, it is important that those objects process an appealing appearance, and colour is fundamental to achieve that goal
2.1. Colour and light
Colour has a great importance in the daily lives of humans. Large amounts of information about the surrounding world are gathered by the vision, and colour plays an important role in this flow of information [9].
Colour is usually experienced due to interaction of light, materials and the human visual system (eye and brain) as depicted in Figure 2.1 even though, it is possible to experience colour for example by direct stimulation of brain cells, or in dreams[9,10]. Contrarily to the common belief that colour is a property of objects, facts like variation of colour experience as a consequence of the modification of illumination refute that[9].
Over the years there has been difficulty to reach an agreement in colour description. The Calorimetry Committee of the Optical society (OSA) has been divided between the physicist and psychological views of colour. Initially, the colour definition was purely physical to be latter re-evaluated in order to include the perception-based psychological concept. Even though, the committee was, still, divided between definitions. They finally agreed to relate the concept of colour to psychological category and light to physical category[12].
Nowadays colour can be described through colour attributes. Colour technologists of the Society of Dyers and Colourists have defined the three colour attributes: Hue, Strength - depth, Dullness – brightness[13,14].
1. Hue: Attribute of colour whereby it is recognised as being predominantly red, green, blue, yellow, violet, brown, etc.
2. Strength (of a dye): the colour yield of a given quantity of dye in relation to an arbitrarily chosen standard (of a dyeing or print) synonymous with depth. 3. Dullness (of a colour): that colour quality an increase in which is comparable to
the effect of the addition of a small quantity of a neutral grey, whereby a match cannot be made by adjusting the strength. The opposite of brightness.
Several processes are known to result in colour experiences, Nassau identified what he called the ‘15 causes of colour’, In Table 2.1 are listed those causes and respective examples[9,15].
Independently of the cause, colour phenomenon has one common denominator: light. Light or electromagnetic radiation, has different names depending on its energy content (X-rays, ultraviolet radiation, infrared radiation…) and the wavelength limits of the different regions are merely an approximation once the regions form a continuum with one another with limits that are, in a certain range, undefined[9,14].
Visible light consists in the range of electromagnetic radiation that can be perceived by the human eye, with wavelengths ranging roughly from 400 to 700 nm (Figure 2.2)[10,15].
Table 2.1 The 15 causes of colour and examples[15]
Simple excitations and vibrations 1. Incandescence:
Hot objects, the sun, flames, filament lamps, carbon arcs, limelight, lightning*, pyrotechnics*. 2. Gas excitations:
Vapour lamps, neon signs, corona discharges, auroras, lightning*, pyrotechnics*, lasers*. 3. Vibrations and rotations:
Water, ice, iodine, bromine, chlorine, blue gas flame. Transitions involving ligand field effects
4. Transition metal compounds:
Turquoise, malachite, chrome green, rhodochrosite, smalt, copper patina, fluorescence*, phosphorescence*, lasers*, phosphors*.
5. Transition metal impurities:
Ruby, emerald, alexandrite, aquamarine, citrine, red iron ore, jade*, glasses*, dyes*, fluorescence*, phosphorescence*, lasers*.
Transitions between molecular orbitals 6. Organic compounds:
Dyes*, biological colorations*, fluorescence*, phosphorescence*, lasers*. 7. Charge transfer:
Blue sapphire, magnetite, lapis lazuli, ultramarine, chromates, Painted Desert, Prussian blue. Transitions involving energy bands
8. Metals and alloys:
Copper, silver, gold, iron, brass, "ruby" glass. 9. Pure semiconductors:
Silicon, galena, cinnabar, vermillion, cadmium yellow and orange, colorless diamond. 10. Doped semiconductors:
Blue and yellow diamonds, light-emitting diodes, lasers*, phosphors*. 11. Colour centers:
Amethyst, smoky quartz, desert "amethyst" glass, fluorescence*, phosphorescence*, lasers*. Geometrical and physical optics
12. Dispersion, polarization, etc.:
Rainbows, halos, sun dogs, photoelastic stress analysis, "fire" in gemstones, prism spectrum. 13. Scattering:
Blue sky, red sunset, blue moon, moonstone, blue eyes, blue skin, blue butterflies*, blue bird feathers*, other blue biological colours*, Raman scattering.
14. Interference:
Oil sHck on water, soap bubbles, coatings on camera lenses, biological colours*. 15. Diffraction:
Aureole, glory, diffraction gratings, opal, liquid crystals, biological colours*, diffraction spectrum.
Figure 2.2 Schematic representation of the electromagnetic spectrum[16]
Since its origin, light passes through several stages, selective actions at certain energy levels can lead to changes in the spectral power distribution and lead to colour experiences.
There are several processes through whom light interacts with matter and could lead to colours experiences. Typically, the observed colours are a combination of several of this processes even though they may have different contributes (e.g. selective absorption of certain wavelengths coupled with transmission, reflection and scattering of the incident radiation)[14]. In the following, the light- matter interaction process will be briefly described.
Absorption:
When light arrives to the material, the part of the light with frequency comparable to the frequency of the lattice vibrations is selectively absorbed (Figure 2.3a), the atoms of the material became excited and during the vibration the electrons in the atoms interact with the neighbouring atoms, converting the vibrational energy in thermal energy. The remaining light is emitted with a lower energy or transmited[9].
Transmission:
Transmission (Figure 2.3b) is the unimpeded passage of light through a transparent object such as a layer of water. After passing through, some of the light is absorbed or reflected, but the transmitted light has the original wavelength [9].
Figure 2.3 Schematic representation of the light-matter interaction processes: a) Absorption; b) Transmission; c) Scattering; d) Refraction; e) Reflection; f) Diffaction[16].
Scattering:
Is the change of direction in radiation that collides with, for instance, rough-surfaced materials, or with fine particles with ununiformed or varying shape (Figure 2.3c). In this case the reflection occurs in many directions. The materials can look smooth but the microscopic rough surface causes the scattering of incident light[9].
Refraction:
Refraction (Figure 2.3d) consists in the change of direction of light when passing form one medium to another. The magnitude of the change of direction is a function of the optical densities of the two mediums, and of the energy of the photons. Thus, the greater the photon’s energy and the density of the medium, the greater the change in direction will be. Snell’s law (2.1) expresses the relation of the angles of incidence and refraction and the density of the two medium[9].
(2.1)
Reflection:
reaching a material with a smooth surface change their direction on impact and are returned. In this form of scattering, due to the smooth surface of the material, the reflection angle is the same as the angle of the incident light[9].
Interference:
Interference colours differ from the scatter-effect colours. In interference colour the hue and intensity of the colours varies with the angle at which the surface is viewed. Interference is the term used to refer to the physical effect in which light waves temporarily split into parts that are latter recombined. The light waves, after the splitting, can be in or out of phase when they recombine, depending on the path the beams components follow. If they are in phase, the intensity of the resulting beam is the sum of the components, if they are not, the components will cancel each other. A common example of interference is when thin layer of oil in water. Whether or not the reflected light is in phase depends on the thickness of the film. If the reflected light is in phase, light of several wavelengths will emerge at correspondent angles giving rise to colour stimuli, the colours will depend on the angle of viewing. Several colour will be seen if the film has a non-homogeneous thickness[9].
Diffraction:
Diffraction (Figure 2.3f) is a particular case of the combined effect of scattering and interference. The behaviour of light in the edge of a material (e.g. a razor blade) is influenced by the sharpness of the edge. The light arriving the edge can be transmitted, scattered, or absorbed, reflected, or refracted depending on the relationship between its wavelength and the dimensions of the edge. If several edges exist the resulting scatter at the edges is subjected to interference effects. When daylight strikes such an assembly of edges, waves in phase are enhanced in different directions: a display spectral colours results when viewed from different angles[9].
2.2. Decorative coatings
Decorative coatings have been used for a considerable amount of time and were first applied in small consumer products such as writing instruments[5,17], eyeglass frames[1,3,5,17], wristwatch casings[1,3,17] and jewellery parts[5,17] and their commercial value keeps increasing[18].
decorative coatings are supposed to exhibit surface quality[17,18], skin compatibility[17,18], scratch resistance[1,5], high wear resistance[17,18] and protection against corrosion[5,17]. Thus, by proper selection of the coating methods and materials it is possible to protect the substrate to increase their service lifetime and, also, increase the commercial value of the products[19,20].
Decorative thin films have been mostly based on elemental materials, metal nitrides (TiN, ZrN, HfN) and titanium carbonitrides[3].
The main objective of this thesis is produce decorative intrinsic coloured films, so the focus will be placed in the origins of intrinsic colours in oxynitride thin films and study the influence of different deposition parameters and compositional and structural features in the films colour.
From a physical point of view, the production of intrinsic colour is caused by selective absorption of portions of the incident light together with transmission, reflection and scattering of the radiation that was not absorbed[14,21,22].
Light is absorbed by several absorption mechanisms before resulting in colour experiences. The absorption occurs due to the response of optical phonons and outermost electrons. The absorption processes are divided in four[22] :
1. Reststrahlen absorption 2. Interband transition
3. Absorption due to impurities 4. Free-carrier absorption
In Figure 2.4 it is possible to see the optical absorption spectrum as a function of the energy of the photons.
Reststrahlen absorption
Reststrahlen absorption occurs usually in the infrared region of the electromagnetic spectrum having no contribution in the colour effects[22]. In Reststrahlen mechanism light is selectively reflected from the surface of a transparent material when the frequency of the incident light is comparable to the vibration of the lattice[21,23]. The majority of the light that reaches the transparent solid is transmitted through it, and part of the light is absorbed, the remaining is reflected[23]. Light of certain frequencies (close to the frequency of vibration of the material) does not travel far into the material[23]. Part of this light is absorbed nearby the surface, being the energy of the light transferred to the vibrating ions of the solid, as some reflected as
material can be reflected in this selective way, the radiation that remains after multiple reflections is all essentially of the same frequency[23].
Figure 2.4 Types of optical absorption; (1) transition of high-lying bands, (2) excitons, (3) fundamental absorption, (valence band to conduction band transition), (4) impurity absorption, (5) free-carrier absorption and (6) Reststrahlen
absorption.
Interband transition
When a photon with energy comparable to the energy gap impinges the material, the valence electrons at the ground state absorb photons of threshold energy and then cross the band gap to an empty conduction band[21,24]. In a perfect crystal, with a filled valence band and an empty conduction band, the absorption process is ruled by the interband transition mechanism[22,25]. Interband transitions can be either direct or indirect[25].
Colour is caused by the remaining light that was not absorbed[22]. Colour caused by this process depend on the magnitude of the band gap, if the band gap is larger than the higher energy of the visible region (3.5 eV), the materials are perceived as transparent since there is no absorption of visible light[21,22,26]. For its turn, materials with band gap smaller than the lower limit of the visible region of the electromagnetic spectrum (1.7 eV) are opaque and blackish once there is the absorption of the whole spectrum of the visible light wavelengths[21,22,26]. For band gaps lying in the visible region, particular threshold energies are absorbed and the materials present a characteristic colour[22].
Absorption due to impurities
In the case of imperfect crystals, extra energy levels are situated in regions around the defects. This extra energy levels cause that the valence electrons need less energy to go to higher energy levels when compared to the perfect crystals. Thus, colour arises from the absorption of photons in the visible range[21,22].
One example of this mechanism is the diamond (colourless) that becomes yellowish when doped with nitrogen[26]. Nitrogen acts as a donor, and creates an energy level at 1.4 eV above Fermi level, even though the energy necessary for a direct transition is 4 eV. Hence, energy ranging from blue to violet is absorbed and yellow and green is transmitted. If some boron is added, the element will act as an acceptor originating an empty state at approximately 0.4 eV above the Fermi level. The diamond is capable to absorb light in the red region appearing bluish[21,22,26].
Free-carrier absorption
The main absorption mechanism in zirconium nitrides is free-carrier absorption[22]. When electromagnetic radiation strikes a material with a partially filed valence band, the free carriers from the original ground states are excited to higher energy states located immediately above the Fermi level. Thus the free carriers absorb light with a wide range of energy, including in the visible region. The excited electrons can return to lower energy states by dissipating energy in the form of heat, due to collisions with the lattice, or in the form of photons. These photons leave the surface of the material as the observed reflected light. As result of selection rules, the electron paths going to higher energies and returning to the ground states may differ, and, thus, the observed colour may not correspond to the absorbed light[21,22].
2.3. ZrO
xN
ysystem: properties and applications
Nitrides consist in a group of modern ceramic materials of technological importance[5]. Their properties make them suitable for tribological applications (such as cutting tools, turbine blades, and other abrasive environments applications)[27,28], for protective applications (such as wear, diffusion and corrosion-resistant devices)[5], for optical applications (such as solar collectors devices)[19] and also for optoelectronics[29] and microelectronics[5].
Transition metal nitrides have been used successfully for the past years due to their optical and mechanical properties[1,19,30]. The combination of ionic, covalent and metallic
bonding[7] leads to promising properties. The covalent bonds lead to properties such as high hardness[5,7,19], chemical[5,7,19] and thermal stability[31], high melting point (Titanium nitride (TiN): 2950º; Zirconium nitride (ZrN): 2982º)[7,19,32], relatively low friction coefficient[19], wear[31] and corrosion resistance[7,19,32], and brittleness[31]. The metallic bonds lead to electrical conductivity and metallic reflectance[22].
More specifically, titanium and zirconium nitrides films are of great industrial interest due to their applications such as hard coatings[19,33,34], diffusion barriers in semiconductors technology[19,34,35], Josephson junctions[33,34], as superconductors[33] and optical applications in heat mirrors[19,32,36]. But, particularly, due to metallic properties (electrical conductivity and metallic reflectance), along with the aesthetic properties of the colorations in the visible wavelength region, make them very interesting in the field of decorative coatings[31,35].
The gold-like appearance of TiN and ZrN makes then interesting as gold substitutes for example on watches, with improved scratch resistance and being, obviously, less expensive coating materials[22,32]. This gold-like appearance is caused by the high reflectance of this materials at the red-end of the visible spectrum and low reflectance near the ultraviolet region[22]
Stoichiometric ZrN is the only stable phase, and presents a gold-like colour, other non-stoichiometric phases also exist such as Zr2N, ZrN2, Zr3N4 and Zr4N3[37]. ZrNy thin films crystalize
into a FCC NaCl structure type over a large chemical composition range (0.7<y<1.2)[37]. ZrN coatings have been produced by many techniques such as vacuum arc deposition, reactive magnetron sputtering, pulse laser deposition and ion beam-assisted deposition[38,39].
Despite all the remarkable properties of the transition metal nitrides thin films (TiN, ZrN…) the colour range achieved by them is limited to colours such as golden as well as brown and black[34]. Additionally, the demand for low cost products combined with reduced material resources is pushing the research to deposition techniques that allow to produce coloured films with minimum use of resources[5,8]. Likewise the continuous change in deposition procedure such as material targets and/or reactive gas changes to obtain different coloured films is unsuitable[5,8].
Considering these limitations, a new class of materials has been drawing attention when it comes to decorative applications, the metal oxynitrides[5,40]. The major advantage of this nitride and oxide combination is not only the possibility to have a range of different colours and physical properties, but, above all, the opportunity to have them from the same system: one target (Zr, Ti,…) and the same gas mixture (N2+O2), i.e. with the same system setup and by
varying the N2/O2 ratio it is possible to achieve a range of different colours[40].
Films based in zirconium oxides have a series of desirable properties. They are transparent in a wide wavelength range[41], have high refractive index[42,43], high melting point[42] high thermal stability[41], corrosion resistance[42], chemical resistance[41] and good adhesion[41]. For its turn, zirconium nitrides usually have optical properties of low variability and with the addition of a third element, in this case oxygen, structural changes can occur, with the possibility to tailor the properties of the materials in a much wider range[44]. When adding oxygen to the zirconium nitrides a synergy of properties occurs with the desirable properties of the metal oxides (optical and electrical properties) and nitrides (electrical, mechanical and tribological properties)[44].
The presence of oxygen allows tailoring the properties of the film between those of metallic nitrides and the correspondent insulating oxides, leading to unexpected and promising functional range of materials[8,40,45,46]. As was already referred MeOx has excellent properties
namely mechanical properties of oxide-based films along with good chemical stability, high refraction index and wide optical band gap[7]. Therefore, varying the oxide/nitride ratio allows to tune the band-gap[5,40], bandwidth[5,30,40] and crystallographic order[5,30,40,47], between
oxide and nitride. As a consequence, the electronic and optical properties of materials can be modified and thus their colour properties could be tailored by elucidating the relationship between the corresponding physical, structural and mechanical properties[5,30,40].
Due to the higher reactivity of oxygen relatively to nitrogen, the addiction of oxygen to a growing transition nitride film induces the formation of ionic-metal-oxygen bonds in a matrix of metal-nitrogen bond[30]. This leads to the creation of a new structure with different properties, and the optical and decorative characteristics of these ceramic material may be enhanced[30]. Though a careful control of the oxygen flow is important once the final properties will depend on the N/O ratio[48].
Transition metal oxynitrides, more specifically zirconium and titanium oxynitrides, are of interest for several applications[46]. Titanium oxynitrides are used in applications such as sun collector components, solar selective absorbers, diffusion barriers, isolation films in metal-insulator-metal structures and in wear-resistant coatings[49]. On its turn, zirconium oxynitride thin films are suitable for electronic applications like gate dielectrics[46]. ZrOxNy has also been
used as an element in temperature sensors and corrosion resistant coatings[46,50]. Lately ZrOxNy thin films have been used in decorative applications such as eyeglass frames, wristwatch
durability of the substrate by improving its hardness and its heat and corrosion resistance[46,51].
2.3.1.
Film growth – Structure Zone Model of Growth
The film near the interface is influenced by the substrate and it requires a certain thickness before the films acquires a particular growth mode[64]. When a growth mode is established the morphology of the film can be described by a structure Zone model (SZM) (Figure 2.5). The SZM was first used in vacuum-deposited coating and latter extended to sputter deposited films[64].
In Zone 1 of the model the adatom surface diffusion is insufficient to overcome the geometrical shadowing[70]. In this Zone the film has high surface area and a ‘’mossy’’ appearance[64]. The morphology developed is columnar and the columns can have different shapes depending on the crystallographic structure of the material[64,70]. The dimension of the columns ranges the microns but the grain size can be smaller than 1000 Å (0.1 μm), or be amorphous in the columns[64]. Once the columnar growth depends only of the surface geometry, angle of incidence, and adatom surface mobility, both amorphous and crystalline materials can develop columnar growth.
The angles of incidence of the adatom flux has major importance on the columnar growth. The columnar growth is intensified if the deposition flux orientation is off-normal once the valleys will get no flux. The off-normal angle of incidence can be related to a rough surface, or a smooth surface with off-normal deposition. In an off-normal incident flux, the columns grow towards the adatom source in opposition to the normal angle incidence, were the columns grow normal to the surface[64].
The Zone T of the model is characterized by a fibrous morphology, and represents a transition from Zone 1 to Zone 2[64,70]. The formation of the Zone T is caused by the bombardment of the substrate with high energy neutrals reflected from the target. The neutrals erode the peaks and fill the valleys partially[64].
In Zone 2 the growth of the films is ruled by adatom diffusion[64,70]. In this Zone the surface diffusion leads to the densification of the intercolumnar boundaries[64]. Thought the columnar remain, and the grain size increases[64].
In Zone 3, recrystallization, grain growth and densification occur as a consequence of the bulk diffusin[64,70]. The modified columnar structure is noticeable with single crystal
columns[64].
Figure 2.5 Representation of the structure Zone model for thin film growth[64]
2.4. ZrO
xN
ycoatings deposited by physical vapour deposition
Physical vapour deposition (PVD) processes have been applied with success to several technological fields due to the wide range of material combinations and thus property gradients[7]. Examples of PVD’s versatility include several types of optical filters, solar cells/collectors, structural components, automotive parts, among others[7].
PVD processes are widely used in the deposition of decorative coatings due to several characteristics of this process like the possibility of producing abrasion resistant coatings, the durability of the coatings and the controllability of the process[52,53]. Furthermore PVD is considered environmental friendly once chemical reactants are not used[52,54]. Various PVD techniques have been used to produce zirconium and titanium oxynitrides films like
radiofrequency reactive magnetron sputtering, direct current reactive magnetron sputtering, and reactive cathodic arc evaporation, among others[46].
Since the 1980’s reactive sputtering of thin films as been deeply investigated because sputtering metallic targets in the presence of a reactive gas makes easy to form compound films such as nitrides, oxides, carbides and their combinations[55]. Additionally, reactive magnetron sputtering has the advantage over other techniques that it can easily be scaled from small sized laboratory targets to industrial applications on large area substrates[56,57]. Moreover, the deposition of zirconium oxynitrides by reactive magnetron sputtering has advantages like high deposition rate on large substrates[34,58], control of the film composition, small temperature variation in the substrate during deposition, better adhesion of the deposited film, and thickness uniformity[34].
There are several examples on the literature that report the colour tones obtained from processing zirconium and titanium oxynitrides thin films, some of which will be presented below and summarized in Table 2.2.
Carvalho et al.[6] deposited ZrOxNy thin films onto high-speed steel, stainless steel and
silicon substrates by reactive dc magnetron sputtering. The gas atmosphere was composed of argon (working gas) and nitrogen + oxygen (reactive gas) with a 19:1 ratio. The working gas flow was kept constant (55 sccm), while the reactive gas flow ranged from 4 to 17.5 sccm. The samples were later characterized by means of ball cratering, x-ray diffraction (XRD) and spectrophotometry. The authors claim that the results evidence the influence of the reactive gas flow on film colour, which is directly correlated to the oxygen content. For low flow rates, with the increase of the flow rate from 4 to 5.5 sccm there is a colour change from bright yellow-pale to golden, the colour remains golden for flows as high as 7 sccm. For higher flow rates the film colour goes from red-brownish to dark blue at flow rates superior to 11 sccm.
Carvalho et al.[7] deposited ZrOx, ZrNy and ZrOxNy films on glass and silicon substrates by
reactive dc magnetron sputtering. The atmospheres were composed of argon + nitrogen, argon + oxygen for the deposition of ZrNy and ZrOx respectively. The ZrOxNy were deposited with a nitrogen
+ oxygen reactive gas mixture (17:3 ratio) and argon as working gas. The argon flow was constant (60 sccm) for all depositions whereas the reactive gases flow varied. The samples were then characterized by Rutherford backscattering spectroscopy (RBS), particle induced x-ray emission measurements, ball cratering, x-ray photoelectron spectroscopy (XPS) and x-ray diffraction. Regarding the surface appearance, for flows below 10 sccm the colour shifts from metallic (silver like) to golden, characteristic of the change form metal-like to nitride-based
compounds. For gas flows between 10 and 14 sccm, the colours ranged from red brownish to dark blue. Above 15 sccm of gas flow the samples revelled interference like tones no longer presenting the characteristic intrinsic colours observed for lower flows.
Vaz et al.[5] produced ZrOxNy samples by reactive rf magnetron sputtering onto
high-speed steel, stainless steel, silicon and glass substrates. The depositions were performed in an atmosphere with argon (working gas) and nitrogen + oxygen (reactive gas). The samples were prepared with a variation of the reactive gas from 0 to 6.5 sccm while the argon flow was constant. The bias voltage was also varied from -75 V to 0 V. The samples were then characterized by RBS, ball cratering, scanning electron microscopy (SEM) and atomic force microscopy (AFM). X-ray diffraction was also performed as well as spectrophotometry. Finally, the hardness of the samples was measured. Regarding to the coloration of the samples, the authors found out that with increase of oxygen content the colour vary from bright yellow-pink colour to red brownish at intermediate oxygen fractions to dark blue at highest oxygen fractions. The results suggest a strong dependence of the colour upon the oxygen content, and reveal that surface roughness also influences the colorations, since different waviness of the surface leads to different interaction of the radiation with the films surface leading to differences in the colour.
Table 2.2 Examples of the evolution of the colour in oxynitride systems whit the variation of reactive gas Reference System System conditions Evolution of the colour Reactive gas
(sccm) Carvalho et al.
[6] ZrOxNy
Reactive dc magnetron sputtering
Working gas: Ar (55 sccm) Reactive gas: N2+O2(4 to 17.5 sccm) (19:1) Bright yellow-pale Golden Red-brownish Dark blue 4 5.5 to 7 7<x<11 ≥11 Carvalho et al. [7] ZrOx; ZrNy; ZrOxNy
Reactive dc magnetron sputtering
Working gas: Ar (60 sccm) Reactive gas: O2 (0.5 to 15 sccm);
N2 (3 to 40 sccm); N2+O2 (6 to 40 sccm)(17:3)
Metallic silver like golden
Red brownish Dark blue
Interference like tones
2 to 10 10 14 15 to 30 Vaz et al. [5] ZrOxNy
Reactive rf magnetron sputtering
Working gas: Ar (100 sccm) Reactive gas: N2+O2 (0 to 6.5 sccm) Bias: -75 V to 0 V Bright yellow-pink colour Red brownish Dark blue -
The Ph.D thesis of Carvalho, P.[21], carried out previously in our research group, was studied more thoroughly than the remaining literature. This is because it can be considered as the ‘seed’ of this present thesis, since the idea is to expand the colour palette obtained in that work by an extensive exploration of the deposition parameter space. In section 2.5 it will be presented an overview of the main results of Carvalho which will be of help for understanding the
results of this thesis.
2.5. Summary of the main results from the work of Carvalho et al.[21]
Carvalho’s thesis main objective was to prepare ZrOxNy coloured-multifunctional thin films
with a wide range of properties. His focus was the study of the influence of the processing conditions (gases partial pressures and bias voltage, among others) in the particular film’s growth characteristics: composition, crystalline and electronic structure, and morphology and the subsequent changes in the properties of the coatings, namely the electrical, optical and functional ones.
2.5.1.
Deposition conditions
Four Series of samples (Table 2.3) were produced by direct current reactive magnetron sputtering. The first Series of samples was deposited in static mode using a gas atmosphere of argon (working gas) and a mixture of N2+O2 (reactive gas) with a 17:3 ratio. The base pressure
was bellow 2x10⁻⁴ Pa. The Series 2 was deposited with similar conditions of Series 1 but with a
N2+O2 mixture with a 19:1 ratio. The remaining conditions were the same.
Table 2.3 Summary of the deposition parameters of the four series
Series 1 Series 2 Series 3 Series 4
Target current density [A.m-2] 100 100 100 100
Argon Flow [sccm] 60 60 60 60
Gas mixture ratio (N2:O2) 17:3 19:1 17:3 -
Gas mixture (N2+O2) flow [sccm] 6 to 40 4 to 17.5 7.5 to 13.5 - Nitrogen flow range [sccm] 5.1- 34 3.8- 16.6 6.4- 11.5 10
Oxygen flow range [sccm] 0.9- 6 0.2- 0.89 1.1- 2 0- 3
Bias Voltage [V] Grounded Grounded -70 Grounded
Period of the pulse (T) [s] - - - 3
Ton [s] - - - 0.5 to 2.5
τmounting [s] - - - -10
τdescending [s] - - - 0.1
the substrates had a bias voltage applied of -70 V and the substrate holder was on rotation mode. Series 4 was produced with similar conditions to Series 1 but using a reactive gas pulsing process were the nitrogen mass flow was kept constant but the oxygen mass flow was modulated as a periodic function.
2.5.2.
Structure
The four Series of samples were structurally characterized by x-ray diffraction (see section 3.4.1 for details of the technique). It was possible to observe distinct structural arrangements in the four series with the variation of the gas flow. Four different types of structures were observed in the films; Figure 2.6 summarizes which types of structures were found in each series and the gas flow ranges in which they appear.
The films in Zone I crystalized in an fcc NaCl-type structure typical of ZrN films. Regarding the films from Zone II, the results indicate de development of a crystalline structure different from de ZrN fcc, a smooth transition of the Zone I structure towards a new one was observed. The reduced number of diffraction peaks with a significant broadening does not allow an accurate indexing of the structure, but the structure was labelled as Zr3N4 with oxygen
inclusions. In the films from Zones III and IV, which correspond to films with higher gas flow, the structures identified were mixtures of Zr2ON2 and ZrO2 for Zone III and ZrO2 in Zone IV.
Series 1 2 3 4
Variable N2+O2 Flow [sccm] Ton/T
Zone IV 40 - -
-Zone III 15- 30 17.5 13.5 0.83
Zone II 10- 14 12.5-17.5 11-11.5 0.67-0.83
Zone I 6-12 4-12.5 10.5 7.5- 0.17- 0.5
Figure 2.6 Summary of the types of structures observed in the films and the correspondent gas flow ranges
Co unt s ( a. u. ) Angle 2ϴ [º]
2.5.3.
Chemical composition
All the four series of samples were characterized by RBS in order to study the chemical composition of samples (see section 3.4.3. for details of the technique).
In Table 2.4 is possible to see the evolution of the atomic percentage of oxygen and nitrogen with the variation of the gas flow. The samples from Series 1 belonging to the Zone I have a small concentration of oxygen, indeed the first sample (6 sccm) has no oxygen which is in agreement with the indexed ZrN structure. With the increase of the reactive flow within Zone I the concentration of nitrogen increases and the oxygen concentration is still very low. In Zone II the concentration of oxygen and nitrogen are in agreement with a smooth transition from the ZrN structure towards a new one, Zr3N4. As the flow increases in Zone II the oxygen concentration
increases and the nitrogen decreases. With further increase of the gas flow, Zone III, an abrupt increase of the oxygen concentration is observed. This increase is probably correlated to the formation of another structure, Zr2ON2. The films prepared with 40 sccm, Zone IV, have the
highest oxygen concentration of the Series 1 samples and belong to a ZrO2 structure.
Series 2, as was already referred, was prepared with a different gas mixture than Series 1. Although the two series presented a similar structural evolution. In terms of the chemical composition, samples within Series 2 present a higher concentration of nitrogen when compared to samples of Series 1 prepared with the same gas flow, which was expectable due to the higher N2/O2 ratio of the reactive gas mixture.
Table 2.4 Evolution of the atomic percentage of oxygen and nitrogen for the four structural Zones identified by XRD for the 4 series of samples
Series 1 2 3 4 CO CN CO CN CO CN CO CN Zone IV 64.2 0.0 -- - - Zone III 47.1 11.9 12.9 47.0 23.0 40.0 19.2 37.1 14.7 44.5 Zone II 15.8 41.2 - - 19.9 41.0 14.6 41.1 8.6 46.4 11.4 48.0 19.1 41.0 Zone I 5.1 43.0 10.1 47.9 16.0 44.0 14.2 41.3 0.0 32.4 2.8 41.3 4.8 47,1 7,1 45.7 Series 3 was prepared with the same gas flow mixture than Series 1 but instead of grounded the substrate were biased with -70 V, and the samples were prepared in rotation mode. It was observed that although the samples from Series 3 were prepared using a bias voltage, the
structural evolution was similar to the observed in Series 1 and 2. Regarding the chemical composition, these conditions are equivalent to a deposition made with a higher reactive gas flow. With the increase of the reactive flow the chemical composition of the samples presented an evolution similar to the previous 2 Series.
Series 4 was prepared with the RGPP process as was already referred, and due to this the Series presented a smother increase in the oxygen content and also a smoother decrease in the nitrogen them the former Series. In Series 4 it was possible to observe that the structural evolution of the samples was similar to the evolution of the other 3 series. For the sample belonging to the Zone I, it is possible to see that the oxygen content is higher than the sample from Series 1, which could indicate that introducing oxygen in pulses may have a similar effect to a deposition with a higher gas flow.
The values of the chemical composition were plotted in a ternary diagram (Figure 2.7) in order to make it easier to visualise the evolution of the composition of each Series.
The first observation that can be made is that there is a concentration of the samples in a triangle formed by ZrO2, Zr3N4 and ZrN00.43, which corresponds to a small area of the diagram.
Moreover, all the samples appear to share a thin restricted ‘band’ of the diagram. This concentration can be due to the chosen reactive gas flows, once there is the intension to produce intrinsic coloured films, the flows were restricted to certain values. Additionally, the use of a reactive gas mixture composed of N2+O2 causes some composition restrictions namely due to the
different chemical reactivity of the gases.
It is possible to see in the diagram that Series 1 goes from ZrNy compounds (for low N2+O2
flows) to ZrOx compounds. This leads to conclude that at low flows the kinetic of the reaction
dominates, leading to the formation of ZrNy, and with the increase of the flow the samples have
increasing amounts of oxygen. If enough oxygen is available the thermodynamic of the reaction dominates leading to the formation of the ZrOx.
Comparing the evolution of Series 1 and 2 similar tendencies were observed in the two series. It is possible to see in Figure 2.7 that the tendency of Series 1 and 2 have a similar shape but the main difference is that the evolution of Series 2 occurs in a much smoother way and with smaller variations. It was concluded that the lower oxygen content of Series 2 atmosphere plays a decisive role in the smother transitions even though the same tendencies were observed.
![Figure 2.3 Schematic representation of the light-matter interaction processes: a) Absorption; b) Transmission; c) Scattering; d) Refraction; e) Reflection; f) Diffaction[16]](https://thumb-eu.123doks.com/thumbv2/123dok_br/17609053.820304/33.892.252.683.89.467/representation-interaction-absorption-transmission-scattering-refraction-reflection-diffaction.webp)