!" # $ $ %
Cast irons are important engineering materials, which possess a wide range of attractive properties. Their properties are significantly dependent on the microstructure of the cast, cast iron components. A way of controlling the microstructure of cast iron is through the control of cooling rates during solidification. To control cooling rate mould properties are important. This paper presents the report of a study of the effects of additions of iron filings to green moulding sand on the microstructure of grey cast iron. Five sand samples were prepared with different Fe content ranging from 1 wt% to 5 wt%. A control sand sample, which had no iron content, was also prepared. The properties of the sand samples were tested and used to cast some grey cast iron samples whose microstructure were observed by optical microscopy. The results show that addition of Fe filing does not have any adverse effects on the properties of green moulding sand; however, the microstructures show a dependence on heat storage capacity of the mould.
Keywords: graphite, graphitization, cementite, iron filings, cast iron
Introduction1
Cast irons (C.I.) form a most significant family of engineering materials (Rajput, 2006; DeGarmo et al., 1999). The term C.I. (cast iron) is a generic one referring to a family of materials differing widely in their properties. In general, a C.I. is an alloy of iron, carbon (up to about 4.0%) and silicon (up to about 3.5%), which ordinarily is not usefully malleable as cast (Heine et al., 2003). The classification, composition, properties and uses of the various groupings of C.I. are vast and well documented and could be found in Moffatt et al. (1964), Rajput (2006), DeGarmo et al., (1999), Heine et al. (2003).
The influence of chemical composition on the properties and uses of C.I. is largely related to the two alloying elements carbon and silicon and their effects on the process of graphitization. Both elements promote the formation of graphite as their percentages increase in the C.I.. Carbon may occur in cast iron as iron carbide (cementite), and is then referred to as combined carbon. It may also occur in free form as graphite. Graphitization is the process whereby free carbon is precipitated in the iron or chemically combined
carbon (Fe3C) is changed to free carbon (or graphite).
Another factor that significantly influences the microstructure of cast iron is the cooling rate during solidification. Generally, a fast cooling rate promotes formation of cementite. This is due to suppression of the graphitization process. A slower cooling rate allows sufficient time for graphitization. This most often leads to a mixed microstructure consisting of cementite and graphite (Moffatt et al., 1964). A major factor that determines the cooling rate of a casting is the heat storage capacity of the mould. This factor is significantly dependent on the properties of the mould materials.
Apart from the intrinsic properties of the molten metals such as fluidity, composition, segregation etc, which affects the soundness of the casting produced, the mould properties also play prominent role in determining the soundness of a casting.
The solidification pattern of a casting determines to great extent the soundness of the final casting produced. When a molten metal is poured into the mould, the first parts of the molten metal to solidify are next to the mould walls (Brophy et al., 1964), which readily conduct heat away. This is an indication of heat storage capacity of the mould, which is expressed as the root of the product of the
Paper accepted December, 2009. Technical Editor: Anselmo Eduardo Diniz
thermal conductivity, the specific heat capacity and the density of the mould materials.
Other factors that may affect the heat storage capacity of the mould include: the composition of the mould material, the moisture content and the temperature of the mould. Also, the nature of mould surface in terms of the degree of roughness or smoothness affects the flow of metal in the mould (Hadano and Yamamto, 1999). Generally, a change in the mould material can significantly affect the casting produced.
Sand casting is perhaps the most versatile of the casting methods (Ibitoye, 2005). This is as a result of its accompanying advantages over others, which include among others: wide range of castables sizes, flexibility to mechanization, ease of handling and cost effectiveness (Heine et al., 1967; Heine et al., 2003). Currently, these benefits presented by sand casting have not been explored to their full potentials in many of the developing countries (Ibitoye, 2005). The reasons for this low utilization of sand casting have been traced to problems faced by foundry industry in the developing countries. These problems are operational and technical in nature (Ibitoye and Ilori, 1998). Solving the needed material problem would be an incentive to development of the industry (Ibitoye, 2005).
Nomenclature
A = total frontal area of the air flow, area, m2
A = Standard sand sample which had no Fe filings content A1 = Standard sand sample which had 1 wt% Fe filings content A2 = Standard sand sample which had 2 wt% Fe filings content A3 = Standard sand sample which had 3 wt% Fe filings content A4 = Standard sand sample which had 4 wt% Fe filings content A5 = Standard sand sample which had 5 wt% Fe filings content Cos θ = Proportional to the resultant force of adhesion of a
multi-component surface, dimensionless
Fe filings = Powdered iron formed from machining of various iron components
fi = The fraction of component i in a multi-component surface, dimensionless
f Fe = The fraction of Fe in the standard sand mix, dimensionless fSiO2 = The fraction of SiO2 in the standard sand mix, dimensionless W12 = The work of adhesion which is the work required to separate
Greek Symbols
γ12 = interfacial energy of surface between surfaces 1 and 2,
J.m-2
γ1 = the surface energy of surface 1, J.m-2 γ2 = the surface energy of surface 2, J.m-2
γFe = The surface energy of Fe, J.m-2
γSiO2 = the surface energy of SiO2, J.m-2
λ = Thermal conductivity, W.m-1.K-1
λFe = Thermal conductivity of Fe, W.m-1.K-1 λSiO2 = Thermal conductivity of SiO2,, W.m-1.K-1
Experimental Procedure
New silica sand was obtained and this was mixed with bentonite, coal dust and water. The silica sand was obtained in bags of 25 kg. To every 25 kg of silica sand it was added 2.25 kg of bentonite, 1.5 kg of coal dust, 1.75 litres of water (see Table 1). The sand constituents were mixed using Ridsdale continuous muller.
Table 1. Standard composition of the green moulding sand used.
Materials Weight composition (wt%)
Silica sand 82
Bentonite 7
Coal dust 5
Water 6
With this composition of silica sand, other five different compositions of silica sand were prepared by addition of varying percentages of iron filings to the silica sand. A control sample, which had no Fe content, was also prepared (see Table 2).
Table 2. Specimen with percentages and masses of Fe filings contents.
Specimen Percentage of Fe filings (wt%) Mass of Fe filings (kg)
A - -
A1 1 0.3
A2 2 0.6
A3 3 0.9
A4 4 1.2
A5 5 1.5
The properties of the prepared sand samples were tested and recorded. The properties tested include: moisture content, green compressive strength, green shear strength, permeability, and shatter index. Ridsdale sand testing machines for sand strengths, shatter index, permeability and moisture content were used. Standard test procedures for testing sand properties were used. Standard test procedures for testing sand properties are well documented and could be found in the following literatures: Adedayo (2007); Ibitoye (2005); Heine et al. (2003); Clegg (1991). These sand samples were also used to prepare moulds of about 60 kg (both the cope and the drag) to cast samples of grey C.I. rods (25 mm diameter and 500 mm in length). The microstructural examination of these cast samples was done using optical microscopy. The length of the graphite flakes in the microstructure was measured as inspired by AFS and ASTM graphite flake type and size rating charts.
Result and Discussion
Tables 3, 4, 5, 6 and 7 show the results of sand properties for moisture content, green compressive strength, green shear strength, permeability and shatter index respectively. Table 8 is the result for
the sand compositions. Figures 1, 2, 3, 4, and 5 show the variation of moisture content, green compressive strength, green shear strength, permeability and shatter index with iron (Fe) content respectively. Figure 6 is a plot of the variation of length of graphite flakes with iron (Fe) content. Apart from moisture content, the properties of the sand tested, viz. green compressive strength, green shear strength, permeability and shatter index are direct reflections of the force of adhesion between the constituents of the moulding sand.
Table 3. Moisture content of the sand samples used.
Specimen
Percentage of Fe filings in the sand mix
(wt%)
Moisture content (%)
1 2 3 Average
A - 4.2 4.2 4.2 4.2
A1 1 4.1 4.3 4.2 4.2
A2 2 4.3 4.2 4.1 4.2
A3 3 4.3 4.3 4.3 4.3
A4 4 4.2 4.2 4.2 4.2
A5 5 4.2 4.3 4.1 4.2
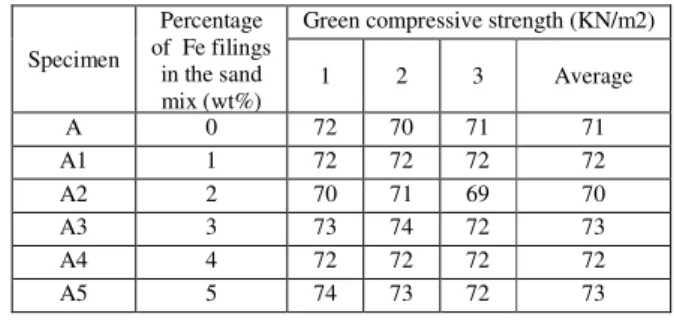
Table 4. Effects of the additives on the green compressive strength of the green moulding sand composition.
Specimen
Percentage of Fe filings
in the sand mix (wt%)
Green compressive strength (KN/m2)
1 2 3 Average
A 0 72 70 71 71
A1 1 72 72 72 72
A2 2 70 71 69 70
A3 3 73 74 72 73
A4 4 72 72 72 72
A5 5 74 73 72 73
Table 5. Effects of the additives on the green shear strength of the green moulding sand composition.
Specimen Percentage of Fe filings in the sand mix (wt%) Green shear strength (KN/m
2)
1 2 3 Average
A 0 19 18 17 18
A1 1 17 18 16 17
A2 2 18 19 17 18
A3 3 18 18 18 18
A4 4 17 16 15 16
A5 5 17 17 17 17
Table 6. Effects of the additives on the permeability of the green moulding sand composition.
Specimen Percentage of Fe filings
in the sand mix (wt%)
Permeability (Ml/min)
1 2 3 Average
A 0 148 145 146 146
A1 1 143 142 141 142
A2 2 152 150 151 151
A3 3 142 142 142 142
A4 4 145 145 144 145
Table 7. Effects of the additives on the shatter index of the green moulding sand composition.
Specimen
Percentage of Fe filings in the sand mix (wt%)
Shatter index
1 2 3 Average
A 0 30.50 20.50 30.60 30.20
A1 1 34.00 33.50 31.80 33.10
A2 2 36.70 35.43 33.92 35.35
A3 3 34.01 33.42 33.70 33.71
A4 4 33.02 32.14 31.98 32.38
A5 5 34.10 33.50 31.70 33.10
Table 8. Effects of the additives on the length of graphite flake in the microstructure of C.I cast by sand composition.
Specimen
Percentage of Fe filings in the sand mix (wt%)
Length of graphite flake in the microstructure of C.I. cast by the sample
A 0 0.05 to 0.1
A1 1 0.025 to 0.05
A2 2 0.025 to 0.05
A3 3 0.0125 to 0.025
A4 4 0.00625 to 0.0125
A5 5 0.003125 to 0.00625
4.18 4.2 4.22 4.24 4.26 4.28 4.3 4.32
0 1 2 3 4 5 6
Percentage of Fe filings (wt%)
M o is tu re c o n te n t (% ) Moisture content (%)
Figure 1. Moisture content of sand sample used.
69.5 70 70.5 71 71.5 72 72.5 73 73.5
0 1 2 3 4 5 6
Percentage of Fe filiings (wt%)
G re en c o m p re ss iv e st re n g th ( k N .m ^ -2 ) comp ressive strength (kN.m^-2)
Figure 2. Effect of additives on green compressive strength of the green moulding sand. 15.5 16 16.5 17 17.5 18 18.5
0 1 2 3 4 5 6
Percentage of Fe filings (wt%)
G re en s h ea r st re n g th ( k N .m ^ -2
) Green shear
strength (kN.m^-2)
Figure 3. Effect of additives on green shear strength of the green moulding sand. 141 142 143 144 145 146 147 148 149 150 151 152
0 1 2 3 4 5 6
Percentage of Fe filings (wt%)
P er m ea b il it y ( M l/ m in .) Permeability
Figure 4. Effect of additives on the permeability of green moulding sand.
29 30 31 32 33 34 35 36
0 1 2 3 4 5 6
Percentage of Fe filings (wt%)
S h at te r in d ex shatter index
Figure 5. Effect of the additives on shatter index of green moulding sand.
0 0.02 0.04 0.06 0.08 0.1 0.12
0 1 2 3 4 5
Percentage of Fe filings (wt%)
le n g th o f g ra p h it e fl ak es ( m
) length of flakes(m)
The force of adhesion in turn is dependent on the surface energies or the surface tensions of the constituents.
Generally, surface phenomena are driven primarily by an associated reduction in surface energy. Thus, higher energy surfaces are quickly and firmly adhered to by lower energy species (MIT,
2009). The work of adhesion (W12), which is the work required to
separate a unit area of interface between two phases, is mathematically expressed as:
W12 = γ1 + γ2 – γ12 (MIT, 2009) (1)
where γ1 and γ2 are the surface energies of the two different surfaces
and γ12 is the interfacial energy. It could be seen that as the values of
γ1 and γ2 get so close, the work of adhesion tends to be equal to the
work of cohesion. The implication of this is that for surfaces of similar energy values, there would not be significant difference between the work of adhesion and cohesion of a bicomponent
system, since γ12 would be tending to zero at those values of γ1 and
γ2. Silica sand and Iron have about 1.240 J.m-2 and 1.360 J.m-2
respectively (Brophy et al., 1964). By considering Cassie’s equation of multi-component surfaces:
Cos θ = f1.Cos θ1 + f2. Cos θ2 + …
…+ fi.Cos θi (Adedayo et al., 2008; MIT, 2009) (2)
where fi is the fraction of component i. Also knowing that Cos θis
proportional to the force of adhesion, we may thus evaluate the resultant surface energy of the Silica-iron component as:
γ = f Fe . γFe + fSiO2 . γSiO2 (3)
For the 5 wt% Fe sample γ = 1.246 J.m-2 and for the 1 wt% Fe
sample γ = 1.241 J.m-2. These values are close to the values of that
of only silica component (γ = 1.240 J.m-2). This shows that the force
of adhesion of bentonite for only silica component and silica-iron component would be similar. This explains the nature observed in the graphs of the properties measured, i.e. Figs. 1, 2, 3, 4, and 5. These properties are all (apart from moisture content) direct indications of the force of adhesion between the sand constituents. The reason for the non-monotonic nature observed in the graphs of the sand properties measured is probably due to variation in mixing efficiencies of the constituents of the sand mix. A graph is monotonic if it increases or decreases over an entire range (Bermant and Aramanovich, 1989).
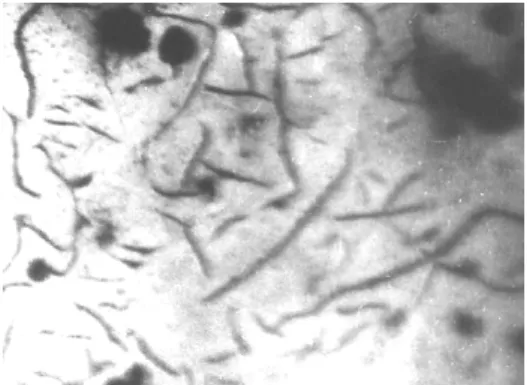
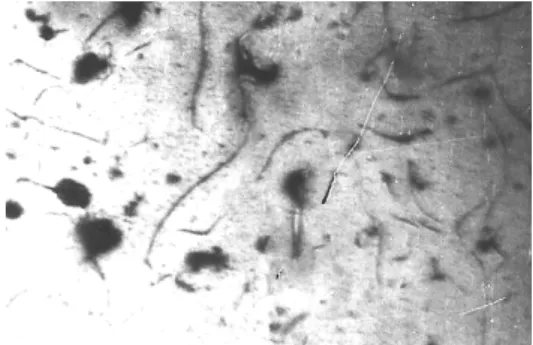
As for the observed microstructure, i.e. Figs. 7, 8, 9, 10, 11 and 12, the composition of the cast grey C.I. sample is: 3.2 %C, 2.1 %Si, 0.7 %Mn, 0.1 %S, and 0.6 % P, the rest Fe. This has carbon equivalent (C.E.) of 4.1. This indicates that the C.I. is hypoeutectic. An observation of the microstructure of the cast samples reveals a microstructure containing majorly graphite flakes and some spheroids. Considering the microstructure of the cast samples, the graphite flakes appear somewhat coarser in the cast sample prepared by the sand with 0 wt% (sample A). This trend decreases until that of microstructure prepared by sand mould containing 5 wt% Fe (i.e. sand sample A5). This observed trend is due to the significant changes in the heat storage capacity of the mould.
Figure 7. Microstructure of C.I. cast by sample A (x100).
Figure 8. Microstructure of C.I. cast by sample A1 (x100).
Figure 9. Microstructure of C.I. cast by sample A2 (x100).
Figure 11. Microstructure of C.I. cast by sample A4 (x100).
Figure 12. Microstructure of C.I. cast by sample A5 (x100).
Generally, during solidification, primary austenite (γ) will
separate out first until the eutectic temperature is reached. At eutectic temperature, eutectic consisting of austenite and graphite would form (Higgins, 2004). This is due to the presence of sufficient silicon, which increases the instability of cementite. The eutectic develops from nuclei and is in the form of approximately spherical particles known as eutectic cells. Graphite appears to be in the form of separate flakes, but, in fact, the eutectic cells are three dimensional and roughly spherical in shape (Higgins, 2004). Rapid cooling, which produces a greater degree of under cooling initiates the formation of a greater number of eutectic cells and also more frequent branching in the eutectic graphite “leaves”, giving much finer graphite flakes. The smaller the eutectic cells, the finer the graphite flakes. This explains the observed trend in gradual change from coarse to fine graphite flakes in the microstructure.
Also, if subsequent cooling proceeds slowly enough, at the
eutectoid transformation, instead of forming cementite (Fe3C), the
carbon diffuses to the nearest graphite flake and precipitates there as additional graphite (Flemings, 1974). The rejection of carbon in the austenite phase is a process controlled by diffusion, which in turn is temperature dependent.
The iron content of the mould induced this change in thermal conductivity of the mould. The thermal conductivity of Fe and wet
Silica are 63 W.m-1.K-1 and 0.657 W.m-1.K-1 respectively
(Nashchokin, 1979). Also, using Cassie equation approach, the resultant thermal conductivity of a 5 wt%Fe sand would be:
λ = fFe .λFe + fSiO2 .λSiO2 = 3.8 W.m
-1
.K-1 (4)
This value indicates a 6 times faster cooling rate than that consisting of only green moulding sand. The microstructures of grey C.I. are known to be sensitive to rates of cooling (Brophy et al., 1964; Rajan et al., 1998; DeGarmo et al., 1999; Heine et al., 2003; Rajput, 2006).
Conclusions
Green moulding sand, when properly prepared, is generally known to posses good properties required for casting. The research shows that addition of Fe filings to green moulding sand have no adverse effects on the casting abilities of the sand. This suggests that Fe filings could be added to green moulding sand to change its heat storage capacity without any adverse effects on the vital properties of green moulding sand. This heat storage capacity could be varied as may be required by adjusting the Fe filing content in the green moulding sand.
Acknowledgement
Nigerian Machine Tools Limited, Osogbo, Osun State, Nigeria is acknowledged for assistance in mould preparation, melting and casting of the grey cast iron samples.
References
Adedayo, A.V., Adesina, A.S., Alagbe, M., Expenyong, J.E., 2008, “Adaptation of Asa-dam river side sand for engineering use (paper I)”. Proceedings of 1st National Conference of Institute of Technology,
Kwara State Polytechnic, Ilorin, Nigeria. Vol. 1, No. 1, pp. 61-64. Adedayo, A.V., 2007, “Effects of iron filings on the properties of green moulding sand”, Presented at the Institute Seminar. Institute of Technology, Kwara State Polytechnic, Ilorin, Nigeria.
Bermant A.F., Aramanovich, I.G., 1989 “Mathematical Analysis”. Mir Publisher, Moscow, p. 41.
Brophy, J.H., Rose, R.M., Wulff, J., 1964, “The Structure and Properties of Materials, Thermodynamics”, Vol. 2, John Wiley and Sons, Brisbane, pp. 113-114, 188-189.
Clegg, A.J., 1991, “Premium Casting Processes”, 1st ed., Pergamon
Press, New York, p. 75.
DeGarmo, E.P., Black, J.T., Kosher, R.A., 1999, “Material and Processes in Manufacturing”, 8ed. John Wiley & Sons, NY, p. 93
Flemings, M.C., 1974, “Solidification Processing”, Materials Science and Engineering Series, McGraw-Hill, New York. p. 184
Hadano, Y., Yamamoto, S., 1999, “Preparation of Clay Coated Sand with a Vacuum Drying Stage for Flowability in Manufacture of Foundry Green-Sand Moulds”, Sintokogyo Ltd, Japan, p. 9
Heine, R.W., Loper, C.R., Rosenthal, P.C., 2003, “Principles of Metal Castings”, 26th reprint, TMH ed. New York, p. 86.
Heine, R.W., Loper, C.R., Rosenthal P.C., 1967, “Principles of Metal Castings”, New York, p. 86.
Higgins, R.A., 2004, “Engineering Metallurgy: Applied Physical Metallurgy”, 6th ed. Viva Books, New Delhi, pp. 355-356
Ibitoye, S.A., 2005, “Effect of the addition of sodium silicate and bulk density variation on the permeability of potter's clay-bonded moulding sand”, Nigerian Society of Engineers Technical Transactions, Vol. 40 No.2, pp. 67-77
Ibitoye, S.A. and Ilori, M.O., 1998, “Indigenous metal casting in Nigeria: its technnology, attendant problems, business prospects and policy implications”, Technovation, Vol. 18, No. 11, pp. 705-711
MIT, 2009, http://ocw.mit.edu/NR/rdonlyres/Materials-Science- and-Engineering/3-051JSpring-2006/4A278FCF-73A3-4C4C-99A7-81CBC6AE53E5/0/lecture2.pdf (Page 9)
Moffatt, W.G., Pearsall, G.W., Wulff, J., 1964, “The Structure and Properties of Materials”, Structure, Vol. 1, John Wiley and Sons, Brisbane, pp. 134, 195
Nashchokin, V., 1979, “Engineering Thermodynamics and Heat Transfer”, 1st ed., Mir Publisher, Moscow, p. 364.
Rajan, T.V., Sharma, C.P., Sharma, A., 1988, “Heat Treatment Principles and Techniques”, Prentice-Hall of India, Private Ltd, New Delhi, p. 289.