THIS
DOCUMENT
IS
NOT
AN
INVESTMENT
RECOMMENDATION
AND
SHALL
BE
USED
EXCLUSIVELY
FOR
ACADEMIC
PURPOSES
(SEE DISCLOSURES AND DISCLAIMERS AT END OF DOCUMENT)See more information at WWW.NOVASBE.PT Page 1/35
M
ASTERS IN
F
INANCE
E
QUITY
R
ESEARCH
A Top Player in a fast growing industry
EDP Renováveis is a well-diversified pure wind player, with operating capacity in both Europe and America. Current installed capacity is over 7 GW and Pipeline exceeds 29 GW, spread over projects in different stages of maturity.
Growth Strategy: Focus on U.S. and Eastern Europe
The company’s key market is the U.S. (3,323 GW installed and 18,515 GW in Pipeline), followed by Spain (2,194 GW installed and 4,018 GW in Pipeline). Future growth is expected to come mainly from U.S. and Eastern Europe (Poland and Romania). YE2012 installed capacity is expected at 8,454 GW (Vs. 2011E 7,539 GW).
Regulatory Support
We do not anticipate major changes in the regulatory schemes in place. However, the current economic crisis is a matter of concern for new regulatory frameworks, namely in what regards future US and Spanish incentives system, to be defined until the end of 2012.
Reduced Capital Needs
Increased generating capacity and decreased growth targets have allowed the company to increase the percentage on CAPEX covered by operating cash flow, thus reducing the need for new capital. Average Net Debt / EBITDA 2012-2015E at 4.56x (Vs. 2011E 5,29x).
SOTP
We maintain our Buy recommendation, valuing the company at 6,03 €/share. According to our estimates, operating capacity at YE2012 is worth 4,68 €/share, 2013-2015E pipeline is worth 0,20
€/share and Repowering & Terminal Value is responsible for the remaining 1,16 €/share.
E
DP
R
ENOVÁVEIS
C
OMPANY
R
EPORT
UTILITIES
03
J
ANUARY2012
S
TUDENT
:
L
UIS
V
ARELA
F
ILIPE
[email protected]
Uncertainty Ahead
Strains on credit lead to slower growth
Recommendation: BUY
Vs. Previous Recommendation BUY
Price Target FY12: 6,03 €
Upside / (Downside) (%) 26,6%
Price (as of 3-Jan-12) 4,763 €
Reuters: EDPR.LS, Bloomberg: EDPR PL
52-week range (€) 3,73-5,27
Market Cap (€m) 4.294,9
Outstanding Shares (m) 872,3
Free Float 22,5%
Average Volume (52-week) 902.935 Source: Euronext, Company Data
3M 6M YTD
Price Performance (%) 15,6 3,9 9,0 Source: Euronext, Nova Equity Research
(Values in € millions) 2010 2011E 2012F Adjusted Gross Profit 948 1.179 1.363
EBITDA 713 876 1.025
EBITDA Margin 75% 74% 75%
EBIT 290 438 547
EBIT Margin 31% 37% 40%
EPS 0,09 0,17 0,23
Net Profit 80 145 205
Net Debt / EBITDA - 5,29 4,76 EV / EBITDA (x) 14,11 11,48 9,81 EV / EBIT (x) 34,70 22,98 18,38
P/E - 36,11 25,62
Source: Nova Equity Research
5.000 7.000 9.000
2,5 4,0 5,5
Dez-10 Abr-11 Ago-11 Dez-11
EDPRENOVÁVEIS COMPANY REPORT
THIS
DOCUMENT
IS
NOT
AN
INVESTMENT
RECOMMENDATION
AND
SHALL
BE
USED
EXCLUSIVELY
FOR
ACADEMIC
PURPOSES
(SEE DISCLOSURES AND DISCLAIMERS AT END OF DOCUMENT)PAGE 2/35
EDP Renováveis: Summary Tables
Income Statement (€m) 2010 2011E 2012E 2013E 2014E Cash Flow Statement (€m) 2010 2011E 2012E 2013E 2014E
Adjusted Gross Profit 948 1179 1363 1439 1519 Net Income 80 145 205 220 261 Operating costs (Opex) (235) (302) (338) (362) (388) Depreciation 423 438 478 501 523 EBITDA 713 876 1.025 1.077 1.132 Change in Operating Assets (170) (500) (402) (555) (837) Depreciation and Amortization (423) (438) (478) (501) (523) Change in Operating Liabilities (51) 239 244 164 78 EBIT 290 438 547 576 608 Cash Flow Operating Activities 282 323 525 330 26 Financial Costs (169) (250) (276) (284) (272) CAPEX (1801) (1013) (740) (401) (386) Pre-tax Profit (EBT) 121 188 272 292 336 Financial Investments (13) 14 (5) (2) 3 Income Taxes (38) (39) (63) (67) (71) Other Cash Flows 376 179 46 49 34 Minority Interests 3 4 4 4 5 Cash Flow Investing Activities (1438) (819) (698) (355) (349)
Net Income 80 145 205 220 261 Change in Equity (14) 4 35 (21) 1
Change in Debt 1151 389 56 (52) 322
Balance Sheet (€m) Cash Flow Financing Activities 1136 393 90 (73) 323
Tangible Fixed Assets 9.982 10.579 10.836 10.732 10.600 Change in Cash (20) (103) (84) (97) () Intangibles / Goodwill 1.367 1.344 1.349 1.353 1.348 Cash - Beginning of the Period 444 424 320 237 140 Financial Investments 64 59 61 62 61 Cash - Ending of the Period 424 320 237 140 140 Deferred Tax assets 39 29 32 33 32
Non-Current Assets 11.451 12.011 12.278 12.180 12.040
Inventories 24 22 24 28 25 Growth
Receivables 900 1.402 1.801 2.353 3.192 Revenues (%) n.a. 28% 17% 6% 5%
Other Current Assets 36 36 36 36 36 EBITDA (%) n.a. 23% 17% 5% 5%
Cash 424 320 237 140 140 EBIT (%) n.a. 51% 25% 5% 6%
Current Assets 1.384 1.780 2.098 2.556 3.393 Net Income (%) n.a. 81% 41% 8% 18% Total Assets 12.835 13.792 14.377 14.737 15.433 EPS (%) n.a. 81% 41% 8% 18% Shareholder's Equity 5.268 5.413 5.648 5.843 6.100
Minority interest 126 129 133 138 143 Ratios
Dividends - - 29 41 44 EBITDA Margin (%) 75% 74% 75% 75% 74%
Total Equity 5.394 5.542 5.782 5.980 6.242 EBIT Margin (%) 31% 37% 40% 40% 40% Financial Debt 3.534 3.741 3.834 3.806 4.136 ROE (%) 1,5% 2,6% 3,5% 3,7% 4,2% Provisions 54 54 54 54 54 Net Debt / EBITDA (x) - 5,29 4,76 4,51 4,43 Deferred Tax liability 372 344 353 356 351
Institutional Partnership 1.644 1.825 1.788 1.765 1.757 Valuation
EDPRENOVÁVEIS COMPANY REPORT
THIS
DOCUMENT
IS
NOT
AN
INVESTMENT
RECOMMENDATION
AND
SHALL
BE
USED
EXCLUSIVELY
FOR
ACADEMIC
PURPOSES
(SEE DISCLOSURES AND DISCLAIMERS AT END OF DOCUMENT)PAGE 3/35
Table of Contents
Summary Tables ... 2
Investment Case ... 4
Company overview ... 6
Valuation ...12
Key Risks ...17
Markets & Regulation ...19
Appendix ...32
EDPRENOVÁVEIS COMPANY REPORT
THIS
DOCUMENT
IS
NOT
AN
INVESTMENT
RECOMMENDATION
AND
SHALL
BE
USED
EXCLUSIVELY
FOR
ACADEMIC
PURPOSES
(SEE DISCLOSURES AND DISCLAIMERS AT END OF DOCUMENT)PAGE 4/35
Investment Case
EDP Renováveis (EDPR) is a pure renewable player, and one of the leading green power generating companies in the world, with more than 7GW of installed capacity. Historically, the company presents a steady growth in installed capacity, having increased by 6x its gross MW from 2005 to 2010.
Chart 1: Top Players - Wind Installed Capacity by Company (9M 2011)
Source: EDPR, Nova Equity Research
Despite the current economic reality, investments in renewable sources of energy should continue to grow in the upcoming years, fuelled by increasing global demand1, mainly from developing countries and emerging economies. In Europe, the RES Directive is expected to continue to boost the sector, as member states have binding targets for renewable energy shares of final energy consumption by 2020. Nevertheless, there is some concern over the possibility that financial consolidation in some EU economies may lead to a cut in incentives to the sector. In the US, industry incentives will be reviewed in 2012, but the expectations are for the current scheme to be extended, once again.
The probability of a Greek default and the contagious effect to other economies brought further instability to the markets and led to increased credit restrictions and to an overall deterioration of financing conditions. On the other side, the increased volatility of the markets also led to the escalation of the prices of fossil fuels and electricity, turning renewable energy sources more appealing.
According to IEA’s forecasts, renewables based generation in 2030 should be 3x
the value of 2008, and its share in global electricity generation should increase from 20%2 (2010) to close to 30%. Global investment in renewable energy totalled a record value of $211 billion in 2010 (Vs. $160 billion in 2009), with emerging economies taking the lead for the first time ever. Despite this, and given that renewables are generally more capital intensive than fossil fuels,
sector’s investment needs are estimated at around $5,7 trillion over the period 2010-2035. Subsidies to the sector should also continue to increase over this
1 Expected to increase by one third between 2010 and 2035, according to the International Energy Agency 2
Mainly from hydropower (16,1%) and wind power (3%)
13,45 8,47
7,28 7,04 6,89
Iberdrola Renovables
NextEra EDP Renováveis Longyuan Acciona
Chart 2: Global Installed Capacity by Company (YE2010)
Chart 3: YoY Growth in Installed Capacity by Company
Source: GWEC, Nova Equity Research
Chart 4: OIL and VIX
Source: Bloomberg 6,4% 4,2% 3,4%
3,3% 3,2%
79,5%
IBR Next Era EDPR LongYuan Acciona Others
21% 11%
22%
25% 18% 10%
45% 27% 20%
93% 80% 46%
19% 36% 1%
28% 32% 24%
2008 2009 2010
Global Acciona LongYuan EDPR Next Era IBR
10 30 50
20 70 120
EDPRENOVÁVEIS COMPANY REPORT
THIS
DOCUMENT
IS
NOT
AN
INVESTMENT
RECOMMENDATION
AND
SHALL
BE
USED
EXCLUSIVELY
FOR
ACADEMIC
PURPOSES
(SEE DISCLOSURES AND DISCLAIMERS AT END OF DOCUMENT)PAGE 5/35
period, to a value close to $250 billion, or 0,21% of global GPD, by 2035, versus the $66 billion in 2010, 0,1% of global GDP. Despite the magnitude of these values, they are still far from the value of fossil-fuel subsidies, which totalled $409 billion in 2010 (0,65% of global GDP) and, without reform, are expected to reach a value of $660 billion by 2020, or 0,7% of global GDP.
Wind remains the most attractive resource for power generation and is expected to increase, on average, 18,4%3 per year between 2011 and 2015, to a cumulative global installed capacity of 459GW in 2015 (Vs. 197GW in 2011). With current pipeline of more than 29GW (excluding under construction), EDPR is well diversified and operates in countries with support frameworks well-defined and implemented. The company was successful in adjusting its growth strategy to reflect current economic conditions, which allowed them to maintain a lower but stable growth. Moreover, since most part of their revenues is not directly exposed to market prices (see chart 9), the company faces lower risk on cash flow from operating activities.
Strategic advantages
With increasing presence in the sector, and maintaining its ability to meet growing demand for generating capacity, we consider EDPR’s key competitive advantages to be:
Early-mover – Operating Wind since 1996, EDPR has been able to acquire and secure strong pipeline in some of the most attractive locations, which helps explaining the above market load factors achieved (see chart 14). We expect part of the company’s current pipeline, mainly in the US, to be in locations with high wind resources not fully exploited and, as so, we consider the company will continue to benefit from its early mover position.
Stable and predictable projects – The Company is focused on markets with stable and supportive regulation, and has low exposure to market prices (see chart 9), which allows for an accurate prediction of cash flows.
Pure-Wind – EDPR concentrated its entire activity on Wind, the most attractive resource for power generation. We consider that the expertise and know-how gained allowed for a level of specialization and
3
GWEC – Global Wind 2010 Report
Chart 5: Global New Investment in Renewable Energy 04-10
Source: REN21 22
41 63 104
130 160 211
04 05 06 07 08 09 10
Bill
io
n
US
EDPRENOVÁVEIS COMPANY REPORT
THIS
DOCUMENT
IS
NOT
AN
INVESTMENT
RECOMMENDATION
AND
SHALL
BE
USED
EXCLUSIVELY
FOR
ACADEMIC
PURPOSES
(SEE DISCLOSURES AND DISCLAIMERS AT END OF DOCUMENT)PAGE 6/35
experience that has to be taken into account, namely in terms of wind assessment knowledge and optimal placement of turbines in the field. Although hard to quantify, we understand the optimization of such variables should have a positive effect on Cash Flows, thus translating a comparative advantage.
Grows with the market – With strong pipeline (see table 1) in some of the most attractive locations and markets in terms of regulatory framework, the company has the flexibility to adjust its growth strategy according to
each one’s development.
Company Overview
Profile
EDPR is 77,5% owned by Portuguese utility EDP, and is responsible for holding and operating EDP’s European and North American renewable energy assets and activities. It has moved from an Iberian focused company to a global player, operating in Europe, US and Brazil. With operating capacity exceeding 7GW and a pipeline of more than 29GW, the company has been able to maintain a steady growth in the markets in which it operates.
EDPR’s installed capacity is mainly located in Spain and the US (see Chart 7), but the company in increasing its exposure to Eastern Europe Economies (Poland and Romania) and Brazil.
Chart 6: EDPR Installed Capacity and Market Share
Source: Nova Equity Research
Inception
The company’s history goes back as early as 1993, when Genesa (company integrated in the Group) installed its first wind farm. Since then, the business has grown and the expansion strategy was focused mainly in selective acquisitions
3,03 4,40
5,58 6,68
7,54
2007 2008 2009 2010 2011E
GW
Installed Capacity Evolution
3,4% 3,2% 3,7% 3,5%
2007 2008 2009 2010
EDPR's Global Market Share Chart 7: EDPR Installed Capacity
Breakdown (9M 2011)
Source: EDPR
32%
9%
11% 48%
1%
Spain Portugal RoE
US Brazil
4%
1% 3%
3%
RoE
France Belgium
EDPRENOVÁVEIS COMPANY REPORT
THIS
DOCUMENT
IS
NOT
AN
INVESTMENT
RECOMMENDATION
AND
SHALL
BE
USED
EXCLUSIVELY
FOR
ACADEMIC
PURPOSES
(SEE DISCLOSURES AND DISCLAIMERS AT END OF DOCUMENT)PAGE 7/35
and the development of Greenfield projects. Acquisitions targeted pipelines rather than existing capacity, so as to assure potential for future growth.
Going Public
Taking advantage of the increased investment and momentum of the industry, renewable energy companies have started going public in a big way in the last 5 years. In June 2008, EDPR sold 22,47% of its share capital in what was the largest operation of its kind in Western Europe during that year. Before that, EDF Nouvelles (EEN) sold roughly 20% of its share capital in 2006 and Iberdrola Renovables (IBR) accomplished the second largest IPO in 2007, placing also 20% of its share capital in the market. The rationale behind these was that the development and operation of generation assets from renewable sources were activities with low visibility in the markets and a small number of competitors. This, along with the momentum of the sector, was perceived by the companies as an opportunity to emphasize the value and visibility of their renewable energy divisions and, as so, for value creation.
The unfolding of the economic and financial crisis and the consequent cooling of the global economy brought uncertainty to the markets and, with it, credit became scarcer and more expensive. Concerns about the reduction of incentives and subsidies to the sector also emerged, as there was an increasing pressure for governments to cut spending. All these, allied to the capital intensive profile of the renewables industry, were seen as threats to the growth prospects of “green” companies, putting a downward pressure on their share prices.
As the crisis escalated, the need to increase efficiency and reduce costs led to a trend of re-incorporation of green companies, and both IBR and EEN were already merged by acquisition. With this, companies try to avoid the risk of cannibalization of shareholders when competing for equity. The resulting company ends up larger and with a reinforced structure, and thus better suited to undertake more demanding projects (in terms of financial resources needed), with less limitations. Synergies also play a role here, and estimates for the case
of IBR point to an annual value of €20 million in cost savings, starting in 2012.
In the case of EDPR, although the company is publicly listed in NYSE Euronext Lisbon, EDP Group still retains full control, owning 77,5% of the shares. Though the company has been able to secure finance needs so far, financing costs have increased, initial capacity targets were not met4 and the growth objectives had to
4
Initial target consisted of average 1,4GW yearly additions, to a cumulative 10,5GW of installed capacity by 2012.
Chart 8: Share Price Evolution
Source: Bloomberg 1,5
4 6,5
Dez-07 Fev-09 Abr-10 Jun-11 IBR
15 30 45 60
Out-06 Mai-08 Dez-09 Jul-11 EEN
3 5,5 8
EDPRENOVÁVEIS COMPANY REPORT
THIS
DOCUMENT
IS
NOT
AN
INVESTMENT
RECOMMENDATION
AND
SHALL
BE
USED
EXCLUSIVELY
FOR
ACADEMIC
PURPOSES
(SEE DISCLOSURES AND DISCLAIMERS AT END OF DOCUMENT)PAGE 8/35
be adjusted. As current debt market conditions will likely continue to inflate financing costs, affecting profitability, we understand the reintegration of EDPR into EDP is a possibility that cannot be discarded. Furthermore, China’s largest clean energy group (China Three Gorges) just acquired 21,35% of EDP’s share capital and stated their specific interest in the renewables business, committing
to invest €2 billion in it until 2015. As so, we consider this strategic partnership
will increase EDP’s focus on the green business, thus leaving the door open for a possible merger of operations in the future.
Strategy
EDPR’s growth strategy targets a balance between growth, profitability and controlled risk. This explains the focus on geographies were the regulatory environment is stable and supportive, and therefore allow for a reasonable prediction of cash flows. It also helps explaining the focus on Wind, given that it remains the most attractive resource in terms of technological maturity and cost-efficiency.
The company targeted 10,2 GW of installed capacity by YE2012, but this figure was reviewed due to the macro environment. Considering EDPR’s new forecasts for yearly additions in 2011 and 2012 (800-900MW from 1,4GW), we expect the company to have a total of 8,4GW of operating capacity by YE2012.
Despite having downward adjusted its growth targets, the company has been able to maintain stable growth, while at the same time reducing capital needs and exposure to market prices.
Chart 9: Stable Growth
EBITDA & OCF CAPEX Remuneration Breakdown
Source: EDPR US and Spain remain EDPR’s most important markets, accounting for 80% of the
company’s installed capacity. Nevertheless, as Iberian markets get more mature and, consequently, less attractive, we expect a transfer of capacity to the more appealing Eastern Europe and Brazil, which we forecast will grow considerably in the near future (see Markets and Regulation). Apart from these, we understand
294 392
567 438 543
713
2008 2009 2010
€
M
ill
ion
OCF (Bef. CAPEX) EBITDA
2091 1846 1401
2008 2009 2010
€
M
ill
ion
53% 38%
9%
EDPRENOVÁVEIS COMPANY REPORT
THIS
DOCUMENT
IS
NOT
AN
INVESTMENT
RECOMMENDATION
AND
SHALL
BE
USED
EXCLUSIVELY
FOR
ACADEMIC
PURPOSES
(SEE DISCLOSURES AND DISCLAIMERS AT END OF DOCUMENT)PAGE 9/35
US will continue to be the main driver of growth in the upcoming years, as a consequence of the increasing political and regulatory support to the sector. We also expect the focus in the US market to be further reinforced by the current uncertainty in the European markets generated by the sovereign debt crisis.
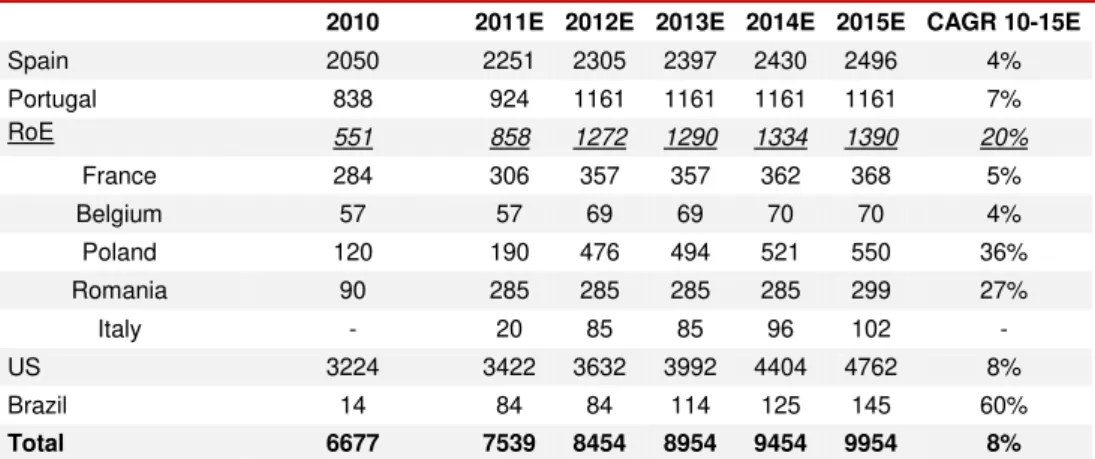
Chart 10: EBITDA Forecasts
Source: Nova Equity Research
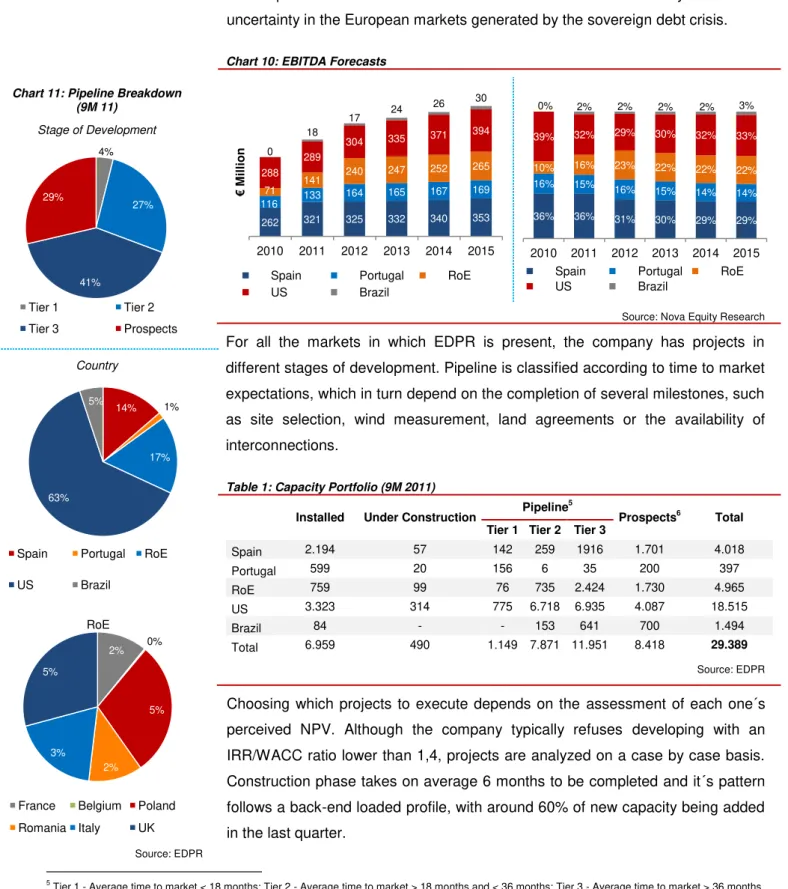
For all the markets in which EDPR is present, the company has projects in different stages of development. Pipeline is classified according to time to market expectations, which in turn depend on the completion of several milestones, such as site selection, wind measurement, land agreements or the availability of interconnections.
Table 1: Capacity Portfolio (9M 2011)
Installed Under Construction Pipeline
5
Prospects6 Total
Tier 1 Tier 2 Tier 3
Spain 2.194 57 142 259 1916 1.701 4.018
Portugal 599 20 156 6 35 200 397
RoE 759 99 76 735 2.424 1.730 4.965
US 3.323 314 775 6.718 6.935 4.087 18.515
Brazil 84 - - 153 641 700 1.494
Total 6.959 490 1.149 7.871 11.951 8.418 29.389
Source: EDPR
Choosing which projects to execute depends on the assessment of each one´s perceived NPV. Although the company typically refuses developing with an IRR/WACC ratio lower than 1,4, projects are analyzed on a case by case basis. Construction phase takes on average 6 months to be completed and it´s pattern follows a back-end loaded profile, with around 60% of new capacity being added in the last quarter.
5 Tier 1 - Average time to market < 18 months; Tier 2 - Average time to market > 18 months and < 36 months; Tier 3 - Average time to market > 36 months 6
Projects at an initial phase of wind analysis and site feasibility
262 321 325 332 340 353
116 133
164 165 167 169
71 141
240 247 252 265
288 289
304 335 371
394
0 18
17 24
26 30
2010 2011 2012 2013 2014 2015
€
M
ill
ion
Spain Portugal RoE US Brazil
36% 36% 31% 30% 29% 29%
16% 15% 16%
15% 14% 14%
10% 16% 23% 22% 22% 22%
39% 32% 29% 30% 32% 33%
0% 2% 2% 2% 2% 3%
2010 2011 2012 2013 2014 2015 Spain Portugal RoE US Brazil
Chart 11: Pipeline Breakdown (9M 11)
Stage of Development
Country
Source: EDPR 4%
27%
41% 29%
Tier 1 Tier 2
Tier 3 Prospects
14% 1%
17%
63% 5%
Spain Portugal RoE
US Brazil
2% 0%
5%
2% 3%
5%
RoE
EDPRENOVÁVEIS COMPANY REPORT
THIS
DOCUMENT
IS
NOT
AN
INVESTMENT
RECOMMENDATION
AND
SHALL
BE
USED
EXCLUSIVELY
FOR
ACADEMIC
PURPOSES
(SEE DISCLOSURES AND DISCLAIMERS AT END OF DOCUMENT)PAGE 10/35
According to EDPR reviewed figures, and taking into account the foreseeable effects of the current financial crisis, we remain cautious about capacity growth in the coming years. We expect the company to increase its operating capacity by
862MW in 2011 and 915MW in 2012, in line with the company’s estimates.
Although the growth targets for the period starting in 2012 have not yet been revealed, we estimate annual additions of 500MW in the triennium 2013-2015.
Table 2: Capacity Forecasts
2010 2011E 2012E 2013E 2014E 2015E CAGR 10-15E
Spain 2050 2251 2305 2397 2430 2496 4%
Portugal 838 924 1161 1161 1161 1161 7%
RoE 551 858 1272 1290 1334 1390 20%
France 284 306 357 357 362 368 5%
Belgium 57 57 69 69 70 70 4%
Poland 120 190 476 494 521 550 36%
Romania 90 285 285 285 285 299 27%
Italy - 20 85 85 96 102 -
US 3224 3422 3632 3992 4404 4762 8%
Brazil 14 84 84 114 125 145 60%
Total 6677 7539 8454 8954 9454 9954 8%
Source: Nova Equity Research
Turbines and Suppliers
Wind turbines are responsible for 75% to 80% percent of CAPEX, on average, with the remaining 25% to 30% attributable to the so called Balance of Plant, comprising civil works, infrastructures and connection to the grid, among others. Given the wide variety of turbines in the market, each with specific characteristics and production patterns, the decision process of which turbine to use usually implies analysis of both the site and turbine characteristics so as to optimize future production.
Turbines cost is mainly driven by technological developments, prices of raw materials (mainly steel) and balance between demand and supply. Nevertheless, history has shown that a large proportion of cost reductions have also come from the learnings and economies of scale associated with large-scale global deployment.
After a period of supply imbalances and inflated prices caused by the boom in the sector, we expect the industry to catch up with growing demand, driving prices down. Also, turbine manufacturers are increasingly covering the full supply chain, which, along with wind operator’s tendency to secure long-term contracts, reduces the risk of scarcity and prices volatility. On the other side, Chart 12: Top 10 Wind Turbine
Manufacturers (2010)
Chart 13: EDPR Suppliers (YE 2009)
Source: EDPR; Nova Equity Research 14%
11%
9%
9% 7% 7% 7% 6% 6%
4% 20%
Vestas, Germany Sinovel, China GE Wind, USA Goldwind, China Enercom, Germany Suzlon Group, India Dongfang, China Gamesa, Spain
Siemens Wind Power, Denmark United Power, China
Others
40%
14% 8% 7% 16%
15%
Vestas GE Suzlon
EDPRENOVÁVEIS COMPANY REPORT
THIS
DOCUMENT
IS
NOT
AN
INVESTMENT
RECOMMENDATION
AND
SHALL
BE
USED
EXCLUSIVELY
FOR
ACADEMIC
PURPOSES
(SEE DISCLOSURES AND DISCLAIMERS AT END OF DOCUMENT)PAGE 11/35
technological development implies investment in R&D, meaning higher costs and, therefore, higher selling prices. All in all, as the market walks the learning curve (see Appendix II), we expect further decreases in turbine prices over time. EDPR has a diversified base of turbine suppliers, focused on players with proven track records. This grants the company the flexibility to select the most adequate turbine for each site, while also helping to mitigate potential risks associated to buying turbines from less-established companies. It also reduces turbine’s performance and technological risk, which is particularly relevant when considering that the majority of the company´s suppliers are top players in their markets. Furthermore, EDPR strategically secures part of its turbine needs two to three years in advance, thus avoiding turbine market’s unpredictability and safeguarding the probability of projects execution.
Site Selection
Apart from issues like accessibility and grid connection, the main driver of site selection is the load factor or, in other words, the fraction of time a turbine is effectively producing energy during a day or year. Load factors vary according to the geography, with windy locations benefiting from higher load factors.
To assess the potential of a given site, in-depth analysis about wind patterns and behavior is always performed (usually no less than 24 months of data collection). The knowledge gathered will, in turn, help the company define the layout of the project and the placement of the turbines so as to maximize its efficiency. Being an earlier mover in most of its markets and having extensive experience in analyzing and measuring wind potential allowed the company to secure some of the best locations, with premium load factors. We expect part of EDPR’s current pipeline, mainly in the US, to be in locations with high wind resources not fully exploited and, as so, we consider the company will continue to benefit from its early mover position.
Although the best sites will tend to become scarcer as markets mature, we understand technological developments will make available sites that currently cannot be explored. Adding this to the fact that wind availability has been historically stable, we forecast long term load factors to be in line with the company´s historical values.
Chart 14: Avg. Load Factors
(2007-2009)
Forecasts
Source: EDPR; Nova Equity Research 26,3% 26,1% 26,3%
25,5% 25,5%
23,0%
Spain Portugal RoE EDPR Market
26,5% 26,8% 24,3%
31,8% 25,5%
EDPRENOVÁVEIS COMPANY REPORT
THIS
DOCUMENT
IS
NOT
AN
INVESTMENT
RECOMMENDATION
AND
SHALL
BE
USED
EXCLUSIVELY
FOR
ACADEMIC
PURPOSES
(SEE DISCLOSURES AND DISCLAIMERS AT END OF DOCUMENT)PAGE 12/35
Financing
The company’s funding strategy aims at supporting growth while maintaining a
solid and sustainable capital structure. EDPR’s debt has a long term maturity
profile (78% matures after 2018) and more than 90% of it was contracted at fixed rates. This matches the business model with the Cash-Flow profile, while also allowing the company to minimize exposure to interest rates volatility.
Chart 15: Debt Distribution
Source: GWEC
Financing is secured through three different sources: the most important is the
parent company (EDP), which has committed to finance EDPR’s investment plan
(at market spreads); Institutional Partnerships, in the US, allow the company to finance on average 50% of a project’s initial investment (see Markets and Regulation); Project Finance is mainly used for projects in markets relatively new to the company, or when financing conditions are better than those of EDP loans.
Valuation
We valued EDPR using a DCF based sum-of-the-parts (SoP). Assets were evaluated country-by-country on the basis of operating capacity (YE 2012E), projects to be installed until 2015 and Repowering/Terminal Value.
We considered three different scenarios (see Appendix IV), to which we attributed different probabilities of occurring. Weighting the scenarios by their probabilities, we estimate EDPR’s equity to be worth € 6,03 per share (price
target YE2012), denoting a buy recommendation.
3% 3% 2% 2% 2% 8% 2%
78%
2011 2012 2013 2014 2015 2016 2017 >2018
Chart 16: Debt Profile
Type
Currency
Source: EDPR
91% 9%
Fixed Variable
57% 37%
7%
EDPRENOVÁVEIS COMPANY REPORT
THIS
DOCUMENT
IS
NOT
AN
INVESTMENT
RECOMMENDATION
AND
SHALL
BE
USED
EXCLUSIVELY
FOR
ACADEMIC
PURPOSES
(SEE DISCLOSURES AND DISCLAIMERS AT END OF DOCUMENT)PAGE 13/35
Table 3: SoP Valuation
Cons.
Capacity € mn € / share % EV
Operating Wind Farms (2012E)
Spain 2.305 2.434 2,79 24%
Portugal7 1.161 860 0,99 8%
RoE 1.272 2.297 2,60 22%
USA 3.632 2.154 2,48 21%
Brazil 84 171 0,21 2%
Total Value Existing Business 8.454 7.916 9,07 77%
Pipeline (2013E-2015E) 1.500 357 0,41 4%
Spain 191 11 0,01 0%
Portugal 0 0 0,00 0%
RoE 118 127 0,15 1%
USA 1.130 171 0,20 2%
Brazil 61 49 0,06 1%
Repowering & Terminal Value 1.990 2,28 19%
Total Enterprise Value 9.954 10.264 11,77 100%
Net Debt 2011 (incl. TEI) 4.631 5,31
Minorities & Provisions 183 0,21
Investments (Divestments)8 102 0,00
SoTP Equity Value / Target Price
(Base Case Scenario) - 85% Probability 5.143 6,01
SoTP Equity Value / Target Price
(Bear Case Scenario ) - 5% Probability 3.062 3,62
SoTP Equity Value / Target Price
(Bull Case Scenario) - 10% Probability 6.355 7,39
Weighted SoTP Equity Value / Target Price 5.160 6,03
Source: Nova Equity Reasearch
Each market was valued separately, in its own currency. For markets with currencies other than Euro, resulting values were converted to Euros at the one year forward rates (25-11-2011), so as to match the horizon of this recommendation. All Cash-Flows are on a nominal basis, and were adjusted for inflation9.
Portfolio
Operating capacity per market was valued considering the year in which the assets became operational and the regulatory framework in place at the time, as well as the framework than currently applies.
7 Includes capacity attributable to EDPR under the consortium Eólicas de Portugal 8 Includes investments in working capital, financial investments and other investments 9
IMF´s estimates
Chart 17: WACC & IRR
Source: Nova Equity Research 13%
9% 8%
15% 19%
52% 25% 10%
26%
8% 12% 7% 8% 9%
9% 9% 7%
11%
Spain Portugal France Belgium Poland Romania Italy US Brazil
WACC
EDPRENOVÁVEIS COMPANY REPORT
THIS
DOCUMENT
IS
NOT
AN
INVESTMENT
RECOMMENDATION
AND
SHALL
BE
USED
EXCLUSIVELY
FOR
ACADEMIC
PURPOSES
(SEE DISCLOSURES AND DISCLAIMERS AT END OF DOCUMENT)PAGE 14/35
Regarding Pipeline, we chose not to attribute value to Tier 3 and Prospects’ plans, since visibility at these stages is scarce and time to market is too long, resulting in the erosion of the potential value of projects. For those classified as Tier 1 and Tier 2, we considered the implementation schedule will take into consideration projects expected returns, with those presenting higher IRR/WACC ratios being executed first.
Although the company has been awarded 1,3 GW of wind offshore in the UK,
part of the project’s details is still uncertain, and construction and operation of the project will only start after 2015. Again, we consider visibility is scarce and time to market is too long and, as so, we do not attribute value to offshore capacity.
Terminal Value
Terminal value was assumed to be the biggest between salvage value (usually 20% of the initial capex) and repowering the asset at the end of its useful life. The latter assumes capex and opex evolve with inflation and incentive schemes converge to market prices.
CAPEX
Given that a significant part of EDPR’s suppliers operate globally, we understand supply contracts should be flexible enough to allow for delivery in any of the
company’s geographies. We thus assumed capex does not vary across markets. We also considered that 50% of a project’s capex takes place in the year it starts operating, while the remaining is retained in the previous year. Total value is depreciated over a period of 2510 years, equivalent to the average useful life of a wind farm.
OPEX
Opex consists of Operations & Maintenance (O&M) and Overhead Costs. Usually contracts specify that suppliers have to guarantee O&M for a certain period of time, as well as to maintain availability levels above defined thresholds. When this period ends, the company has to decide whether to extend the contract or to assure in–house maintenance.
Although the company’s increase in capacity should drive O&M costs up, we expect a decrease in overhead costs, leading to a dilution of the fixed costs on a MW basis.
10
In 2011, EDPR reviewed from 20 to 25 years the average useful life of its assets
Chart 18: CAPEX Forecasts
Source: Nova Equity Research
11E 12E 13E 14E 15E
EDPRENOVÁVEIS COMPANY REPORT
THIS
DOCUMENT
IS
NOT
AN
INVESTMENT
RECOMMENDATION
AND
SHALL
BE
USED
EXCLUSIVELY
FOR
ACADEMIC
PURPOSES
(SEE DISCLOSURES AND DISCLAIMERS AT END OF DOCUMENT)PAGE 15/35
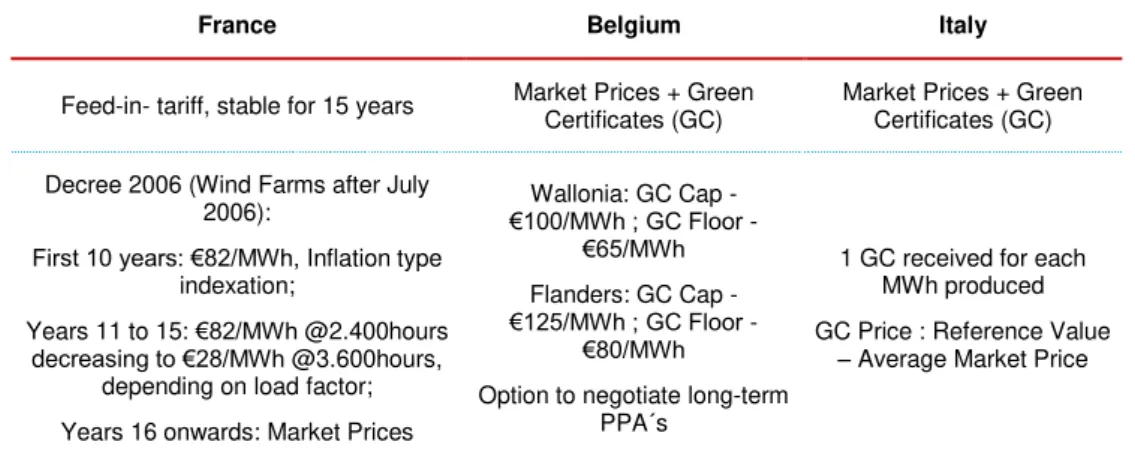
Remuneration
Prices received for the generated electricity vary according to country and regulatory frameworks, which we assumed as they are currently (see Markets and Regulation), and moving towards a market prices mechanism.
We expect Iberian market prices to follow the Iberian Energy Market Operator (OMIP) futures curves until 2013, and linked to inflation thereafter.
In Portugal, we assumed subsidized prices will converge to market prices at the end of the 15th year of operation. In Spain, older capacity will be kept in the RD 432/2004 framework until 2012, in which date the company will have to change it to the RD 661/2007 structure.
In France, as in Portugal, regulated prices will be replaced by market prices at the end of the 15th year of operation. We expect these to follow the French Baseload Futures11 curve until 2014 and linked to inflation thereafter.
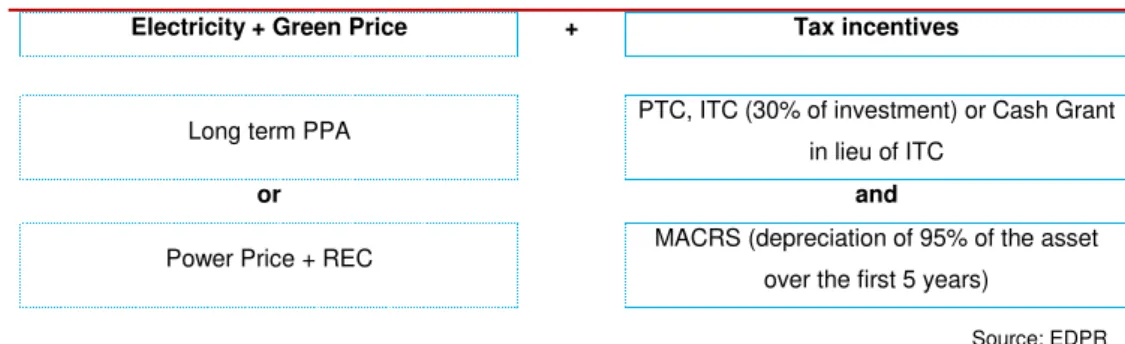
In the remaining European markets, the frameworks in place consist basically of market prices plus the sale of Green Certificates. We assumed the market component to evolve according to local electricity price futures curves12, if data is available, and linked to inflation thereafter. We expect Green Certificates to also evolve according to inflation.
In the US, we assumed the company will sell 80% of its production through
PPA’s, being the remaining 20% sold at market prices. These, in turn, were assumed to evolve according to NYMEX PJM futures curve until 2016, and linked to inflation thereafter.
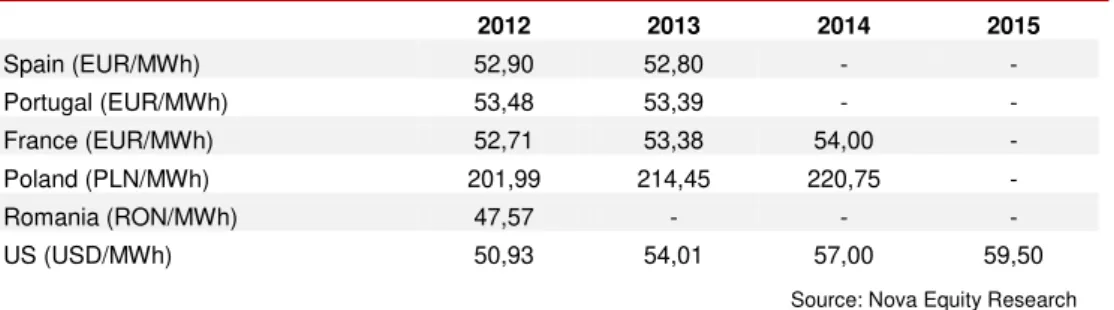
Table 4: Power Prices Forecasts: Futures Curves
2012 2013 2014 2015
Spain (EUR/MWh) 52,90 52,80 - -
Portugal (EUR/MWh) 53,48 53,39 - -
France (EUR/MWh) 52,71 53,38 54,00 -
Poland (PLN/MWh) 201,99 214,45 220,75 -
Romania (RON/MWh) 47,57 - - -
US (USD/MWh) 50,93 54,01 57,00 59,50
Source: Nova Equity Research
11 Negotiated in the European Energy Exchange (EEX)
12 Data for Italy: Italian Power Exchange (GME); Data for Poland: Polish Power Exchange (POLPX); Data for Romania: Romanian Power Exchange
EDPRENOVÁVEIS COMPANY REPORT
THIS
DOCUMENT
IS
NOT
AN
INVESTMENT
RECOMMENDATION
AND
SHALL
BE
USED
EXCLUSIVELY
FOR
ACADEMIC
PURPOSES
(SEE DISCLOSURES AND DISCLAIMERS AT END OF DOCUMENT)PAGE 16/35
Dividends
We assumed a payout ratio of 20%, in line with company’s guidelines, starting in 2012.
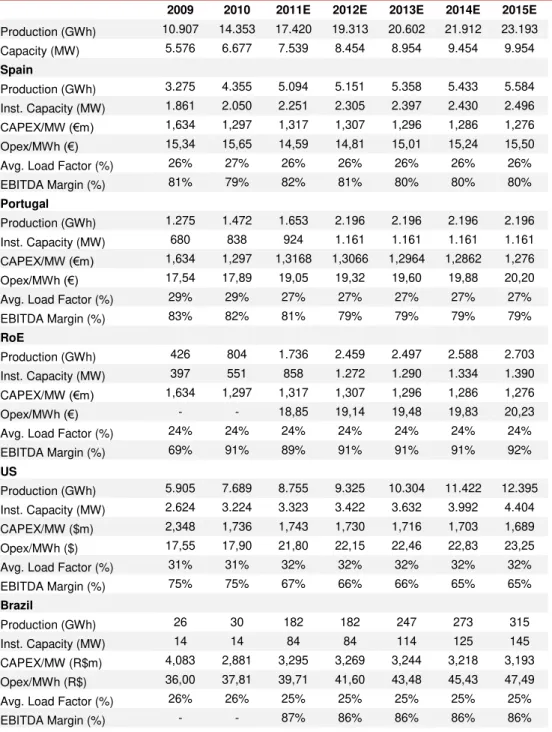
Table 5: Main assumptions
2009 2010 2011E 2012E 2013E 2014E 2015E
Production (GWh) 10.907 14.353 17.420 19.313 20.602 21.912 23.193
Capacity (MW) 5.576 6.677 7.539 8.454 8.954 9.454 9.954
Spain
Production (GWh) 3.275 4.355 5.094 5.151 5.358 5.433 5.584
Inst. Capacity (MW) 1.861 2.050 2.251 2.305 2.397 2.430 2.496
CAPEX/MW (€m) 1,634 1,297 1,317 1,307 1,296 1,286 1,276
Opex/MWh (€) 15,34 15,65 14,59 14,81 15,01 15,24 15,50
Avg. Load Factor (%) 26% 27% 26% 26% 26% 26% 26%
EBITDA Margin (%) 81% 79% 82% 81% 80% 80% 80%
Portugal
Production (GWh) 1.275 1.472 1.653 2.196 2.196 2.196 2.196
Inst. Capacity (MW) 680 838 924 1.161 1.161 1.161 1.161
CAPEX/MW (€m) 1,634 1,297 1,3168 1,3066 1,2964 1,2862 1,276
Opex/MWh (€) 17,54 17,89 19,05 19,32 19,60 19,88 20,20
Avg. Load Factor (%) 29% 29% 27% 27% 27% 27% 27%
EBITDA Margin (%) 83% 82% 81% 79% 79% 79% 79%
RoE
Production (GWh) 426 804 1.736 2.459 2.497 2.588 2.703
Inst. Capacity (MW) 397 551 858 1.272 1.290 1.334 1.390
CAPEX/MW (€m) 1,634 1,297 1,317 1,307 1,296 1,286 1,276
Opex/MWh (€) - - 18,85 19,14 19,48 19,83 20,23
Avg. Load Factor (%) 24% 24% 24% 24% 24% 24% 24%
EBITDA Margin (%) 69% 91% 89% 91% 91% 91% 92%
US
Production (GWh) 5.905 7.689 8.755 9.325 10.304 11.422 12.395
Inst. Capacity (MW) 2.624 3.224 3.323 3.422 3.632 3.992 4.404
CAPEX/MW ($m) 2,348 1,736 1,743 1,730 1,716 1,703 1,689
Opex/MWh ($) 17,55 17,90 21,80 22,15 22,46 22,83 23,25
Avg. Load Factor (%) 31% 31% 32% 32% 32% 32% 32%
EBITDA Margin (%) 75% 75% 67% 66% 66% 65% 65%
Brazil
Production (GWh) 26 30 182 182 247 273 315
Inst. Capacity (MW) 14 14 84 84 114 125 145
CAPEX/MW (R$m) 4,083 2,881 3,295 3,269 3,244 3,218 3,193
Opex/MWh (R$) 36,00 37,81 39,71 41,60 43,48 45,43 47,49
Avg. Load Factor (%) 26% 26% 25% 25% 25% 25% 25%
EBITDA Margin (%) - - 87% 86% 86% 86% 86%
EDPRENOVÁVEIS COMPANY REPORT
THIS
DOCUMENT
IS
NOT
AN
INVESTMENT
RECOMMENDATION
AND
SHALL
BE
USED
EXCLUSIVELY
FOR
ACADEMIC
PURPOSES
(SEE DISCLOSURES AND DISCLAIMERS AT END OF DOCUMENT)PAGE 17/35
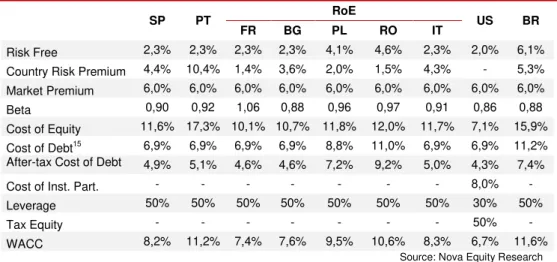
WACC
Cost of equity was calculated as the sum of the risk free rate plus both country and market risk premiums, multiplied by levered betas. Country risk13 premiums consist in the difference between local Sovereign yield and the lowest 10-year sovereign yield from the currency zone14. Market premium, usually assumed in the range of 4% to 6%, was assumed at 6%, as current financial instability will likely lead to the demand of higher premiums.
Table 6: WACC assumptions
SP PT RoE US BR
FR BG PL RO IT
Risk Free 2,3% 2,3% 2,3% 2,3% 4,1% 4,6% 2,3% 2,0% 6,1%
Country Risk Premium 4,4% 10,4% 1,4% 3,6% 2,0% 1,5% 4,3% - 5,3%
Market Premium 6,0% 6,0% 6,0% 6,0% 6,0% 6,0% 6,0% 6,0% 6,0%
Beta 0,90 0,92 1,06 0,88 0,96 0,97 0,91 0,86 0,88
Cost of Equity 11,6% 17,3% 10,1% 10,7% 11,8% 12,0% 11,7% 7,1% 15,9%
Cost of Debt15 6,9% 6,9% 6,9% 6,9% 8,8% 11,0% 6,9% 6,9% 11,2%
After-tax Cost of Debt 4,9% 5,1% 4,6% 4,6% 7,2% 9,2% 5,0% 4,3% 7,4%
Cost of Inst. Part. - - - 8,0% -
Leverage 50% 50% 50% 50% 50% 50% 50% 30% 50%
Tax Equity - - - 50% -
WACC 8,2% 11,2% 7,4% 7,6% 9,5% 10,6% 8,3% 6,7% 11,6%
Source: Nova Equity Research
Our estimates imply a premium over market consensus:
Table 7: Valuation Vs. Consensus
2011E 2012E 2013E 2014E 2015E
EBITDA
Nova Equity Research 876 1.025 1.077 1.132 1.186
Bloomberg Consensus 810 941 1.074 1.172 1.248
EBIT
Nova Equity Research 438 547 576 608 640
Bloomberg Consensus 396 486 589 665 720
EPS
Nova Equity Research 0,17 0,23 0,25 0,30 0,31
Bloomberg Consensus 0,16 0,21 0,27 0,31 0,36
Source: Nova Equity Research Estimates
Key Risks
Wind availability – Given its profile as a pure wind player, wind availability and
strength is crucial for the company’s output and profitability. Despite seasonality
13Damoradan, Aswath, “Measuring Company Exposure to Country Risk: Theory and Practice”, Stern School of Business, Sept. 2003 14 European Countries: yield on 10 year German Government Bund; Others: yield on 10 year Treasury Bond
15
Prob. of Default: 1% (Rate for European BBB companies, S&P 2011); Recovery Rate: 49,5% (08-10 average across all financial instruments, S&P 2011) Source: Bloomberg
4,0% 4,5% 5,0%
Nov-10 Mar-11 Jul-11 Nov-11 10Y EUR INDUSTRIAL BBB Yield
0 500 1000
Nov-10 Mar-11 Jul-11 Nov-11 EDP CDS EUR SR 10Y
500 585 670
EDPRENOVÁVEIS COMPANY REPORT
THIS
DOCUMENT
IS
NOT
AN
INVESTMENT
RECOMMENDATION
AND
SHALL
BE
USED
EXCLUSIVELY
FOR
ACADEMIC
PURPOSES
(SEE DISCLOSURES AND DISCLAIMERS AT END OF DOCUMENT)PAGE 18/35
and the possibility of punctual climate events, wind availability has been historically stable and is not expected to change in the future. Nevertheless, a 1% decrease in the average load factor would imply a 2,33% reduction in our valuation, to € 5,89 per share.
Regulation – With the development of the sector still highly dependent on supportive regulatory frameworks, uncertainty in this matter can jeopardize
EDPR’s future earnings and profitability. Current economic and financial crisis
poses a real threat to the company, as remuneration schemes for EDPR’s two biggest markets (Spain and US) will be reviewed in 2012. In the US, we expect the current scheme to be extended, once again, but in what concerns Spain, we remain cautious. We understand the country is facing increasing pressured to equilibrate its public accounts and, with this, there is the real possibility of reducing incentives to the renewables sector. Also, local laws and regulations may pose barriers and delay project´s building or execution phases, with relevant costs to the company.
Competition – As the industry develops, competition is expected to increase, both in terms of the number of players in the market and of the availability of alternative technologies and sources of energy. As the bidding process for available sites becomes tougher, it will be it harder to secure the best spots.
Financing – Current economic and financial crisis is putting strains on credit and, as so, financing is more difficult and expensive. Although EDPR is financed mainly through the parent company, spreads are increasing across the board, posing a serious threat to future growth. Also, as the crisis deepens, fewer companies are presenting high taxable income figures, which in turn will make harder for EDPR to secure Institutional Partnership deals. The company has reviewed downwards its growth targets to 2012. A 100 bps increase in the
company’s financing costs leads to a 7,91% reduction in our valuation, to € 5,60 per share.
Suppliers – Although the company contracts part of its turbines needs two to three years in advance, volatility in the prices of raw materials, as well as the demand-supply balance of the industry, may lead to changes in the prices of
turbines, which account for about 80% of a project´s CAPEX. A €100th
/MW increase in the price of a turbine has a negative impact of 3,86% in our valuation,
to € 5,80 per share.
Energy Prices – Even though the company has a relatively low direct exposure to market prices of energy, changes here have material impacts, both direct and
Source: Bloomberg 1,20
1,35 1,50
Nov-10 Mar-11 Jul-11 Nov-11 EURUSD
2,00 2,30 2,60
Nov-10 Mar-11 Jul-11 Nov-11 EURBRL
3,80 4,00 4,20 4,40
Nov-10 Mar-11 Jul-11 Nov-11 EURRON
3,70 4,15 4,60
EDPRENOVÁVEIS COMPANY REPORT
THIS
DOCUMENT
IS
NOT
AN
INVESTMENT
RECOMMENDATION
AND
SHALL
BE
USED
EXCLUSIVELY
FOR
ACADEMIC
PURPOSES
(SEE DISCLOSURES AND DISCLAIMERS AT END OF DOCUMENT)PAGE 19/35
indirect, on EDPR’s future prospects. Given than close to 40% of company’s
revenues is under PPA’s, a decrease in wholesale energy prices would pressure new PPA’s prices down, compromising future profitability in key markets (mainly US and Spain). A 5% decrease in average market prices would have a negative impact of 2,57% in our valuation, to € 5,78 per share.
Exchange Rates – With a relevant exposure to currencies other than Euro
(mainly USD), fluctuations in foreign exchange rates would affect company’s
profitability. Given the amplitude of the exposure to USD, we estimate that a 100bps depreciation of the dollar would have a negative impact of 0,61% in our valuation, to € 5,99 per share. Also, a generalised 100 bps depreciation of the other currencies (except USD) against the Euro would have a negative impact of 0,39%, to a price target of € 6,01.
Capital Structure – Despite having reviewed its growth strategy, EDPR average Net Debt / EBITDA in the triennium 2012-2015 is expected at 4.56x, above company guidance of 4.0x. Given current market conditions and the increased cost of financing, additional capital contribution may be needed to sustain future growth. Also, As EDP is the prime source of financing for the company, and given that it is more leveraged than its peers, we are concerned about the effect of a
possible weakening of its capital structure on EDPR’s future financing.
PPA’s Counterparty risk – As one of the companies with the highest number of PPA´s closed in the US, the company has limited exposure to market prices but have increased its exposure to counterparty risk. EDPR deals are usually settled for 20 years, with public state companies, and assure both prices (escalators of 11% to 12% for new contracts, so as to minimize differences to market prices) and quantities (full output coverage). We estimate current price differences to be less than 5%, which, in a scenario of counterparty default (which we do not anticipate), would have a limited impact on EDPR Cash Flows.
Markets and Regulation
Global energy landscape will change with the expected increase in world energy demand in the upcoming years, mainly fuelled by emerging economies. According to the International Energy Agency (IEA), global primary energy demand will increase 36% between 2008 and 2035, or 1,2% per year, on average. Having become the world’s largest energy user, China alone will account for 36% of the expected increase, followed by India’s contribution of 18%.
Chart 19: Utilities Debt/Equity Ratio
Source: Bloomberg 64%
71% 100%
114% 123% 124% 135%
145% 166%
191%
ENDESA SA E.ON AG IBERDROLA SA RWE AG Average ENEL SPA ACCIONA SA EDF EDP TERNA SPA
Chart 20: % of Green Energy in Gross Final Consumption
Source: European Commission 0%
5% 10% 15% 20% 25% 30% 35%
EDPRENOVÁVEIS COMPANY REPORT
THIS
DOCUMENT
IS
NOT
AN
INVESTMENT
RECOMMENDATION
AND
SHALL
BE
USED
EXCLUSIVELY
FOR
ACADEMIC
PURPOSES
(SEE DISCLOSURES AND DISCLAIMERS AT END OF DOCUMENT)PAGE 20/35
Electricity demand will continue to grow more than any other final form of energy, and investments in energy generation are expected to (further) shift to lower-carbon technologies. IEA forecasts renewables-based generation to increase from 2% in 2008 to around 33% in 2035 (comparable to coal), mainly from wind and hydropower.
Investment and development of green generating capacity still depends heavily on Governments incentives and on the existence of supportive regulatory frameworks. The rise in fossil fuel prices, improvements in green technologies and greater pressure for emissions reduction have led to the implementation of real policies to foster green development.
The latest joint initiative was the Durban summit, aimed at negotiating a new climate deal, with legal force, and which required both developed and developing countries to cut their carbon emissions. Although there was an agreement which,
for the first time ever, included the world’s biggest emitters of CO2 (China, India and the US), the results were modest. Even though the participating countries approved the extension of the Kyoto protocol beyond 2012 and, furthermore, agreed on the definition of a new global program or result with legal force until 2015, this should only be in effect from 2020 onwards and, according to the scientific community, by then it may be too late to avoid adverse climate effects. Historically, the European Union has taken the lead in the support to green sources of energy and sustainable development. The most recent and significant initiative is the approval of the RES Directive 2009/28/EC, published in 2009, and which defines mandatory green energy targets for all EU economies. According to the law, 20% of total EU energy consumption in 2020 should come from renewable sources. Moreover, there should be a reduction in greenhouse emissions of at least 20% of 1990 levels and, improvements in energy efficiency should account for another 20% reduction in primary energy consumption. Previous policies include the White Paper on Renewable Sources of Energy (double the percentage of green energy in total EU consumption between 1997 and 2010) and the Directive 2001/77/CE (reinforced the White Paper by defining individual targets for each country).
EDPRENOVÁVEIS COMPANY REPORT
THIS
DOCUMENT
IS
NOT
AN
INVESTMENT
RECOMMENDATION
AND
SHALL
BE
USED
EXCLUSIVELY
FOR
ACADEMIC
PURPOSES
(SEE DISCLOSURES AND DISCLAIMERS AT END OF DOCUMENT)PAGE 21/35
years), and the fact that it does not prevent the simultaneous use of land for other uses made it increasingly competitive.
Chart 21: Global Cumulative Wind Power Installed Capacity
Source: GWEC
Wind power capacity additions in 2010 totalled 38,3GW (Vs. 38,8GW in 2009), representing a 24% yoy increase in cumulative capacity. According to GWEC, Wind installed capacity will more than double until 2015 and in 2020 it should be more than 4 times the capacity in 2010 (moderate scenario).
China has become the world leader in terms of installed capacity (45GW), followed by the US (40GW) and Germany (27GW). Although ranking 5, India is expected to have one of the fastest growth rates in the upcoming years.
Chart 22: Top 10 markets by Wind Installed Capacity (YE 2010)
Source: GWEC
Iberia
SPAIN
Having a mature wind industry, Spain ranks fourth worldwide in terms of installed capacity, with over 20GW of operating capacity at the end of 2010. The country has one of the highest growth rates in installed capacity, with a CAGR of 32% in the period 1998-2010. Government commitment to the 2009/28/EC RES Directive pointed to a total of 38GW of wind capacity installed by 2020, but the figure was adjusted by the Renewables Energy Plan 2011-2020 to a value of 35,75GW.
296 415 573
460
832
1778
94 120 159 197
2007 2008 2009 2010 … 2015E 2020E 2030E
GW
GWEC Reference Scenario GWEC Moderate Scenario
44,73
27,21
13,07 40,18
20,68
5,80 5,66 5,20 4,01 3,90
GW
EDPR Current Geographies
Source: IMF, Nova Equity Research -135
-68 0
10 11E 12E 13E 14E 15E
B
illi
o
n
US
D
EDPRENOVÁVEIS COMPANY REPORT
THIS
DOCUMENT
IS
NOT
AN
INVESTMENT
RECOMMENDATION
AND
SHALL
BE
USED
EXCLUSIVELY
FOR
ACADEMIC
PURPOSES
(SEE DISCLOSURES AND DISCLAIMERS AT END OF DOCUMENT)PAGE 22/35
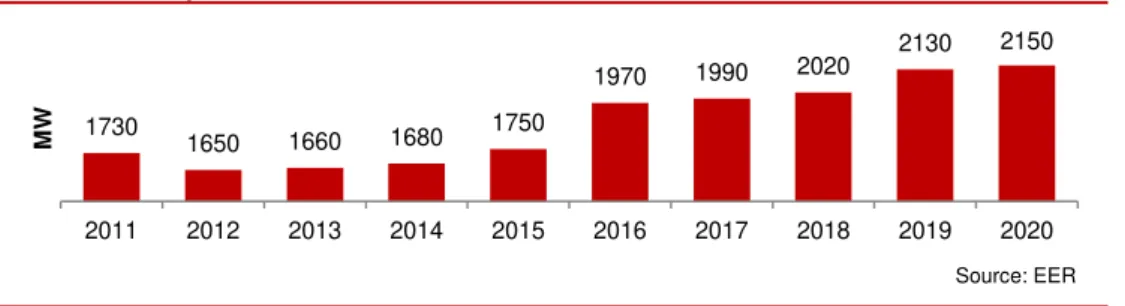
Wind is the third source of electrical generation, covering 16,6% of total demand, after gas and nuclear. The European Wind Energy Association (EWEA) expects this value to increase to 26.9% by 2020, with an estimated installed capacity of 41GW, above the government target of 35,75GW and the Spanish Wind Association (AAE) estimates of 39,4GW. Despite the prospects (see chart 23), we remain cautious about the short-term evolution of the Spanish market, as the
government faces a €22 billion deficit and the commitment assumed implies additional investments in the renewables sector of close to €60 billion in the period 2011-2020.
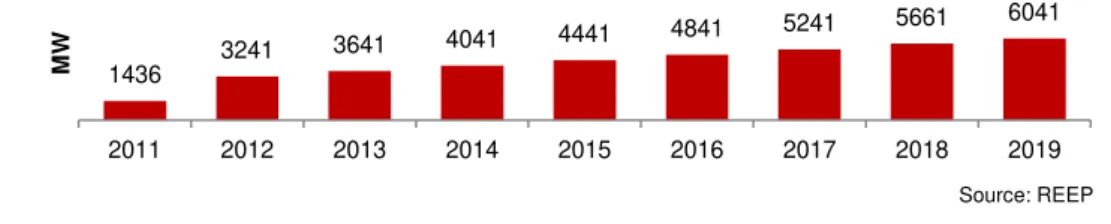
Chart 23: Country annual MW additions forecast 2011-2020
Source: EER
In 2010, EDPR was the third player in the country´s wind energy market, with 1,86 GW installed (9% market share), only behind Iberdrola Renovables with 5,17GW (25%) and Acciona Energia with 4,04GW (19,5%).
Regulatory support in Spain is based on a feed-in tariff scheme, which is divided in two different regimes, applicable according to the date in which the assets become operational. Operating capacity under the market option of Real Decreto 436/2004 has to be in new remuneration scheme by 2013.
Table 8: Remuneration System
RD 436/2004 RD 661/2007
Applicability:
Wind Farms before 2008. Those under market option have to change to RD 661/2007 until 2012.
Compulsory for all wind farms that started operation after 2008
Fixed Tariff: Fixed Tariff, no time limit Fixed Tariff (€79,1/MWh) for 20 years; annual update according to CPI-x16
Market Tariff: Pool + Premium (38,3€/MWh)
Pool + Premium (€20,1/MWh) with Cap (€91,7/MWh) and Floor (€76,9/MWh).
Except for market prices, all values are fixed and indexed to CPI-x3
% of EDPR Assets: 53% 47%
Source: EDPR
16
x equals 0,25% until 2012 and 0,5% thereafter
1730
1650 1660 1680 1750
1970 1990 2020
2130 2150
2011 2012 2013 2014 2015 2016 2017 2018 2019 2020
MW
Source: Bloomberg, Nova Equity Research 5.094 5.151
5.358 5.433 5.584
11E 12E 13E 14E 15E EDPR Production (GWh)
404 413
424 434
452
11E 12E 13E 14E 15E Revenues Forecasts (€m)
0,00 3,00 6,00
Nov-10 Mar-11 Jul-11 Nov-11
€ ce n t / K W h
ELECTRICITY SPOT PRICES SPAIN
Chart 24: Tariffs / Sector Total Costs 2010-2020 Source: IDAE 17,3% 15,3% 16,3% 17,2% 17,8% 17,5% 16,8% 15,7% 14,8% 14,0% 13,2% 12,0% 13,0% 14,0% 15,0% 16,0% 17,0% 18,0% 19,0%