The molecular structure of the phosphate mineral senegalite
Al
2
(PO
4
)(OH)
3
3H
2
O – A vibrational spectroscopic study
Ray L. Frost
a,⇑, Andrés López
a, Yunfei Xi
a, Natália Murta
b, Ricardo Scholz
caSchool of Chemistry, Physics and Mechanical Engineering, Science and Engineering Faculty, Queensland University of Technology, GPO Box 2434, Brisbane, Queensland 4001, Australia bMining Engineering Department, School of Mines, Federal University of Ouro Preto, Campus Morro do Cruzeiro, Ouro Preto, MG 35,400-00, Brazil
cGeology Department, School of Mines, Federal University of Ouro Preto, Campus Morro do Cruzeiro, Ouro Preto, MG 35,400-00, Brazil
h i g h l i g h t s
We have studied the mineral senagalite, a hydrated hydroxy phosphate of aluminium with formula Al2(PO4)(OH)33H2O.
A combination of electron microscopy and vibrational spectroscopy was used.
Senegalite crystal aggregates shows tabular to prismatic habitus and orthorhombic form.
A comparison is made with spectra of other aluminium containing phosphate minerals such as augelite and turquoise. Vibrational spectroscopy offers a means for the assessment of the structure of senagalite.
a r t i c l e
i n f o
Article history:
Received 10 April 2013 Accepted 27 May 2013 Available online 1 June 2013
Keywords:
Senegalite Phosphate Pegmatite Raman spectroscopy Infrared spectroscopy
a b s t r a c t
We have studied the mineral senagalite, a hydrated hydroxy phosphate of aluminium with formula Al2
(-PO4)(OH)33H2O using a combination of electron microscopy and vibrational spectroscopy. Senegalite
crystal aggregates shows tabular to prismatic habitus and orthorhombic form. The Raman spectrum is dominated by an intense band at 1029 cm 1assigned to the PO3
4 m1symmetric stretching mode. Intense
Raman bands are found at 1071 and 1154 cm 1with bands of lesser intensity at 1110, 1179 and
1206 cm 1and are attributed to the PO3
4 m3antisymmetric stretching vibrations. The infrared spectrum
shows complexity with a series overlapping bands. A comparison is made with spectra of other alumin-ium containing phosphate minerals such as augelite and turquoise. Multiple bands are observed for the phosphate bending modes giving support for the reduction of symmetry of the phosphate anion. Vibra-tional spectroscopy offers a means for the assessment of the structure of senagalite.
Ó2013 Elsevier B.V. All rights reserved.
1. Introduction
Senegalite is a hydrated hydroxy phosphate of aluminium of formula Al2(PO4)(OH)33H2O[1]. The mineral originated from Kou-roudiako iron deposit, Faleme river basin, Senegal. The mineral is orthorhombic [2,3] with point group mm2 with a 7.675(4), b 9.711(4), andc 7.635(4) Å,Z= 4. According to Keegan et al. [2]
the mineral possesses a new structure type based on chains. According to Keegan et al.[2] two symmetry-equivalent chains run parallel to [10 1] and [10 1], each based on distorted Al(OH)3 (-H2O)(Op)2(Op = phosphate oxygen) octahedral and Al(OH)3(Op)2 trigonal bipyramid edge-sharing dimers which further corner-link to complete the chain. Corner-linking (PO4) tetrahedra knit neigh-bouring chains to form an open sheet parallel to (0 1 0). The mineral shows yellowish-green prismatic crystals.
The phosphates of copper are many and varied but of the other divalent cations such as zinc, the phosphates are quite rare. In
contrast the phosphates of the trivalent cations such as Al3+and Fe3+are many and varied. There can be much isomorphic substitu-tion. The structure of augelite was first determined by Araki et al.
[4]. The building blocks in augelite are tetranuclear entities formed by symmetry correlated pairs of condensed octahedra AlO6and tri-gonal bipyramids AlO5which are linked by phosphate groups[4]. This paper does not mention hydrogen bonds but from the data gi-ven two independent O–H O distances can be estimated. More recent work gave two O–D O distances for synthetic augelite-d3 [5]. Huminicki and Hawthorne discuss the crystal chemistry of the phosphate minerals and list some 121 different phosphate minerals of these two elements[6]. Great variation in the structure of the phosphate minerals occurs[6]. The primary fundamental characteristic of a mineral is its crystal structure which defines the identities, amounts and arrangements of atoms that comprise the crystal. The secondary fundamental characteristic is the vibra-tional spectra of the mineral which depends on the primary funda-mental. Such spectra define the molecular as compared to the crystal structure of the mineral. Huminicki and Hawthorne pro-posed a structural hierarchy for phosphates [6]. This structural
0022-2860/$ - see front matterÓ2013 Elsevier B.V. All rights reserved. http://dx.doi.org/10.1016/j.molstruc.2013.05.061
⇑Corresponding author. Tel.: +61 7 3138 2407; fax: +61 7 3138 1804.
E-mail address:[email protected](R.L. Frost).
Contents lists available atSciVerse ScienceDirect
Journal of Molecular Structure
hierarchy is an arrangement of crystal structures that reflect sys-tematic changes in the character of the chemical bonds. Haw-thorne proposed that structures be classified according to the polymerisation of those cation coordination polyhedra with higher bond valencies. The mineral berlinite (AlPO4) is a framework struc-ture topologically identical to that of quartz with the space group P3121. The mineral augelite [Al2(PO4)(OH)3] contains Al in both the octahedral and trigonal-bipyramidal coordinations. The struc-ture in the b-direction linked by chains of phosphate and AlO5 groups. Augelite has space groupC2/m withZ= 4. In comparison wavellite [Al3(PO4)2(OH)3(H2O)4](H2O) is an open framework of corner sharing octahedra and tetrahedra with interstitial water groups held in the interstices by hydrogen bonds.
Interestingly Farmer in his book on the infrared spectra of min-erals divided the vibrational spectra of phosphates according to the presence, or absence of water and hydroxyl units in the minerals
[7]. In aqueous systems, Raman spectra of phosphate oxyanions show a symmetric stretching mode (
m
1) at 938 cm 1, theantisym-metric stretching mode (
m
3) at 1017 cm 1, the symmetric bendingmode (
m
2) at 420 cm 1and them
4mode at 567 cm 1[8–10].Farm-er reported the infrared spectra of bFarm-erlinite (AlPO4) with PO4 stretching modes at 1263, 1171, 1130 and 1114 cm 1; bending modes at 511, 480, 451, 379 and 605 cm 1. Al–O modes were found at 750, 705, 698 and 648 cm 1. On hydration of the mineral as with variscite (AlPO42H2O), PO4stretching modes were found at 1160, 1075, 1050 and 938 cm 1; bending modes at 515, 450 and 420 cm 1; in addition H
2O stretching bands were found at 3588, 3110, 2945 cm 1. For the mineral augelite (AlPO
4(OH)3), infrared bands were observed at 930 (
m
1), 438 (m
2), 1205, 1155,1079, 1015 (
m
3) and 615, 556 cm 1(m
4). For augelite, OH stretchingmodes were not observed.
Raman spectroscopy has proven most useful for the study of mineral structures[11–16]. The objective of this research is to re-port the Raman and infrared spectra of senegalite and to relate the spectra to the molecular structure of the minerals. The number of senegalite occurrences is limited[17]. This is the first report of a systematic study of senegalite from Brazil.
2. Experimental
2.1. Mineral
The senegalite sample studied in this work was collected from the Jangada mine, an iron ore deposit located in the Quadrilátero Ferrífero, municipality of Brumadinho, Minas Gerais, Brazil. In the Jangada mine a number of Al and Cu phosphates such as wav-ellite, turquoise, senegalite, as well as apatite, occur in the weath-ered zone[18].
In the Jangada mine, yellowish-green crystals of senegalite up to 0.5 mm occur in association with hematite and clay minerals. A complete mineralogical characterization of the Jangada mine was carried out by Nunes[19], including crystallographic study of senegalite. The collected sample was incorporated to the collec-tion of the Geology Department of the Federal University of Ouro Preto, Minas Gerais, Brazil, with sample code SAB-117. The sample was gently crushed and the associated minerals were removed un-der a stereomicroscope Leica MZ4. Scanning electron microscopy (SEM) was applied to support the chemical characterization and indicate the elements to be analyzed by EMP.
2.2. Scanning electron microscopy (SEM)
Experiments and analyses involving electron microscopy were performed in the Center of Microscopy of the Universidade Federal
de Minas Gerais, Belo Horizonte, Minas Gerais, Brazil (http:// www.microscopia.ufmg.br).
A senegalite crystal aggregate up to 0.5 mm was coated with a 5 nm layer of evaporated carbon. Secondary Electron and Backscat-tering Electron images were obtained using a JEOL JSM-6360LV equipment. Qualitative and semi-quantitative chemical analyses in the EDS mode were performed with a ThermoNORAN spectrom-eter model Quest and was applied to support the mineral characterization.
2.3. Raman spectroscopy
Crystals of senegalite were placed on a polished metal surface on the stage of an Olympus BHSM microscope, which is equipped with 10, 20, and 50objectives. The microscope is part of a Renishaw 1000 Raman microscope system, which also includes a monochromator, a filter system and a CCD detector (1024 pixels). The Raman spectra were excited by a Spectra-Physics model 127 He–Ne laser producing highly polarised light at 633 nm and col-lected at a nominal resolution of 2 cm 1 and a precision of ±1 cm 1in the range between 100 and 4000 cm 1. Repeated acqui-sition on the crystals using the highest magnification (50) was accumulated to improve the signal to noise ratio in the spectra. Spectra were calibrated using the 520.5 cm 1 line of a silicon wafer.
2.4. Infrared spectroscopy
Infrared spectra were obtained using a Nicolet Nexus 870 FTIR spectrometer with a smart endurance single bounce diamond ATR cell. Spectra over the 4000–525 cm 1 range were obtained by the co-addition of 128 scans with a resolution of 4 cm 1and a mirror velocity of 0.6329 cm/s. Spectra were co-added to improve the signal to noise ratio.
Band component analysis was undertaken using the Jandel ‘Peakfit’ (Erkrath, Germany) software package which enabled the type of fitting function to be selected and allowed specific param-eters to be fixed or varied accordingly. Band fitting was done using a Lorentz–Gauss cross-product function with the minimum num-ber of component bands used for the fitting process. The Lor-entz–Gauss ratio was maintained at values greater than 0.7 and fitting was undertaken until reproducible results were obtained with squared correlations (r2) greater than 0.995. Band fitting of
the spectra is quite reliable providing there is some band separa-tion or changes in the spectral profile.
3. Results and discussion
3.1. Chemical characterization
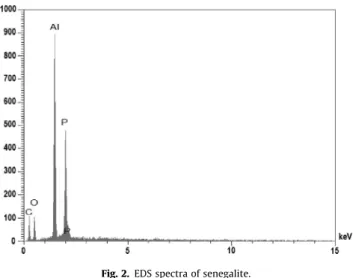
The SEM image of senegalite sample studied in this work is shown in Fig. 1. Senegalite crystal aggregates shows tabular to prismatic habitus and orthorhombic form. The mineral occurs in association with hematite and clay minerals not identified. Quali-tative chemical analysis shows. The presence of C in the EDS spec-tra is due to the influence of carbon tape and coating (seeFig. 2).
3.2. Vibrational spectroscopic background
Farmer [7] divided the vibrational spectra of phosphates according to the presence, or absence of water and/or hydroxyl units in the minerals. In aqueous systems, Raman spectra of phos-phate oxyanions show a symmetric stretching mode (
m
1) at938 cm 1, the antisymmetric stretching mode (
m
at 567 cm 1[8–10,20]. The value for the
m
1symmetric stretching vibration of PO4 units as determined by infrared spectroscopy was given as 930 cm 1(augelite), 940 cm 1(wavellite), 970 cm 1 (rockbridgeite), 995 cm 1 (dufrénite) and 965 cm 1 (beraunite). The position of the symmetric stretching vibration is mineral dependent and a function of the cation and crystal structure. The fact that the symmetric stretching mode is observed in the infrared spectrum affirms a reduction in symmetry of the PO4units.
The value for the
m
2symmetric bending vibration of PO4units asdetermined by infrared spectroscopy was given as 438 cm 1 (aug-elite), 452 cm 1 (wavellite), 440 and 415 cm 1 (rockbridgeite), 455, 435 and 415 cm 1(dufrénite) and 470 and 450 cm 1 (bera-unite). The observation of multiple bending modes provides an indication of symmetry reduction of the PO4units. This symmetry reduction is also observed through the
m
3antisymmetric stretchingvibrations. Augelite shows infrared bands at 1205, 1155, 1079 and 1015 cm 1[21,22]; wavellite at 1145, 1102, 1062 and 1025 cm 1; rockbridgeite at 1145, 1060 and 1030 cm 1; dufrénite at 1135, 1070 and 1032 cm 1; and beraunite at 1150, 1100, 1076 and 1035 cm 1.
3.3. Vibrational spectroscopy
The Raman spectrum of senegalite over the full wavenumber range is displayed inFig. 3a. This spectrum shows the position of
the bands and the relative intensity of these Raman bands. It is noted that there are large parts of the spectrum where little or no intensity is observed. Thus, the spectrum is subdivided into sec-tions based upon the type of vibration being studied. The infrared spectrum over the 500–4000 cm 1 spectral range is reported in
Fig. 3b. This figure shows the position and relative intensities of the infrared bands of senegalite. As for the Raman spectrum, the infrared spectrum is divided into sections based upon the type of vibration being examined.
The Raman spectrum of senegalite over the 800–1300 cm 1 spectral range is reported inFig. 4a. The Raman spectrum is dom-inated by an intense sharpish band at 1029 cm 1assigned to the PO3
4
m
1 symmetric stretching mode. Intense Raman bands are found at 1071 and 1154 cm 1 with bands of lesser intensity at 1110, 1179 and 1206 cm 1and are attributed to the PO34
m
3anti-symmetric stretching vibrations. Two other Raman bands are ob-served at 829 and 892 cm 1. The probable assignation of these bands is to hydroxyl deformation modes.
The infrared spectrum of senegalite over the 800–1300 cm 1 spectral range is reported inFig. 4b. This spectrum shows complex-ity with a series of overlapping bands. The intense infrared band at 1002 with a shoulder at 1027 cm 1is attributed to the
tPO3 4
m
1symmetric stretching mode. Infrared bands are observed at 1059, 1080, 1101, 1142, 1180, 1193 and 1212 cm 1. These bands are as-signed to the PO3
4
m
1symmetric stretching vibrations. Twoinfra-red bands are observed at 857 and 899 cm 1 and may be attributed to hydroxyl deformation modes.
A comparison may be made with spectra of other aluminium containing phosphate minerals such as augelite[23]and turquoise
[24]. In the Raman spectrum of augelite, an intense band is
Fig. 1.Backscattered electron image (BSI) of a senegalite fragment up to 0.5 mm in length.
Fig. 2.EDS spectra of senegalite.
observed at 1108 cm 1. The band is very sharp with a band width of 7.0. This band is assigned to the
m
1symmetric stretching mode.Breitinger et al. assigned a band at 1108 cm 1for synthetic augel-ites to this mode. The position is in sharp contrast to the value of 930 cm 1 published by Farmer[7]. In the infrared spectrum the band at 1070 cm 1is assigned to this mode. In the infrared spec-trum bands of augelite are observed at 1204, 1171, 1142, 1102, 1070 and 1016 cm 1. The position of these bands may be com-pared with those reported by Farmer. Bands were given as 1205, 1155, 1079 and 1015 cm 1. The three higher wavenumber bands (1204, 1171, 1142 cm 1) are attributed to the
m
3 antisymmetric PO4 stretching vibrations. An intense band is observed at 1160 with a resolved component band at 1136 cm 1 which may be attributed to these vibrational modes.
For the turquoise from Senegal, Raman bands are observed at 1182, 1161 and 1104 cm 1. Six bands are predicted from group theory, but are not observed and this is attributed to accidental degeneracy. The two sets of Raman bands from the two indepen-dent phosphate units overlap. In the infrared spectrum of tur-quoise, the three higher wavenumber bands at 1195, 1161 and 1109 cm 1 are ascribed to the
m
3 antisymmetric stretching vibrations.
The Raman spectra of senegalite in the 300–800 cm 1and in the 100–300 cm 1spectral ranges are displayed inFig. 5a and b. The first spectrum displays a series of overlapping Raman bands. This spectrum may be subdivided into sections. The first section is the 600–800 cm 1 spectral region, the second section is the bands around 500 cm 1and the third section is the bands between 300 and 400 cm 1. Raman bands at 545, 559, 581, 616 and 635 cm 1 are assigned to the
m
4PO34 bending modes. The Raman bands at417, 444, 462, 477 and 480 cm 1are due to the
m
2PO34 bending modes. The two bands at 677 and 708 cm 1 may be ascribed to water librational modes. Breitinger et al.[5]reported low intensity bands for synthetic augelite at 750 and 530 cm 1which were as-signed to the
m
(Al(O/OH)n) modes. The Raman spectrum displaysa number of bands at 303, 312, 318, 329, 364 and 375 cm 1. It is thought that these bands are due to Al–O stretching vibrations.
In the Raman spectrum of augelite, an intense band is observed at 635 cm 1with component bands at 643 and 615 cm 1and are assigned to the
m
4PO4mode. In the infrared spectrum of augelite,the band at 645 cm 1is assigned to this
m
4PO4bending mode. In the Raman spectrum bands are observed at 467, 439, 419 and 407 cm 1. These bands are attributed to the
m
2bending modes of the PO4 units. The Raman spectra of turquoise in the 500– 700 cm 1spectral range are complex with a significant number of overlapping bands. This spectral region is where the
m
4phos-phate bending modes are expected. For turquoise Raman bands are observed at 643, 593, 570 and 550 cm 1. The results of FGA show that at least two phosphate bending modes would be ex-pected. With loss of degeneracy this number would be expected to increase. For the turquoise from Senegal, Raman bands are ob-served at 484, 468, 439 and 419 cm 1. For the mineral chalcoside-rite two strong bands are observed at 445 and 397 cm 1. These bands are also assigned to the
m
2bending modes. Raman bandsof senegalite in the 100–300 cm 1spectral region are described as lattice vibrations. Intense Raman bands are observed at 136 and 237 cm 1.
Contrasting intensities between the Raman and infrared spectra are found in the 2600–3800 cm 1spectral region (Fig. 6). Intense very sharp Raman bands are observed at 3505 and 3610 cm 1with
Fig. 4.(a) Raman spectrum of senegalite over the 800–1400 cm1spectral range. (b) Infrared spectrum of senegalite over the 500–1300 cm1spectral range.
shoulders on the high wavenumber side at 3507 and 3614 cm 1. These bands are attributed to OH stretching vibrations. The series of low intensity Raman bands are observed at 3099, 3206, 3270, 3339, 3374 and 3429 cm 1and are assigned to water stretching vibrations. In the infrared spectrum, bands are observed at 3490 and 3609 cm 1with shoulder bands at 3502 and 3603 cm 1. These bands are ascribed to the stretching vibrations of the hydroxyl units. Intense infrared bands are found at 3061, 3089, 3211, 3261, 3332 and 3424 cm 1and are assigned to water stretching vibrations.
There are two crystallographic independent hydrogen bonds in augelite[4]and two of the expected three
m
(OH) bands aregener-ated by correlation splitting in the symmetry correlgener-ated pairs of the OH groups in general positions. In the infrared spectrum strong bands are observed at 3538, 3453 and 3326 cm 1. Breitinger et al. reported three infrared bands at 3511, 3449 and 3392 cm 1 for arseno-augelite[5]. Farmer did not report the OH stretching vibra-tions of augelite[7]. The two higher wavenumber bands of augelite are assigned to the OH stretching vibrations of the Al2OH units and the last band to the Al3OH units. Two intense bands are observed at 3547 and 3468 cm 1.
Two sets of bands for augelite are observed: firstly the bands at 3536, 3524, 3490 and 3479 cm 1and secondly the bands at 3391 and 3376 cm 1. There are two effects being observed. Firstly the separation of the
m
(OH) modes in the Al2OH and Al3OH groupsand secondly the satellite bands caused by the substitution of Al by Fe in these groups. FGA of turquoise predicts two independent water units and four OH units. The vibrational modes are both Ra-man and infrared active. Thus it is predicted that there should be a four OH symmetric stretching vibrations from the OH units and
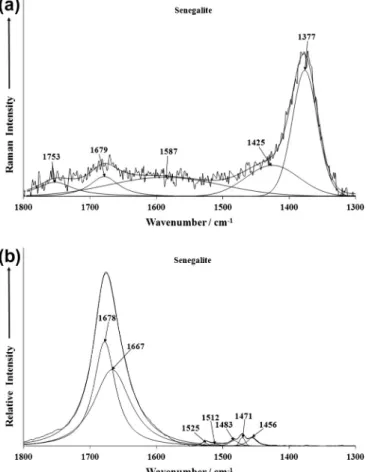
two from the water units. For the turquoise from Senegal, two in-tense bands are observed at 3289 and 3093 cm 1. The infrared spectrum of the Senegal turquoise shows greater complexity with infrared bands observed at 3280, 3266, 3076 3069 and 2925 cm 1. The Raman spectrum of senagalite in the 1300–1800 cm 1 spec-tral range is reported inFig. 7a. This spectrum suffers from a lack of signal; nevertheless, some Raman bands may be identified. The strongest band is found at 1377 cm 1. The infrared spectrum over this spectral range is illustrated inFig. 7b. Infrared bands at 1667 and 1678 cm 1are attributed to the water bending modes. The po-sition of these bands indicates strong hydrogen bonding between the water molecules and the phosphate units in the senagalite structure. Low intensity infrared bands are noted at 1456, 1471, 1483, 1512 and 1525 cm 1.
4. Conclusions
We have studied a sample of the phosphate mineral senegalite from the Jangada mine, an iron ore deposit located in the Quadrilá-tero Ferrífero, municipality of Brumadinho, Minas Gerais, Brazil. The chemical characterization via SEM/EDS shows a homogeneous phase, composed of Al and P. The SEM image of senegalite sample shows crystal aggregates with tabular to prismatic habitus and orthorhombic form.
Senagalite is one of many phosphate minerals containing alu-minium and/or ferric iron, including turquoise and augelite. The mineral can be successfully analyzed by Raman spectroscopy and a comparison of the Raman spectrum made with that of turquoise and augelite. The Raman spectrum is dominated by an intense
Fig. 6.(a) Raman spectrum of senegalite over the 2600–4000 cm 1spectral range. (b) Infrared spectrum of senegalite over the 2600–4000 cm1spectral range.
band at 1029 cm 1assigned to the PO3
4
m
1symmetric stretching mode. Raman bands at 545, 559, 581, 616 and 635 cm 1are as-signed to them
4PO34 bending modes. The Raman bands at 417,444, 462, 477 and 480 cm 1are due to the
m
2PO34 bending modes. The observation of multiple bending modes offers strong support for the reduction in symmetry of the phosphate anion in the sena-galite structure. Intense very sharp Raman bands are observed at 3505 and 3610 cm 1 and are attributed to OH stretching vibra-tions. Vibrational spectroscopy offers a unique means of studying the molecular structure of senagalite.
Acknowledgements
The financial and infra-structure support of the Discipline of Nanotechnology and Molecular Science, Science and Engineering Faculty of the Queensland University of Technology, is gratefully acknowledged. The Australian Research Council (ARC) is thanked for funding the instrumentation. The authors would like to acknowledge the Center of Microscopy at the Universidade Federal de Minas Gerais (http://www.microscopia.ufmg.br) for providing the equipment and technical support for experiments involving electron microscopy. R. Scholz thanks to CNPq – Conselho Nacional de Desenvolvimento Científico e Tecnológico (Grant No. 306287/ 2012-9).
References
[1]Z. Johan, Lithos 9 (1976) 165–171.
[2]T.D. Keegan, T. Araki, P.B. Moore, Am. Mineral. 64 (1979) 1243–1247. [3]D. McConnell, Mineral. Mag. 40 (1976) 609–610.
[4]T. Araki, J.J. Finney, T. Zoltai, Am. Mineral. 53 (1968) 1096–1103.
[5]D.K. Breitinger, J. Mohr, D. Colognesi, S.F. Parker, H. Schukow, R.G. Schwab, J. Mol. Struct. 563–564 (2001) 377–382.
[6]D.M.C. Huminicki, F.C. Hawthorne, Rev. Mineral. Geochem. 48 (2002) 123–325. [7] V.C. Farmer, Mineralogical Society Monograph 4: The Infrared Spectra of
Minerals, 1974.
[8]R.L. Frost, W. Martens, P.A. Williams, J.T. Kloprogge, Mineral. Mag. 66 (2002) 1063–1073.
[9]R.L. Frost, W.N. Martens, T. Kloprogge, P.A. Williams, Neues Jahrbuch fuer Mineralogie Monatshefte (2002) 481–496.
[10] R.L. Frost, P.A. Williams, W. Martens, J.T. Kloprogge, P. Leverett, J. Raman Spectrosc. 33 (2002) 260–263.
[11]J. Cejka, J. Sejkora, S. Bahfenne, S.J. Palmer, J. Plasil, R.L. Frost, J. Raman Spectrosc. 42 (2011) 214–218.
[12]R.L. Frost, S. Bahfenne, J. Raman Spectrosc. 42 (2011) 219–223.
[13]R.L. Frost, S. Bahfenne, J. Cejka, J. Sejkora, J. Plasil, S.J. Palmer, E.C. Keeffe, I. Nemec, J. Raman Spectrosc. 42 (2011) 56–61.
[14]R.L. Frost, S.J. Palmer, J. Mol. Struct. 988 (2011) 47–51.
[15]R.L. Frost, S.J. Palmer, H.J. Spratt, W.N. Martens, J. Mol. Struct. 988 (2011) 52– 58.
[16]S.J. Palmer, R.L. Frost, J. Raman Spectrosc. 42 (2011) 224–229.
[17] L.H. Coelho, L. Fonseca, K.M. Kaneko, J.C.A. Melo, A origem do fósforo e sua localização espacial nos minérios de ferro enriquecidos supergenicamente, in: II Simp. Bras. Minério de Ferro, ABM, Ouro Preto, 1999, pp. 44–52. [18] A.P.L. Nunes, M.V. Ribeiro, P.R.G. Brandão, G.E.S. Valadão., Caracterização de
Fosfatos Secundários Presentes em Minério de Ferro do Quadrilátero Ferrífero., in: 67 ABM Congress, Rio de Janeiro, 2012.
[19] A.P.L. Nunes, Estudos Eletrocinéticos de Flotabilidade da Wavellita, Turquesa, Senegalita e Apatita, in: Universidade Federal de Minas Gerais, 2012. [20] R.L. Frost, T. Kloprogge, P.A. Williams, W. Martens, T.E. Johnson, P. Leverett,
Spectrochim. Acta Part A Mol. Biomol. Spectrosc. 58A (2002) 2861–2868. [21]R.L. Frost, Spectrochim. Acta Part A Mol. Biomol. Spectrosc. 60A (2004) 1439–
1445.
[22]R.L. Frost, M.L. Weier, K.L. Erickson, O. Carmody, S.J. Mills, J. Raman Spectrosc. 35 (2004) 1047–1055.
[23]R.L. Frost, M.L. Weier, J. Mol. Struct. 697 (2004) 207–211.