Structural and thermal evolution studies of LaSbO
4
ceramics prepared
by solid-state reaction method
Kisla P.F. Siqueira, Raquel M. Borges, Júlia C. Soares, Anderson Dias
*Departamento de Química, Universidade Federal de Ouro Preto, Campus Morro do Cruzeiro, ICEB II, Sala 67, Ouro Preto 35400-000, MG, Brazil
h i g h l i g h t s
LaSbO4compounds were produced by solid-state method.
Structural characterization was conducted by XRD and Raman scattering.
Polarized Raman spectroscopy in sintered ceramics allowed us a complete modes assignment.
Luminescence properties revealed a promising phosphor.
a r t i c l e
i n f o
Article history:
Received 13 July 2012 Received in revised form 13 December 2012 Accepted 12 March 2013
Keywords:
A. Electronic materials
B. Raman spectroscopy and scattering D. Crystal structure
D. Luminescence
a b s t r a c t
This work investigates the thermal evolution of LaSbO4ceramics produced by solid-state method in the
temperature range 700e1500C, for 6 h. Besides the expected phase transitions, a thermal
decompo-sition at high temperatures to La3SbO7was observed and discussed. The results showed that the phase
LaSbO4can be obtained only below 1450C, while temperatures lower than 1100C are not able to
produce crystalline structures. The samples were submitted to X-ray diffraction and Raman scattering measurements aiming to determine their crystal structures. LaSbO4 materials exhibited monoclinic
structures, space group P21/m¼C2
2h(#11), withZ¼4. It was verified that all the 36 Raman-active modes
predicted by group-theory calculations were observed. Also, the symmetries could be discerned by using polarized Raman scattering, which allow us to assign thegerademodes. Luminescence properties of LaSbO4were investigated and the results showed that this compound exhibits sensitivity of the host
lattice to UV excitation. PL spectra excited at 360 nm have a blue emission band maximum at 428 nm, corresponding to the self-activated luminescence center of LaSbO4.
Ó2013 Elsevier B.V. All rights reserved.
1. Introduction
Compounds of the type ABO4(A¼rare-earth and B¼As, P, V, Nb, Ta, Sb) are very attractive materials because of their chemical and physical properties. The recent papers have been motivated by the fact that these compounds can be used as convenient host materials for fundamental spectroscopic investigations of rare-earth ions, as solid-state laser hosts, and for radioactive waste isolation[1,2], particularly for B¼As, P or V. Furthermore, for the compounds with B¼Nb and Ta, promising applications involving photoeelectronic activity [3e5], ion conductivity[6,7]and
lumi-nescence[8e11]have been reported. Recently, Siqueira et al.[12]
carried out a detailed investigation on the crystal structure of
lanthanide orthoniobates and showed that all samples exhibited monoclinic structure, space group C2/c (#15) andZ ¼4. For the lanthanide orthotantalates, Siqueira et al. [13] reported that different structures can be obtained as a function of the processing temperature and lanthanide ionic radii. For example, ceramic pro-cessing at 1300C resulted in three different crystal structures, as
follows: monoclinic structure, space group P21/c (#14), for RE¼La, Ce and Pr; fergusonite M-type, I2/a (#15), for RE ¼NdeTb; and fergusonite M0-type structure, P2/a (#13), for the compounds with
smallest ionic radii (RE¼DyeLu)[13].
For lanthanide orthoantimonates, little information is available from the literature. Gerlach et al.[14]reported the processing of ASbO4single crystals (A¼La, Pr, Nd, Sm, Eu, Gd, Tb, Dy, Lu) through endothermic chemical transport with TeCl4as transport agent but
there are still many divergences about the structure exhibited by these compounds. In view of that, this paper investigates the syn-thesis, crystal structure and characterization of the LaSbO4
com-pound, for which only an X-ray powder diffraction was reported
*Corresponding author. Tel.:þ55 31 35591716; fax:þ55 31 35591707.
E-mail addresses: [email protected], [email protected] (A. Dias).
Contents lists available atSciVerse ScienceDirect
Materials Chemistry and Physics
j o u r n a l h o m e p a g e : w w w . e l s e v i e r . c o m / l o c a t e / m a t c h e m p h y s
0254-0584/$esee front matterÓ2013 Elsevier B.V. All rights reserved.
[15]. Based on this information and on the similarity with the LaTaO4
compound, previously investigated by our research group[13], we carried out a detailed investigation on the thermal evolution and optimum synthesis conditions to lanthanum orthoantimonates. Also, polarized-Raman scattering and photoluminescence mea-surements were done aiming to understand the crystal structure, phonon modes and emission properties of the LaSbO4ceramics. To
the best of our knowledge, LaSbO4compounds obtained by
con-ventional solid-state reaction method were not previously reported by the literature. The goal of this work is to contribute to the un-derstanding of both structural and luminescence properties of this class of materials with promising technological applications.
2. Experimental
LaSbO4 ceramics were synthesized by using La2O3and Sb2O5
(>99.9% SigmaeAldrich) as starting materials through the
solid-state reactions. Stoichiometric amounts of the reactants were weighed and mixed with a mortar and pestle. The mixed powders were calcined in the temperature range 700e1500 C for fixed
times of 6 h, with intermediate regrinding. For sintering, cylindrical pucks of about 5 mm height and 12.5 mm diameter were produced by applying a pressure of 150 MPa. The samples were then sintered in a conventional oven at 1500C, for 8 h. The crystal structure of
the as-synthesized samples were studied by X-ray diffraction (XRD) using a Shimadzu D-6000 diffractometer with graphite mono-chromator and a nickelfilter in the range of 10e60 2q(15 s step 1of
0.02 2q), operating with FeKaradiation (l¼0.1936 nm), 40 kV and 20 mA (the results were automatically converted to CuKaradiation for data treatment and manipulation). The software MDI Jade 9.0 was employed to calculate the lattice parameters.
Raman spectra of the as-synthesized samples were collected in backscattering configuration using an Horiba/Jobin-Yvon LABRAM-HR spectrometer with the 632.8 nm line of a heliumeneon laser
(effective power of 6 mW at the sample’s surface) as excitation source, diffraction gratings of 600 and 1800 grooves mm 1, Peltier-cooled CCD detector, confocal Olympus microscope (100 objec-tive), and experimental resolution typically 1 cm 1 for 10 accu-mulations of 30 s. Polarized Raman spectra was carried out in the sample sintered at 1500C for 8 h. Appropriate interference
filter for rejecting laser plasma lines, and edge filter for stray light rejection were used. All resulting spectra were corrected by Bosee
Einstein thermal factor[16]. The emission and excitation spectra were acquired under continuous Xe arc lamp (450 W) excitation in a SPEX Triax 550 Fluorolog 3 spectrofluorometer at room temper-ature. The detection was performed with a Peltier-cooled SPEX Synapse CCD. The emission was collected at 90from the excitation
beam. Filters were placed in the excitation and emission beams, in order to improve the quality of the acquired spectra. For the emission spectra, the entrance and exit slits were adjusted, so as to obtain resolutions of 10e12 and 2 nm, respectively, for the
excita-tion spectra, the resoluexcita-tions were 2 and 10 nm. All the spectra were corrected, with the software apparatus, for the lamp intensity and photomultiplier sensitivity at the monitored wavelengths.
3. Results and discussion
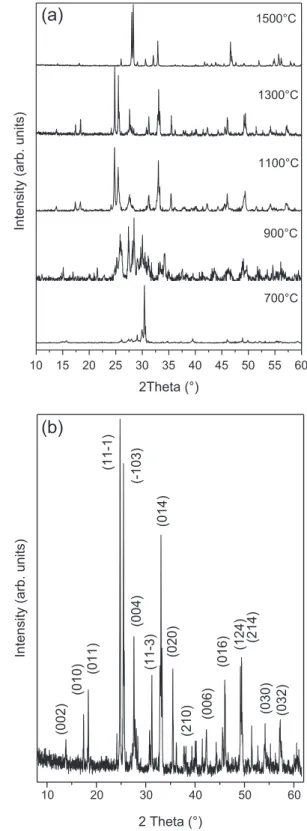
Fig. 1presents the XRD results related to the thermal evolution study of the LaSbO4samples prepared by the solid-state reaction
method. This study involved a temperature range of 700e1500C
with intervals of 200C in order to adjust the optimum synthesis
conditions and follow the behavior of the thermal treatment on the crystallization phase LaSbO4. As it can be seen, the chemical
reac-tion did not occurred at 700C and only the presence of the starting
precursors (La2O3and Sb2O5) can be observed. Although it is a low
temperature for solid-state reactions in many ceramic systems, we decided to start at 700 C because of the low melting-point of
antimony oxide (Sb2O5), which value is 380C[17]. Moreover, no
information about solid-state reactions for this compound was found in the literature. At 900C (Fig. 1a), we can observe the
beginning of the chemical reaction, but no formation of LaSbO4.
Only above 1100C it was possible to obtain the LaSbO
4in a single
10 15 20 25 30 35 40 45 50 55 60
2Theta (°)
900°C 1100°C
Intensity (arb. units)
1300°C
700°C
(a)
1500°C10 20 30 40 50 60
(b)
(032)
(030)
(214)
(124)
(016)
(006)
(210)
(020)
(014)
(11-3)
(004)
(-103)
(11-1)
(011)
(010)
(002)
Intensity (arb. units)
2 Theta (°)
Fig. 1.(a) Thermal evolution for the LaSbO4compound in the temperature range 700e
1500C studied by XRD; (b) XRD pattern for the LaSbO
4processed at 1300C with the
respective crystallographic planes indexed. Note that the LaSbO4phase was obtained at
1100 and 1300C, while the phase La
phase form, without contaminants or secondary phases. Ceramics processed at 1300C exhibit a higher degree of crystallinity than
the samples synthesized at 1100C, and could be indexed with
ICDD (International Committee for Diffraction Data) card number #36-0950. Fig. 1b shows the respective crystallographic planes indexed for this sample. The LaSbO4 compound exhibited a
monoclinic structure with space group P21/m¼C22h(#11), and four units per unit cell. The calculated lattice parameters are: a¼5.115A;b¼5.055A;c¼12.990A and
b
¼96.28. The crystalstructure of LaSbO4contains chains of [SbO6] octahedra connected
via common edges[18].
In spite that we have already achieved a crystalline phase, our study was beyond and additional experiments were conducted at higher temperatures in order to observe a possible phase transition, as detected by Gerlach et al.[14]in PrSbO4ceramics. In this case,
the authors observed that the samples crystallized in two different structures (
a
-PrSbO4andb
-PrSbO4) as a function of the processingtemperature. Based on these results, we carried out experimental synthesis also at 1500C. Unlike the expected phase transition at
1500C, the resulting sample exhibited a thermal decomposition
toward La3SbO7 (Fig. 1a), indexed by the ICDD card #23-1138,
which refers to an orthorhombic structure. Therefore, experimental tests at lower temperatures were carried out between 1300C and
1500 C aiming to investigate and determine the temperature
which the LaSbO4 ceramic decomposes to La3SbO7. The results
showed that the LaSbO4phase can be produced at temperatures
below 1450 C using a
fixed time of 6 h. It was observed that temperatures equal or higher than 1450C can lead to a
prefer-ential crystallization of La3SbO7, despite all stoichiometric
calcula-tions made for the production of LaSbO4.
According to the literature, there are many reports on the syn-thesis and crystal properties of La3SbO7materials[19,20], while for
the LaSbO4 ceramic there are practically no papers. Our results
suggest that at high temperatures (1450C and above) the loss of
Sb2O5 by volatilization could occur because to its low
melting-point, as already discussed, which causes the lack of this unit (Sb2O5) in the original structure and avoid the formation of the
stoichiometric phase LaSbO4. Similar behavior was noted by Ok
et al.[21]in their work about the new compounds LaSb5O12and
LaSb3O9. The authors noted that the phase LaSb3O9is stable only
below 1100C. When this sample is heated at higher temperatures,
it was observed the decomposition to LaSbO4according to the Eq.
(1) [21]. Following this reasoning, if we“subtract”one Sb2O5unit
from the stoichiometric LaSbO4, we can get La3SbO7, according to
the Eq.(2):
LaSb3O9 Sb2O5/LaSbO4 (1)
3LaSbO4 Sb2O5/La3SbO7 (2)
In this case, we believe that the processing at high temperatures can result in the shortage of antimony (V) oxide because of its low thermal stability. Thermal studies in compounds of the type NdBO4
(B¼P, As and Sb) showed that among all these compositions the NdSbO4presented the lowest thermal stability (Sb<As<P)[14].
Now, the results obtained from Raman scattering measurements in LaSbO4 samples synthesized in optimized conditions will be
presented. Group-theory calculations were made based on those previously reported for the LaTaO4compounds[13], since there is
no vibrational spectroscopic information concerning LaSbO4
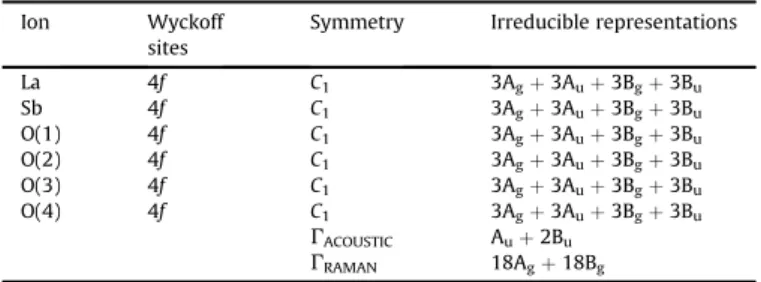
ma-terials in the literature. For this system, lanthanum, antimony and four oxygen atoms should occupy the 4fsites of symmetryC1. Due
to these occupation sites, the Raman-active modes of this system can be decomposed according to the irreducible representation (i.r.) of theC1point-group, as shown inTable 1. Then, using the
site-group method of Rousseau et al.[22]we can obtain the following distribution of the degrees of freedom at Brillouin-zone center in terms of the i.r. of theC2
2hpoint group:
G
TOTAL¼18Agþ18Bgþ18Auþ18Bu (3)Thus, we would expect 36geradeRaman modes (18Agþ18Bg)
for the LaSbO4 system. Raman spectra were obtained at room
temperature for LaSbO4samples synthesized at 1300C. Because of
the high number of active modes, a careful analysis was carried out byfitting the Raman experimental data with Lorentzian curves as it can be seen inFig. 2(green lines), which was divided up into three different wavenumber regions with numbered bands for better visualization. The experimental data are in closed squares, whereas thefitting curves are presented by red lines. The results showed that 36 Raman modes can befitted, in perfect agreement with the theoretical predictions.
Following, the results obtained from polarized Raman spec-troscopy will be presented. For this study, a ceramic was sintered at 1500 C for 8 h. These processing conditions were employed
because the goal was to obtain ceramics with large grains in order
Table 1
Factor-group analysis for the LaSbO4compound at room temperature.
Ion Wyckoff
sites
Symmetry Irreducible representations
La 4f C1 3Agþ3Auþ3Bgþ3Bu
Sb 4f C1 3Agþ3Auþ3Bgþ3Bu
O(1) 4f C1 3Agþ3Auþ3Bgþ3Bu
O(2) 4f C1 3Agþ3Auþ3Bgþ3Bu
O(3) 4f C1 3Agþ3Auþ3Bgþ3Bu
O(4) 4f C1 3Agþ3Auþ3Bgþ3Bu
GACOUSTIC Auþ2Bu
GRAMAN 18Agþ18Bg
60 80 100 120 140 160 180 200 11 10 9 8
7 6
5
4 3 2
1
Raman Intensity (arb. units)
Wavenumber (cm
-1)
240 280 320 360 400 440 480 27 26 25
24 23 22 21 20 19 18 17
16 15 14
13 12
500 550 600 650 700 750 800 36
35
34 33 32 31 30 29 28
Fig. 2.Micro-Raman spectra for the LaSbO4 sample in the spectral region 50e
800 cm 1. Experimental data are in closed squares, whereas thefitting curves are
represented by red lines. Green lines represent the phonon modes adjusted by Lor-entzian curves. The Raman-active modes were numbered for better visualization. (For
interpretation of the references to color in thisfigure legend, the reader is referred to
to get suitable polarized Raman measurement. For the sintering process, it was necessary to involve the compacted ceramics into the loose powders (LaSbO4) to avoid the antimony loss by
volatil-ization and consequently the decomposition to La3SbO7, already
discussed. However, the phase decomposition along the surface of the sintered ceramics was inevitable. Crystalline, single phase LaSbO4 materials were obtained only in the internal part of the
sintered pucks. It was not detected the existence of polymorphs, since the phase LaSbO4 formed at 1500 C was identical to the
previously produced by calcining at 1300C. Furthermore, the grain
growth allowed the analysis of the sample by polarized Raman spectroscopy.
It is well-known that the inelastic scattered light intensities due to the Raman effect are proportional to the square of the elements of the polarizability tensor (second-order tensor). Then, the base functions of the i.r. that contain the Raman-active modes have a quadratic form, i.e., they transform like the product of the Cartesian coordinates. For single crystals, we take benefit of the crystal symmetry to assign the lattice vibrations to the different i.r.[16,22]. However, in the case of the ceramics, although the group-theory predictions remain valid, the symmetry of the modes is generally mixed due to the random orientation of the crystalline grains. In this work, we have used a confocal microscope with an objective of magnification of 100, which allows the selection of an observation region as small as 2
m
m on the sample surface or even inside the sample. Nevertheless, we do not know anything about the crys-tallographic axes of these grains, which have also random orien-tation throughout the sample. By measuring the micro-Raman spectra of LaSbO4 sintered sample with cross-polarized light(Fig. 3), we observed that for some grains the spectra of parallel (red line) and crossed light (blue line) become different. We can observed the relative strengthening of the Agmodes in the parallel
configuration accompanied by the relative weakening of the Bg
modes, which are favored by crossed light configuration. Therefore, we could assign all the 36 Raman-activegerademodes as belonging to the Agand Bgsymmetries, as presented inTable 2.
We will now discuss the luminescence behavior of our LaSbO4
samples.Fig. 4shows the excitation spectrum (Fig. 4a) and emis-sion spectrum (Fig. 4b) obtained for the LaSbO4ceramics. The
op-tical transition of niobate and tantalate groups have been ascribed to a charge-transfer process[23,24]. For the antimonate groups, the
same situation can be considered. LaSbO4is an undoped phosphor
that under different exciting radiations shows UV-blue emission due to the charge transfer transition into SbO4 group. We can
consider that the conduction band is composed by Sb5þ
4dorbitals and the valence band by O2 2porbitals, similarly as found for LaNbO4 through electronic structure calculations [25].
Photo-luminescence (PL) profiles for LaSbO4 powders (Fig. 4) suggest a
mechanism by multilevel process, in which the relaxation of the system occurs by means of several paths, involving the participa-tion of several energy states within the band gap of the material [26]. We believe that the multilevel processes are occurring in our samples because the spectra presented in this work are very similar with those obtained for other tungstate samples[26]. Furthermore, the spectra were deconvoluted using Lorentzian curves and the PL profiles were better adjusted by four peaks, as it can be seen in Fig. 4. The maximum excitation peak is localized at 376 nm, but the other three peaks can be visualized at around 330, 357 and 398 nm. All these peaks are associated with the direct excitation of LaSbO4
host itself via charge transfer transition between Sb and O. On the other hand, the emission spectrum shows the peaks at around 403, 428, 456 and 489 nm, being the more intense peak the located at 428 nm. Hsiao et al.[25]also found more than one peak for both excitation and emission spectra in LaNbO4samples. In this case, the
authors attributed these results to presence of absorbing groups NbO4 and NbO6. The excitation and emission spectra of the
lanthanum antimonates are red shifted if compared to lanthanum niobates (LaNbO4: excitation at 260 nm and emission at 408 nm
[25]). This behavior is due to the higher 5th ionization potential (I5 ¼50.5 eV, for Nb, and 56.0 eV, for Sb). Blasse and Bril[23] 100 200 300 400 500 600 700 800
160 180 200 220 240 260 280 //
T
Bg Bg
Bg Bg Bg Ag
Raman Intensity
Wavenumber (cm
-1)
Fig. 3.Polarized Raman scattering for the sintered LaSbO4ceramics. Parallel (//) and
cross-polarized (T) configurations are indicated in red and blue lines, respectively.
Inset: the relative strengthening of the Ag modes in the parallel configuration
accompanied by the relative weakening of the Bgmodes, which are favored by crossed
light configuration. (For interpretation of the references to color in thisfigure legend,
the reader is referred to the web version of this article.)
Table 2
Phonon wavenumbers (cm 1) and assignment of thegerade
modes, determined from the adjustment of the Raman
experimental data by Lorentzian lines for the LaSbO4.
Band Assignment Wavenumber
1 Bg 60
2 Ag 68
3 Bg 76
4 Ag 91
5 Bg 109
6 Ag 122
7 Bg 144
8 Ag 150
9 Ag 180
10 Bg 198
11 Bg 201
12 Bg 220
13 Bg 235
14 Bg 241
15 Bg 259
16 Bg 262
17 Ag 296
18 Bg 309
19 Bg 325
20 Ag 433
21 Ag 479
22 Bg 451
23 Ag 405
24 Ag 378
25 Ag 364
26 Ag 357
27 Bg 350
28 Ag 512
29 Bg 532
30 Ag 542
31 Bg 564
32 Ag 617
33 Ag 641
34 Ag 663
35 Bg 687
showed that the lower 5th ionization potential of the metal resul-ted in a greater energy required for the charge transfer transitions of the BO4groups. As a consequence, the excitation and emission
spectra of the niobates are shifted to higher energies relative to the antimonates. Thus, our PL results are in totally agreement with theory prediction.
4. Conclusions
LaSbO4 ceramics were synthesized by solid-state reactions in
optimized temperatures, forfixed times of 6 h. The thermal evo-lution for this material showed that only in the temperature range of 1100e1450C the LaSbO4ceramics can be formed. For
temper-atures above 1450 C, the main phase decomposes to La
3SbO7,
probably due to volatilization of Sb2O5. XRD results showed that the
orthoceramic was obtained without impurities, crystallizing in the monoclinic structure with space group P21/m¼C2
2h(#11) andZ¼4. Raman spectroscopy was employed to determine all the 36 phonon-modes predicted by group-theory calculations, which can be discerned by using polarized scattering. The optical properties of LaSbO4 ceramics were investigated by photoluminescence
mea-surements. The PL spectrum excited at 360 nm showed a blue emission band maximum of 428 nm, corresponding to the self-activated luminescence center of LaSbO4.
Acknowledgments
The authors acknowledge the financial support from CNPq, FINEP and FAPEMIG. This work is a collaborative research project with members of the Rede Mineira de Química (RQ-MG), who are supported by FAPEMIG. Special thanks to Prof. Dr. Osvaldo Antonio Serra and Paulo C. de Sousa Filho for their hospitality during PL measurements.
References
[1] W.J. Weber, R.C. Ewing, C.R.A. Catlow, T.D. dela Rubia, L.W. Hobbs, C. Kinoshita, H. Matzke, A.T. Motta, M. Nastasi, E.K.H. Salje, E.R. Vance,
S.J. Zinkle, J. Mater. Res. 13 (1998) 1434e1484.
[2] A. Brenier, G. Jia, C. Tu, J. Phys. Condens. Matter 16 (2004) 9103e9108.
[3] K. Shimizu, S. Itoh, T. Hatamachi, T. Kodama, M. Sato, K. Toda, Chem. Mater. 17
(2005) 5161e5166.
[4] F.E. Osterloh, Chem. Mater. 20 (2008) 35e54.
[5] R. Abe, M. Higashi, Z.G. Zou, K. Sayama, Y. Abe, H. Arakawa, J. Phys. Chem. B
108 (2004) 811e814.
[6] R. Haugsrud, T. Norby, Nat. Mater. 5 (2006) 193e196.
[7] T. Mokkelbost, Ø. Andersen, R.A. Strom, K. Wiik, T. Grande, M. Einarsrud, J. Am.
Ceram. Soc. 90 (2007) 3395e3400.
[8] B. Li, Z. Gu, J. Lin, M.Z. Su, Mater. Res. Bull. 35 (2000) 1921e1931.
[9] T. Pang, W. Cao, Y. Fu, X. Luo, Mater. Lett. 62 (2008) 2500e2502.
[10] B. Liu, K. Han, X. Liu, M. Gu, S. Huang, C. Ni, Z. Qi, G. Zhang, Solid State
Commun. 144 (2007) 484e487.
[11] X. Xiao, B. Yan, J. Non-Cryst. Solids 351 (2005) 3634e3639.
[12] K.P.F. Siqueira, R.L. Moreira, A. Dias, Chem. Mater. 22 (2010) 2668e2674.
[13] K.P.F. Siqueira, G.B. Carvalho, A. Dias, Dalton Trans. 40 (2011) 9454e9460.
[14] S. Gerlach, R.C. Gil, E. Milke, M. Schmidt, Z. Anorg. Allg. Chem. 633 (2007) 83e92.
[15] M.B. Varfolomeev, T.A. Toporenskaya, B.A. Narnov, Russ. J. Inorg. Chem. (Engl.
Transl.) 26 (1981) 171e173.
[16] W. Hayes, R. Loudon, Scattering of Light by Crystals, Wiley, New York, 1978. [17] P. Patnaik, Handbook of Inorganic Chemicals, McGraw-Hill, 2002.
[18] C. Hirschle, J. Rosstaucher, C. Rohr, Acta Crystallogr. Sect. C C57 (2001) 1239e
1241.
[19] M. Wakeshima, Y. Hinatsu, J. Solid State Chem. 183 (2010) 2681e2688.
[20] Y. Hinatsu, H. Ebisawa, Y. Doi, J. Solid State Chem. 182 (2009) 1694e1699.
[21] K.M. Ok, A. Guittens, L. Zhang, P.S. Halasyamani, J. Mater. Chem. 14 (2004)
116e120.
[22] D.L. Rousseau, R.P. Bauman, S.P.S. Porto, J. Raman Spectrosc. 10 (1981) 253e290.
[23] G. Blasse, A. Bril, J. Lumin. 3 (1970) 109e131.
[24] E.C. Karsu, E.J. Popovici, A. Ege, M. Morar, E. Indrea, T. Karali, N. Can, J. Lumin.
131 (2011) 1052e1057.
[25] Y.J. Hsiao, T.H. Fang, Y.S. Chang, Y.H. Chang, C.H. Liu, L.W. Ji, W.Y. Jywe,
J. Lumin. 126 (2007) 866e870.
[26] J.C. Sczancoski, L.S. Cavalcante, M.R. Joya, J.W.M. Espinosa, P.S. Pizani,
J.A. Varela, E. Longo, J. Colloid Interface Sci. 330 (2009) 227e236.
210 240 270 300 330 360 390 420
(a)
Relative Intensity (arb. units)
Wavelength (nm)
420 450 480 510 540 570 600
(b)
Relative Intensity (arb. units)
Wavelength (nm)
Fig. 4.(a) Excitation (lem¼428 nm) and (b) emission (lex¼360 nm) spectra at room
temperature for the phosphor LaSbO4. Note that the spectra were deconvoluted using
Lorentzian curves and they were necessary to use four peaks (represented by different colors) to better adjusted the PL spectra. The experimental data are in closed squares
(black), whereas thefitting curves are represented by red lines. (For interpretation of
the references to color in thisfigure legend, the reader is referred to the web version of