Vibrational spectroscopy of the borate mineral gaudefroyite
Ca
4
Mn
3þ
3
x
ð
BO
3Þ
3
ð
CO
3Þð
O;
OH
Þ
from N’Chwaning II mine, Kalahari,
Republic of South Africa
Ray L. Frost
a,⇑, Ricardo Scholz
b, Andrés Lópes
a, Yunfei Xi
a, Zˇeljka Zˇigovecˇki Gobac
c,
Cristiano de Carvalho Lana
baSchool of Chemistry, Physics and Mechanical Engineering, Science and Engineering Faculty, Queensland University of Technology, GPO Box 2434, Brisbane, Queensland 4001,
Australia
b
Geology Department, School of Mines, Federal University of Ouro Preto, Campus Morro do Cruzeiro, Ouro Preto, MG 35400-00, Brazil
c
Institute of Mineralogy and Petrography, Department of Geology, Faculty of Science, University of Zagreb, Horvatovac 95, 10000 Zagreb, Croatia
h i g h l i g h t s
Gaudefroyite Ca4Mn33þxðBO3Þ3ðCO3Þ
ðO;OHÞ3is an unusual mineral containing both borate and carbonate. We have assessed the molecular
structure of gaudefroyite. Raman bands are assigned to the
stretching and bending modes of trigonal boron.
g r a p h i c a l
a b s t r a c t
a r t i c l e
i n f o
Article history:
Received 10 July 2013
Received in revised form 7 October 2013 Accepted 8 October 2013
Available online 18 October 2013
Keywords:
Raman spectroscopy Infrared spectroscopy Borate
Gaudefroyite N’Chwaning II mine
a b s t r a c t
Gaudefroyite Ca4Mn3þ
3xðBO3Þ3ðCO3ÞðO;OHÞ3is an unusual mineral containing both borate and carbonate groups and is found in the oxidation zones of manganese minerals, and it is black in color. Vibrational spectroscopy has been used to explore the molecular structure of gaudefroyite. Gaudefroyite crystals are short dipyramidal or prismatic with prominent pyramidal terminations, to 5 cm. Two very sharp Raman bands at 927 and 1076 cm1are assigned to trigonal borate and carbonate respectively. Broad Raman bands at 1194, 1219 and 1281 cm1are attributed to BOH in-plane bending modes. Raman bands at 649 and 670 cm1are assigned to the bending modes of trigonal and tetrahedral boron. Infrared spec-troscopy supports these band assignments. Raman bands in the OH stretching region are of a low inten-sity. The combination of Raman and infrared spectroscopy enables the assessment of the molecular structure of gaudefroyite to be made.
Ó2013 Elsevier B.V. All rights reserved.
Introduction
The number of minerals containing both borate and carbonate is
very few. Among these minerals are borcarite Ca4Mg(B4O6(OH)6
(CO3)2, britvinite (Pb7(OH)3F(BO3)2(CO3))(Mg4.5(OH)3(Si5O14)),
canavesite Mg2(HBO3)(CO3)5H2O, carboborite Ca2Mg(B(OH)4)2
(CO3)24H2O, gaudefroyite Ca4Mn33þxðBO3Þ3ðCO3ÞðO;OHÞ, harkerite
Ca12Mg4Al(BO3)3(SiO4)4(CO3)5H2O, merehedite Pb47Cl25(OH)13O24
(CO3)(BO3)2, movdite-Y Y(B(OH)4)(CO3), numanoite Ca4Cu(B4O6
(OH)6)(CO3)2, qilianshanite NaHCO3H3BO32H2O, and sakhaite
Ca12Mg4(BO3)7(CO3)4(OH)2Cl. Several minerals contain siloxane
1386-1425/$ - see front matterÓ2013 Elsevier B.V. All rights reserved.
http://dx.doi.org/10.1016/j.saa.2013.10.031
⇑ Corresponding author. Tel.: +61 7 3138 2407; fax: +61 7 3138 1804.
E-mail address:[email protected](R.L. Frost).
Contents lists available atScienceDirect
Spectrochimica Acta Part A: Molecular and
Biomolecular Spectroscopy
units and several contain the hydrogen borate units. In this research, we report a study of gaudefroyite. The reason is that the mineral is found in the oxidation zones of manganese mineral deposits and many of these minerals are of interest because of their one
dimen-sional ferromagnetism[1].
Gaudefroyite is a rare mineral and was first found in hydrother-mal manganese deposits at Tachgagalt, near Ouarzazate, Anti-Atlas Mountains, Morocco, where it occurs in a gangue of white,
non-manganiferous calcite, quartz, and locally brucite[2,3]. The second
known occurrence of gaudefroyite is from Wessels-type area of the Kalahari manganese field, South Africa, where it occurs in the cen-tral portion of the lower manganese unit, associated with marokite [4].
Gaudefroyite was firstly determined as a hexagonal mineral,
which crystallizes in a space groupP63orP63/m[2]. Its chemical
formula was determined as Ca4Mn33þx½ðBO3Þ3ðCO3ÞðO1xðOHÞxÞ3,
wherex0.17, and Z= 2, with a suggestion that in completely
fresh gaudefroyitexmay be 0, with no (OH) present, leading to
the ideal chemical formula Ca4Mn33þ½ðBO3Þ3ðCO3ÞO3 [2]. There
was also a suggestion that in an oxidizing environment Mn3+
oxi-dizes to Mn4+ and pyrolusite (MnO
2) forms, and the resulting
vacancies in the gaudefroyite structure are then compensated by
substitution of (OH)by O2[2].
The main structural units of the gaudefroyite structure are edge-sharing puckered chains formed by Jahn-Teller uniaxially
elongated Mn3+O
6 octahedra. Octahedral chains run parallel to
thec-axis and are crosslinked by triangular BO3groups, forming
two different types of channels[5]. In the centre of the larger,
hex-agonally shaped channels are the CO3triangles surrounded by Ca
atoms. The smaller, trigonal-shaped channels are occupied only
with Ca atoms[5]. Although the space group of gaudefroyite was
firstly solved asP63[6], and then refined in the same space group
[7,8], later the structure of gaudefroyite was refined in both space
groups P63/m and P63 (a= 10.589(1) Å, and c= 5.891(1) Å), and
presented the structure in space group P63/mas their preferred
structural model[5]. They noted that the structural framework of
gaudefroyite and most of the channel-filling cations possesP63/m
symmetry, which is only violated by the arrangement of the CO3
groups, i.e. this framework arrangement and distribution of the
Ca2+ cations in the structural channels, obeys the higher
space-group symmetry P63/m, but, in contrast, CO3 groups situated in
the centre of the wide structural channel locally violate the
mir-ror-plane perpendicular toc[5,6]. Thus, in the average structure,
carbonate groups exhibit positional disorder governed by the
cen-tro-symmetry of the framework[5].
Results of TG–DTA investigations [9] indicate that the CO3
groups in gaudefroyite are partially ordered and possibly give rise
to a superstructure, and this partial order of the CO3groups is
con-firmed by transmission electron microscopy[10]. The CO3groups
in the large 63channels are ordered in two different ways and this
ordering gives rise to two different types of 63channels, A and B.
The A and B types of channels occur in a 1:1 ratio, they are partially ordered and give rise to the continuous streaked reflections in sev-eral directions in SAED patterns of gaudefroyite, which indicate that the true symmetry of gaudefroyite is lower than hexagonal [10]. Rietveld refinements of the gaudefroyite structure at various
temperatures prove that the structure is stabile up to 486°C[11].
The number of vibrational spectroscopic studies of borate
min-erals is very limited[12–15]. The number of Raman studies is also
very limited[16,17]. There have been a number of infrared studies
of some natural borates[18–21]. Most of these references are not
new and there have been no recent studies on the vibrational spec-troscopy of natural borates. Ross in Farmer’s treatise reported the infrared spectra of a considerable number of borate minerals [22]. Vibrational spectroscopy has been applied to borate glasses [23–26]. There have been a number of studies of borate glasses
doped with a wide range of radioactive atoms [27,28]. Borate
glasses may be used as a means of containment of radioactive materials. There have been a number of studies looking at the
ef-fect of radiation on borate glasses[29,30].
Yet, there remains the issue of the vibrational spectroscopic study of natural borate minerals. There are very few studies on the Raman spectra of natural borate minerals. In this paper, we have studied the Raman and infrared spectroscopy of the mineral gaudefroyite and relate the spectra to the structure of the mineral.
Experimental
Occurrence, sample description and preparation
The gaudefroyite sample studied in this work was obtained from the collection of the Geology Department of the Federal Uni-versity of Ouro Preto, Minas Gerais, Brazil, with sample code SAC-026. The sample is from the type locality in N’ Chwaning II mine of the Kalahari manganese fields, South Africa. The sample was gently crushed and the associated minerals were removed under a stereo-microscope Leica MZ4. Scanning electron microscopy (SEM) was applied to support the chemical characterization.
Gaudefroyite from N’chwaning mine in the Kalahari manganese
field occurs in two types of mineral associations [31]. It occurs
either as vein fillings with baryte, calcite, manganite, hausmannite and ‘‘hydrogrossularite’’, or as massive ore, where it is associated with manganite, bixbyite, braunite, hausmannite and hematite [31]. Thermal stability of gaudefroyite[2], its associated minerals and its intimate textural relationship, indeed indicate that gaudef-royite is of high temperature, low pressure hydrothermal origin being emplaced together with baryte during boron metasomatism [31]. Gaudefroyite is assumed to be a late secondary mineral, as it
occurs as vein filling and as matrix mineral[31]. Further, geological
history of Kalahari manganese field encompasses Syn- and
Post-Kalahari supergene alteration and surficial weathering[32].
Scanning electron microscopy (SEM)
Experiments and analyses involving electron microscopy were performed in the Center of Microscopy of the Universidade Federal de Minas Gerais, Belo Horizonte, Minas Gerais, Brazil (http:// www.microscopia.ufmg.br).
Gaudefroyite single crystal was coated with a 5 nm layer of evaporated carbon. Secondary Electron and Backscattering Elec-tron images were obtained using a JEOL JSM-6360LV equipment. Qualitative and semi-quantitative chemical analyses in the EDS mode were performed with a ThermoNORAN spectrometer model Quest and were applied to support the mineral characterization.
Raman spectroscopy
Crystals of gaudefroyite were placed on a polished metal sur-face on the stage of an Olympus BHSM microscope, which is
equipped with 10, 20, and 50 objectives. The microscope is
part of a Renishaw 1000 Raman microscope system, which also in-cludes a monochromator, a filter system and a CCD detector (1024 pixels). The Raman spectra were excited by a Spectra-Physics mod-el 127 He–Ne laser producing highly polarised light at 633 nm and
collected at a nominal resolution of 2 cm1 and a precision of
±1 cm1in the range between 200 and 4000 cm1. Repeated
acqui-sitions on the crystals using the highest magnification (50) were
accumulated to improve the signal to noise ratio of the spectra. Be-cause of the lack of signal, over 1200 scans were made. The spectra were collected over night. Raman Spectra were calibrated using the
520.5 cm1line of a silicon wafer. The Raman spectrum of at least
10 crystals was collected to ensure the consistency of the spectra.
Infrared spectroscopy
Infrared spectra were obtained using a Nicolet Nexus 870 FTIR spectrometer with a smart endurance single bounce diamond
ATR cell. Spectra over the 4000–525 cm1 range were obtained
by the co-addition of 128 scans with a resolution of 4 cm1and a
mirror velocity of 0.6329 cm/s. Spectra were co-added to improve
the signal to noise ratio. The infrared spectra are given in the
Sup-plementary information.
Spectral manipulation such as baseline correction/adjustment and smoothing were performed using the Spectracalc software package GRAMS (Galactic Industries Corporation, NH, USA). Band component analysis was undertaken using the Jandel ‘Peakfit’ soft-ware package that enabled the type of fitting function to be se-lected and allows specific parameters to be fixed or varied accordingly. Band fitting was done using a Lorentzian–Gaussian cross-product function with the minimum number of component bands used for the fitting process. The Gaussian–Lorentzian ratio was maintained at values greater than 0.7 and fitting was under-taken until reproducible results were obtained with squared
corre-lations ofr2greater than 0.995.
Results and discussion
The gaudefroyite sample studied in this work was analyzed by SEM/EDS. The SEM image and chemical analysis are given in the
Supplementary information. Fig. S1 shows a single crystal with prismatic habitus. No contaminat phases are observed. Qualitative and semiquantitative chemical analysis shows a mineral composed by Ca, Mn and C predominantly, with minor amount of Al (Fig. S2). Due to the low energy, B was not observed.
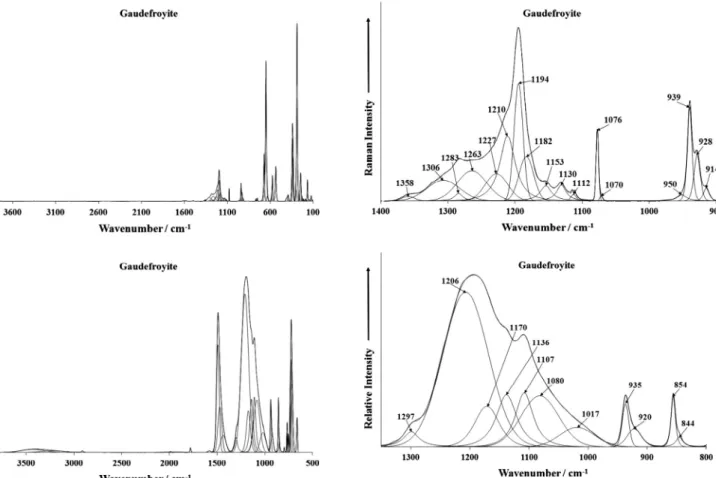
The Raman spectrum of gaudefroyite over the 100–4000 cm1
range is illustrated inFig. 1a. This spectrum displays the position
and relative intensity of Raman bands over the full spectral range. It is noted the intensity in the OH stretching region is very low. The
infrared spectrum of gaudefroyite over the 500–4000 cm1range is
displayed inFig. 1b. In order to define the details of the Raman and
infrared bands, the spectra are divided into sections based upon the convenience and the type of bands being studied. The Raman
spectrum of gaudefroyite over the 800–1500 cm1 region is
re-ported in Fig. 2a and the infrared spectrum in the 500–
1300 cm1is reported inFig. 2b.
The Raman spectrum (Fig. 2a) shows two features namely (a)
two very sharp Raman bands at 927 and 1076 cm1and (b) broad
overlapping bands at 1194, 1219, 1281 and 1324 cm1. Other low
intensity Raman bands are found at 1130 and 1152 cm1. The
Ra-man band at 927 cm1 is assigned to the symmetric stretching
mode of trigonal boron. Ross reported the band positions of
trigo-nal and tetrahedral boron [22]. The very sharp Raman band at
1076 cm1is typical of the symmetric stretching mode of
carbon-ate. The broad Raman bands at 1194, 1219 and 1281 cm1may be
attributed to BOH in-plane bending modes. The width of these Ra-man bands supports the concept of disorder in the structure of gaudefroyite.
The infrared spectrum of gaudefroyite (Fig. 2b) also shows con-siderable width in the infrared bands. The infrared band at
Fig. 1.(a) Raman spectrum of gaudefroyite (upper spectrum) over the 100– 4000 cm1spectral range and Fig. 1b infrared spectrum of gaudefroyite (lower
spectrum) over the 500–4000 cm1spectral range.
Fig. 2.(a) Raman spectrum of gaudefroyite (upper spectrum) in the the 900– 1400 cm1spectral range and Fig. 2b Infrared spectrum of gaudefroyite (lower
1076 cm1 is the infrared equivalent of the Raman band in the
same position attributed to carbonate symmetric stretching mode. The observation of the band provides evidence for distortion of the carbonate anion. In a perfect system, the symmetric stretching mode should be Raman active and infrared inactive. The infrared
bands at 1108, 1186, 1220, 1251 and 1292 cm1may be assigned
to the BOH in-plane bending modes. The low intensity infrared
bands at 916, 930 and 937 cm1are assigned to the trigonal borate
symmetric stretching modes. The bands are of low intensity in the infrared spectrum as expected.
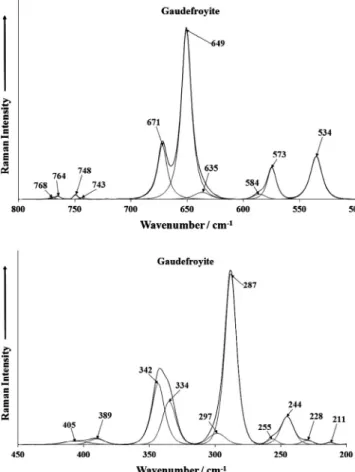
The Raman spectra in the 500–800 cm1region and in the 200–
450 cm1region are shown inFig. 3. Again sharp Raman bands are
observed in the spectrum shown inFig. 3a. The Raman bands at
649 and 670 cm1are assigned to the bending modes of trigonal
and tetrahedral boron. These bands are also observed in the
infra-red spectrum at 600 and 620 cm1(Fig. 2b). It could be expected
that some Raman bands in the 700–750 cm1 region would be
found which could be attributed to the CO2
3
m
2in-plane bendingmode. However no Raman intensity was observed in this spectral region. However, in the infrared spectrum, a series of bands at
709, 723, 734, 750 and 764 cm1 are observed and are assigned
to this vibrational mode (Fig. 2b). Two strong Raman bands are
ob-served at 531 and 572 cm1 three broad but reasonably intense
bands are observed at 287, 336 and 394 cm1. These bands are
attributed to MnO stretching vibrations. Other low intensity bands
are found in the 100–260 cm1region and are attributed to lattice
vibrations.
The infrared spectrum in the 2600–3800 cm1region is shown
inFig. 4. The Raman spectrum suffers from a lack of signal. Raman
bands may be suggested at 2830, 3123 and 3255 cm1. However
any interpretation is fraught with difficulty. It could be expected to observe some Raman bands from BOH stretching vibrations. The infrared spectrum displays bands at 2723, 2903, 3185, 3310
and 3502 cm1. The latter three bands are assigned to the BOH
stretching vibrations. The Raman spectrum in the 1400 and
1800 cm1 region is displayed in Fig. 5a. The infrared spectrum
in the 1300–1800 cm1region is shown inFig. 5b. Strong infrared
bands are observed at 1439, 1471 and 1493 cm1. These bands are
assigned to the carbonate antisymmetric stretching vibrations. Other low intensity infrared bands at 1560, 1579, 1757 and
1775 cm1may be attributed to overtone or combination bands.
Fig. 3.(a) Raman spectrum of gaudefroyite (upper spectrum) in the 500–800 cm1
spectral range and Fig. 3b Raman spectrum of gaudefroyite (lower spectrum) in the 200–450 cm1spectral range.
Fig. 4.Infrared spectrum of gaudefroyite (lower spectrum) in the 2600–3800 cm1
spectral range.
Fig. 5.(a) Raman spectrum of gaudefroyite (upper spectrum) in the 1450– 1650 cm1spectral range and Fig. 5b infrared spectrum of gaudefroyite (lower
spectrum) in the 1400–1800 cm1spectral range.
The Raman bands at 1441 and 1495 cm1are the Raman
equiva-lent of these carbonate antisymmetric stretching vibrations. Other
Raman bands are found at 1596 and 1675 cm1.
Conclusions
There are many borate minerals which have yet to have their vibrational spectrum determined and the molecular structure as-sessed in terms of their vibrational spectrum. In this work we have measured the Raman and infrared spectrum of gaudefroyite
Ca4Mn33þxðBO3Þ3ðCO3ÞðO;OHÞ over the complete spectral range.
Gaudefroyite crystals[2]are short dipyramidal or prismatic with
prominent pyramidal terminations. Crystal structures
character-ized by chains of edge-sharing Mn3+O
6octahedra.
The Raman spectrum is dominated by intense sharp bands at
927 cm1, 649 and 670 cm1, assigned to the symmetric stretching
mode and the bending mode of trigonal and tetrahedral boron.
Broad Raman bands at 1194, 1219 and 1281 cm1are attributed
to BOH in-plane bending modes. Multiple Raman bands in the
OH stretching region are observed at 3206, 3249 and 3385 cm1.
Vibrational spectroscopy has enabled aspects about the molecular structure of the borate mineral ameghinite to be assessed.
Acknowledgments
The financial and infra-structure support of the Queensland University of Technology, Chemistry discipline is gratefully acknowledged. The Australian Research Council (ARC) is thanked for funding the instrumentation. The authors would like to acknowledge the Center of Microscopy at the Universidade Federal de Minas Gerais (http://www.microscopia.ufmg.br) for providing the equipment and technical support for experiments involving electron microscopy. R. Scholz thanks to CNPq – Conselho Nacional de Desenvolvimento Científico e Tecnológico (grant No. 306287/ 2012-9). Zˇ. Zˇigovecˇki Gobac thanks to Ministry of Science, Educa-tion and Sports of the Republic of Croatia, under Grant No. 119-0000000-1158.
Appendix A. Supplementary material
Supplementary data associated with this article can be found, in
the online version, athttp://dx.doi.org/10.1016/j.saa.2013.10.031.
References
[1]R.K. Li, C. Greaves, Phys. Rev. B70 (2004). 132411/1. [2]G. Jouravsky, F. Permingeat, Bull. Soc. France 87 (1964) 216. [3]M. Fleischer, Amer. Min. 50 (1965) 806.
[4]S.E. Kleyenstüber, A regional mineral study of the manganese-bearing Voëlwater Subgroup in the Northern Cape Province, Rand Afrikaans University, Johannesburg, 1985.
[5]C. Hoffmann, T. Armbruster, M. Kunz, Eur. J. Min. 9 (1997) 7. [6]M.M. Granger, J. Protas, Compt. Rend. 260 (1965) 4553.
[7]O.V. Yakubovich, M.A. Simonov, N.V. Belov, Kristallografiya 20 (1975) 152. [8]O.V. Yakubovich, N.A. Yamnova, M.A. Simonov, N.V. Belov, Min. Zh. 5 (1983)
32.
[9]I. Hassan, M.J. Duane, Can. Min. 37 (1999) 1363. [10] I. Hassan, Amer. Min. 85 (2000) 1188. [11]S.M. Antao, I. Hassan, Can. Min. 46 (2008) 183.
[12]M. Mir, J. Janczak, Y.P. Mascarenhas, J. Appl. Cryst. 39 (2006).
[13]I. Mitov, Z. Cherkezova-Zheleva, V. Mitrov, J. Balkan Trib. Ass. 4 (1998) 191. [14]A.S. Povarennykh, E.I. Nefedov, Geol. Zh. 31 (1971) 13.
[15]V.S. Suknev, E.N. Diman, Zh. Prik. Spek. 10 (1969) 326. [16]V.F. Ross, J.O. Edwards, Chem. Boron Its Compd. (1967) 15. [17]R.L. Frost, J. Raman Spectrosc. 42 (2011) 540.
[18]M.V. Akhmanova, Zh. Struk. Khim. 3 (1962) 28. [19]D.A. Long, R.T. Bailey, Spectrochim. Acta 19 (1963) 1607. [20] A. Vasko, I. Srb, Czech. J. Phys. 17 (1967) 1110. [21]C.E. Weir, J. Res. Nat. Bur. Stand. A70 (1966) 153.
[22] V.C. Farmer, Mineralogical Society Monograph 4: The Infrared Spectra of Minerals, London, 1974.
[23]I. Ardelean, S. Cora, J. Mater. Sci. 19 (2008) 584.
[24]I. Ardelean, S. Cora, J. Optoelect. Adv. Mater. 12 (2010) 239. [25]I. Ardelean, L. Griguta, J. Optoelect. Adv. Mater. 9 (2007) 2068. [26]I. Ardelean, V. Timar, J. Optoelect. Adv. Mater. 10 (2008) 246.
[27]F.H. El Batal, M.A. Azooz, A.A. El-Kheshen, Trans. Ind. Cer. Soc. 68 (2009) 81. [28]F.H. ElBatal, Y.M. Hamdy, Trans. Ind. Cer. Soc. 67 (2008) 193.
[29]C. Rajyasree, P.M. Vinaya Teja, K.V.R. Murthy, D. Krishna Rao, Physica B406 (2011) 4366.
[30] B. Sumalatha, I. Omkaram, T.R. Rao, C.L. Raju, J. Non-Cryst. Solids 357 (2011) 3143.
[31]G.J. Beukes, H. de Bruiyn, W.A. van der Westhuizen, N. Jb. Miner. Mh. (1993) 385–392.