197
Abstract
This paper compares the performance associated with both direct and reverse ball mill closed circuit conigurations. Survey campaigns were carried out in both Samarco Mineração industrial plants, i.e., Concentrator I and Concentrator II. The former is equipped with a reverse-conigured ball mill closed grinding circuit, while the latter is equipped with ball mills under a direct closed circuit. The study consisted of laboratory jar tests, as well as comparisons between historical data obtained for both industrial plants. Comparisons based on historical data indicated that Concen-trator II, conigured in a direct mode, exhibited a better performance than that of Concentrator I. Such a conclusion is in contrast with the results obtained from survey campaigns, which indicated a better performance for the reverse coniguration. Such a difference was determined by the performance of the classiication stage, carried out in cyclones, as demonstrated by simulations conducted on the basis of previously calibrated models.
Keywords: iron ore, grinding, classiication.
Resumo
Os aspectos operacionais entre as conigurações de circuito fechado de moagem em moinhos de bolas, quais sejam, os circuitos direto e inverso, foram analisados com-parativamente. Foram realizadas amostragens no circuito industrial de moagem pri-mária do Concentrador I de Germano, operando sob ambas as conigurações, além de serem analisados os dados históricos industriais dos Concentradores I e II. Por im, fo-ram realizados ensaios de moagem em laboratório, simulando ambas as condições. A comparação entre os históricos dos dados industriais dos Concentradores I (operando sob circuito inverso) e do Concentrador II (operando sob circuito direto) mostrou um histórico consistente em que o circuito do Concentrador II apresenta menor consumo energético por tonelada de material gerado abaixo da malha de controle do circuito. Esses resultados foram diferentes daqueles obtidos a partir das amostragens realizadas no circuito industrial da Samarco, os quais indicaram melhor desempenho do circuito inverso. A diferença foi atribuída à etapa de classiicação, cujo desempenho determina a alteração ou até mesmo anula os benefícios, conforme demonstram os resultados de simulação posteriores.
Palavras chave: Minério de ferro, moagem, classiicação. Andreia Carolina Rosa
Engenheira de processo
Gerência de tecnologia e ecoeficência Samarco Mineração, Brazil
Homero Delboni Jr Professor Dr.
Departamento de Engenharia de Minas e de Petróleo
Universidade de São Paulo, Brazil [email protected]
Performance of direct and
reverse Samarco grinding
circuits
Desempenho dos circuitos de moagem direto e
inverso da Samarco
198
1. Introduction
The study of comminution process-es is a signiicant part of ore procprocess-essing history. One of the main reasons for this signiicance is the importance of these processes in beneiciation plants, either for the liberation of the minerals before concentration operations or to make products or sub-products that are ad-equate for the market or for downstream processes.
Additionally, comminution process-es are, in general, rprocess-esponsible for a major percentage of operational costs, which justiies the many studies in the literature referring to the best choice, sizing, and optimization of comminution circuits.
Although many comminution tech-nologies have been developed in the last few decades, typical comminution circuits still rely on the combination of crushers and screens or ball mills and cyclones. Hydrocyclones are largely employed due to their simplicity and large throughput.
There are two main
configura-tions used for grinding circuits, namely reverse circuits and direct circuits. In the irst case, the new feed of the circuit is reported to the classiication stage, whose coarse fraction feeds the mill, while the ines are sent to the circuit product low. In the direct circuit, the new feed reports directly to the mill before classiication.
Both conigurations have advan-tages and disadvanadvan-tages, which have been extensively discussed by specialists. The reverse circuit prevents the passage of inished sizes inside the mill, reduc-ing overgrindreduc-ing. In contrast, the direct circuit offers more operational simplicity such as by eliminating the need to place the mineral particles in water suspen-sion, which is a very critical operation, especially for dense materials.
However, despite all these discus-sions, there is very little information in literature regarding the comparison between direct and reverse circuits, and, most importantly, there is a limited
amount of industrial data available to support these comparisons.
In this context, the grinding circuit of Concentrator I, in Germano, from Samarco Mineração, offers an impor-tant opportunity. This circuit has six mills, namely, two pre-primary mills and four primary mills, which corre-spond to the irst and second stages of grinding, respectively. The pre-primary mills operate in open circuit and are fed with the crushed ore. The product of the pre-primary mills feeds two primary mills each, which operate in a closed, reverse circuit coniguration. The designations routinely used in Samarco were kept. On the occasions when the pre-primary mills are shut down, the crushed ore is fed directly into the pri-mary mills. Therefore, industrial data can be obtained from equipment operating in both circuit conigurations. These data were used in this study to analyze both types of circuits.
2. Methodology
The comparative analysis be-tween the direct and reverse conigu-rations was based on four sources of data:
• Sampling campaigns conduct -ed in the industrial grinding circuit of Concentrator I
• Historical data from both
Concentrator I and Concentrator II of Germano Mine
• Jar mill lab tests • Computer simulations.
Sampling campaigns were con-ducted in two distinct situations:
• Periods when Concentrator I
were operating under regular conditions (to obtain the data related to the reverse
circuit)
• Periods when the pre-primary
mills were shutdown (to obtain the data related to the direct circuit).
In both cases, the samples were
col-lected at points corresponding to the new feed of the circuit, primary mill products, feed, underlow and overlow of the hy-drocyclones. Figure 1 shows the grinding circuit of Concentrator I.
Slurry samples were collected over a one-hour period, with incre-mental samples taken each 10 minutes. Granulated materials were collected as a snapshot sample. During the sampling
campaigns, industrial data were regis-tered. For each sample, slurry density (or moisture content) and size analyses were conducted following standard procedures.
From the operational data, it was possible to calculate the Operat-ing Work Index and specific energy consumption per amount of material iner than the grind size (kWh/t-100#),
Figure 1
199
3. Results and discussion
which were used for the comparison of both circuits.
For the operational work indexes,
the correcting factors proposed by Rowland (1983) were applied for the evaluation of industrial circuits. The use
of Bond’s factor (1960) for the scalped feeds was also evaluated. This factor can be obtained by the following equation:
The grinding tests followed the methodology proposed by Donda (2003), which is routinely used at Samarco for process control. This methodology con-sists of a series of grinding jar tests that are run in crescent periods of time under standardized conditions. The sample is ground until the desired product is achieved, as speciied by industrial cir-cuit speciications (90% passing in 0.149 mm). This methodology was calibrated to predict the speciic energy consump-tion of the original industrial circuit of
Concentrator I of Germano, which was originally designed as a direct closed circuit.
The grinding tests were conducted with a sample collected from the indus-trial circuit of Germano Concentrator II. This was called the “standard sample” and consists of an increment of the feed from the industrial circuit crushed below 9.5 mm. In addition to these standardized conditions, an additional test was conducted using the standard sample fraction above 0.210 mm. This
additional test was performed to evalu-ate the beneits of the reverse circuit by removing the natural ines from the mill feed. The 0.210-mm sieve was chosen to simulate the industrial circuit product characteristics.
Finally, computer simulations were used to evaluate the inluence of the clas-siication stage on the global grinding circuit. The model used was proposed
by Nageswararao in 1978 (apud JKTech,
2009) and calibrated with industrial data from Germano Concentrator II.
The Operating Work Indexes, calculated with the data obtained from the sampling campaigns, demonstrated that the speciic energy consumption for the direct circuit was, on average, 30% lower than that for the reverse circuit. However, it was considered important to apply certain correction factors to this parameter due to the differences observed between the F80 and the reduction ratios
for both types of circuits. The reduction ratio during operation in reverse mode was smaller than that observed during opera-tion in the direct mode. As shown by the typical characteristics of a grinding curve, the speciic energy consumption usually increases as the feed size decreases (for the same product speciications). Bond (1961) also observed that the Work Index param-eter is inluenced by the grinding product
size and attributed those variations to the natural heterogeneities of the ore. Among the correction factors proposed by Rowland (1983) for the operating Wi is the EF7, which is associated with the reduction ratio of the circuit.
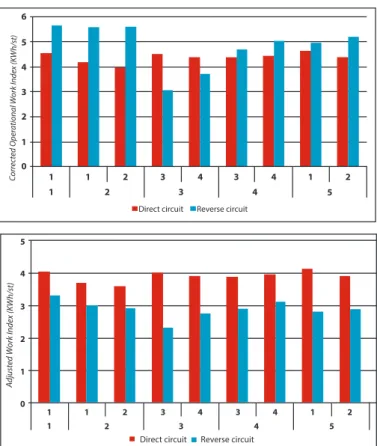
After applying the correction factors, the Operating Work Indexes for the direct circuit were 8% lower than those for the reverse circuit, as shown in Figure 2.
Figure 2 Operating Work Indexes.
Figure 3 Adjusted Operational Work Indexes.
6
5
4
3
2
1
0
1 1 1
1 2
2 3 2
3
3 4
4 4
5
C
orr
ec
ted O
per
ational W
ork Index (K
W
h/st)
Direct circuit Reverse circuit
5
4
3
2
1
0
1 1 1
1 2
2 3 2
3
3 4
4 4
5
A
djust
ed W
ork Index (K
W
h/st)
200
Figure 4
“kWh/t<100#” for the reverse and direct circuits.
To conirm the results obtained from the sampling campaigns, histori-cal data from both concentrators were compared, demonstrating that the
primary grinding circuit of Germano Concentrator II (which operates in the direct coniguration) exhibits a smaller speciic energy consumption than the
circuit of Concentrator I (which oper-ates in the reverse circuit coniguration).
Figure 5
Comparison of historical industrial data between Concentrators I and II.
The grinding circuit of Concentrator I consists of two stages, the irst operating in the open circuit mode. In literature, this coniguration is known to be less en-ergy eficient. At Samarco, it is common practice to apply the correction factor proposed by Rowland for open circuits before using the data from the irst stage. However, even after the application of this factor, the speciic energy consump-tion in Concentrator I is higher than that in Concentrator II, as shown in Figure 5.
To supplement this analysis, lab grinding tests were employed, with the
following results:
• The standard sample had 49.5%
passing in 0.149 mm; the oversize fraction of this same sample, after screening in a 0.210-mm sieve, had 4.7% passing in 0.149 mm, while the undersize fraction had 89.1% passing.
• The standard sample had 57.4%
passing in 0.210 mm.
• The energy consumption re -quired to grind the standard sample to 89% passing in 0.149 mm, (just as the undersize of the screened sample) is 4.4 kWh/t.
• The energy consumption re -quired to grind the oversize of the screened sample to 89% passing in 0.149mm is 8.1 kWh/t.
However, for the reverse circuit, a fraction of the new feed is not sent to the mill, i.e., it does not consume grinding energy. If it is assumed that an “ideal” classiication takes place before the mill stage or that all particles smaller than 0.210 mm reported to the ine fraction, it can be presumed that the fraction of the new feed that would be fed into the mill would be
Figure 3 provides a comparison of industrial data between the two types of circuits after the application of the factor for scalped feeds to the
data from the reverse circuit. It can be seen that the Operating Work Index was consistently smaller for the reverse circuit, which contradicts the results
of previous analyses. However, the pa-rameter kWh/-100# did not show any correlation between the two circuits, as shown in Figure 4.
Considering that only this mass fraction would consume grinding energy, the energy consumption of the reverse circuit would be
%mass = 100-57.4 = 42.6%
E = 0.426x8.1 = 3.45 kWh/t
K
wh/t<100#
12
10
8
6
4
2
0 1
1
1 2 1
2
2 3
3
3 4
4 4
5
Direct circuit Reverse circuit
Concentrador I Concentrador II Concentrador I - 10%
20
18
16
14
12
10
8
jan/10 fev/10 mar/10 abr/10 mai/10 jun/10 jul/10 ago/10 set/10 out/10 no
v/10
dez/10 jan/11 fev/11 mar/11 abr/11 mai/11
kW
h/t ( < 0.149 mm)
95% Confidence Interval for mean - Concentrador I
201 In this case, the reverse circuit would
present a speciic energy consumption 27% smaller than that of the direct circuit.
However, lab sieving procedures usually results in higher separation ef-ficiency than an industrial classifying operation, especially when hydrocyclones are employed. The oversize fraction of the screened sample presented only 4.7% of ines. If hydrocyclones were used, the
amount of ines expected on the coarse product would be much higher, which would reduce the energy beneits attrib-uted to the reversed circuit.
To illustrate this fact, a computer simulation was performed to estimate the size distribution for both the underlow and overlow of a classiication made in hydrocyclones for the same sample used in the grinding tests.
Both the hydrocyclone dimensions and the operational parameters used to calibrate the model were obtained from the industrial grinding circuit of Concen-trator II. The objective was to reproduce in the hydrocyclone overlow the same percentage passing in 0.149 mm of the undersize fraction of the screened sample. Table 1 shows the parameters used to calibrate the model.
Table 1 Parameters used to calibrate
Nageswararao’s model.
The simulation results demonstrat-ed the following:
• The hydrocyclone underflow
exhibited 32% passing in 0.149 mm, which is a much higher percentage than
the amount of ines observed in the over-size fraction of the sample screened in the laboratory.
• Mass recovery to the underlow
product was 69%, which means that 69%
of new feed would be reported to the mill. By following the same exercise per-formed before for the grinding tests, the energy requirement for the reverse circuit can be estimated as
Therefore, the reverse circuit would not provide any energy savings compared with the direct circuit (which presented an energy consumption of 4.4 kWh/t).
This exercise shows that the beneits of removing natural ines from the mill feed are dependent on the classiication stage performance. Hydrocyclones are usually used in industrial grinding cir-cuits, and, although they present various advantages, such as high throughput and easy installation, they usually have small-er separation eficiencies than screens.
Regardless the high amount of natural ines in the Samarco run of mine, the original grinding circuit was designed with a direct coniguration. The
follow-ing practical operational issues justify this choice:
• Easy flowsheet: keeping the
circuit simple is the key to guaranteeing projected results. For primary grinding circuits, slurring operations are com-plicated and consist of a limiting factor for the application of a reverse circuit. Therefore, it is necessary to evaluate whether eventual process gains would be annulled by the dificulties imposed by the proposed solution regarding the operation of the circuit.
• Grinding effects on the following
operations: many studies, as the presented
by Edwards and Dick (2004), Kimplel
(1996), Ahmed (2010), Banisi et. al.
(2002) and Bazin, Houdouin and Cooper (2001), alert to the effects of grinding product characteristics on subsequent operations, especially the concentration ones. At Samarco, Santos and Donda (2001) studied the inclusion of a clas-siication stage before primary grinding in Concentrator I. Although Santos and Donda achieved higher recovery indexes with the desliming circuit, the losses on lotation were signiicant. The surface preparation provided by grinding on natural fines was clearly essential for reagent selectivity.
Therefore, there are no general rules that can be applied to the choice of a grinding circuit.
Hydrocyclone diameter 26” (660 mm)
Vortex diameter 12” (305 mm)
Apex diameter 5” (127 mm)
Diameter of circle with the same area as the inlet 192 mm Length of cylindrical section 500 mm
Cone full angle 20°
Feed pressure 82 kPa
Feed percentage of solids 65%
E = 0.69x8.0 = 5.6 kWh/t
4. Conclusions
In the sampling campaigns con-ducted in this study, the results for the reverse and direct grinding circuits did not differ signiicantly. However, the historical data from Germano Concentrators I and II demonstrate that the direct circuit, which is used in Concentrator II, exhibited a smaller
speciic energy consumption than the reverse circuit used in Concentrator I.
This difference was attributed to the separation eficiency of the clas-siication stage, which was considered a determining factor on the grinding circuit performance.
Additional simulations
demon-strated that the classiication stage ef-iciency could alter or even negate the beneits of the reverse circuit.
202
Received: 24 July 2013 - Accepted 23 March 2013.
5. References
AHMED, M.M. Effect of comminution on particle shape and surface roughness and their relation to lotation process. International Journal of Mineral Processing, n. 94, p. 180-191, 2010.
BANISI, S. et al. Effect of ball size change on the performance of grinding and lota-tion circuits of the Sarcheshmeh copper mine. In: ANNUAL MEETING OF THE CANADIAN MINERAL PROCESSORS, 34. Ottawa, 2002.
BAZIN, C., HODOUIN, D., COOPER, M. Interactions between grinding and lota-tion. In: Interactions in Mineral Processing. COM, 2001. p. 3-16.
BOND, F.C. Conirmation of the third theory. AIME Transactions. San Francisco, 1960.
BOND, F.C. Crushing and grinding calculations. Allis-Chalmers Publication, 1961.
DONDA, J.D. Um método para prever o consumo especíico de energia na (re)mo-agem de concentrados de minérios de ferro em moinhos de bolas. Ph.D Thesis. Belo Horizonte: Universidade Federal de Minas Gerais, 2003 (Ph.D Thesis).
EDWARDS, C., DYCK, K. Replacement of classiication screens with cyclones in the
McArthur River Uranium Mine grinding circuit. In: ANNUAL MEETING OF THE CANADIAN MINERAL PROCESSORS, 36. Ottawa, 2004.
JKTECH. JKSimMet steady state mineral processing simulator – version 5.1. Indo
-oroopilly, 2003. In:https://downloads.jktech.com.au/JKSimMetV5.2.01Release/ JKSimMet%20V5.2.01%20Basic%20Install%20Files/JKSimMet%20V5.1%20
Manuals/. Accessed on 14. dec. 2009.
KIMPLEL, R.R. Some industrial experiences in modifying ine grinding environ -ments for improved downstream product performance. International Journal of Mineral Processing, n. 44, p. 133-142, 1996.
ROWLAND JR, C.A. The tools of power power: the bond work index, a tool to
measure grinding eficiency. In: Selection Circuits to Prepare Beneiciation Feeds. Allis Chalmers Bulletin,1983.