Novel Test Structures for 2D-Mesh NoC with
Evaluation on the Coverage-driven &
VMM-based Testbench
Ying Zhang, Ning Wu, and Fen Ge
Abstract—NoC(Network-on-Chip) has been proposed as a
new solution to deal with the global communication problem of complex SoC(System-on-Chip). However, there are many difficulties in testing and verification for NoC. We propose novel test architectures for 2D-Mesh topology NoC to improve the parallelism of tranferring test packets. The testing efficiencies of different structures are evaluated under a coverage-driven and hierarchical NoC testbench, which is based on the VMM verification methodology and SystemVerilog language. The evaluation results of testing cost, testing time and hardware overhead show that the shortening of transmission path and parallel testing effectively decreases the power consumption and testing time. Furthermore, one of the test structures can be proved to the optimal scheme.
Index Terms—test structure, parallel testing, NoC, testbench, VMM
I. INTRODUCTION
ITH the development of the semiconductor industry and growing scale of the chip design, NoC (Network on Chip) will become the solution to the design of complicated system chip instead of traditional bus system chip SoC (System on Chip), which will also pose the greatest challenge to associated validation and testing. Furthermore, validation and testing are expected to account for more than 70% of the whole design work for complex system chip [1]. There is urgent demand for novel testing methods or schemes aiming at testing complicated system chips, especially NoCs.
However, there are many difficulties in NoC testing. Such as the controllability and observability are poor for the network structure and communication scheme, GALS (Global Asynchronous Local Synchronous) method make it necessary for adopting various testing clocks and there is no standard benchmark for evaluation NoC testing, etc. As far as the first difficulty is concerned, the test structure of NoC should be distributed to cooperate with the communication architecture and decrease the hardware overhead. The test
control components are inserted to the network and the basic strategy is to transmit test vector to resources under test through tested components [2]. There are two steps of NoC testing, the first one is to test communication fabric when the router (switch) can be regarded as a IP core and we can apply the same test vectors to all the routers, the second one is to reuse the communication fabric as the test access to resources and transfer test data packets through particular testing input. The verification of communication fabric can be accomplished by the associated testbench [3-5], while the key problem of the second step is how to choose or configure the testing input.
Manuscript received July 16, 2011; revised August 08, 2011. This work was supported in part by the National Natural Science Foundation of China (No. 61076019), China Postdoctoral Science Foundation (20100481134), the NUAA Research Funding (NS2010115) and the NUAA Initial Funding for Talented Faculty (1004-YAH10027).
Ying Zhang is with the College of Information Science and Technology, Nanjing University of Aeronautics and Astronautics, Nanjing, China (e-mail: [email protected]).
Ning Wu is with the same place of Ying Zhang. (e-mail: [email protected]).
Fen Ge is with the same place of Ying Zhang. (e-mail: [email protected]).
Authors of [6] choose one switch to be connected to the source of test data (called Test Access Switch, TAS) and all the test data are broadcasted from TAS. Though the test scheme is prior to traditional bus-based SoCs in test time and power consumption, it needs complicated routing algorithm and may cause the increase of test time especially for large NoCs. The same situation may be worse when the TAS is the center of the network [7]. Because the center switch will be the hot-spot when all its neighbors communicate with it, the congestion will happen and greatly increase the test time. The solution to the problem is to increase the input/output port number so as to improve the efficiency of parallel testing. M. Sedghi et al. [8] apply two TASs, one is located on the lower left of the network and the other is at the upper right. The advantage in test time is showed, but the location of TASs can not change and specific routing algorithm is needed.
We propose a novel test structure of 2D-Mesh NoC which has configurable TASs. It is greatly adaptable for parallel testing of routers and resources. The evaluation on the VMM-based testbench shows the reasonable test structure configuration is effective in improving testing efficiency and reducing testing cost.
Hereafter, Section II gives a brief introduction of the NUT (NoC Under Test) and the associated testbench. Section III presents the NoC test structures and their application. Section IV explains the results of performance evaluation for the test structures with different TASs configuration. Section V draws the conclusions.
II. NOC UNDER TEST AND THE TESTBENCH
A. NoC Under Test
NoCs can be defined as a set of structured routers and point-to-point channels interconnecting IP cores (Resources). The topology of NoC can be represented as an undirected
W
connected graph G(N,L), where N={n1,n2,…ni} is the set of
nodes and L={l1,l2, …lj} is the set of links in the
corresponding network. The widely applied topologies are Mesh, Torus, Ring, Hypercube and Fat-tree [9]. For regularity of its structure, Mesh network are easy to implement and have good scalability. Each node in Mesh network is connected to neighbors through regular grid point-to-point links. Fig. 1 shows a 4×4 2D-Mesh network, which is the structure of our NoC.
IP
IP
IP
IP IP
IP
IP
IP IP IP IP IP IP
IP
IP
IP
Router
Router
Router
Router Router
Router
Router
Router Router Router
Router Router
Router Router
Router Router
The key component of the network fabric is communication node (router). Our router under test is realized in RTL description [10]. The architecture of router is shown in Fig. 2. It includes Cross switches, FIFO, Routing and arbitration module, Link Controller (LC) and Network Interface (NI).
Routing and arbitration
LC
LC
LC
LC
LC LC
LC LC LC
LC Cross
switches Input
FIFO
In
pu
t
cha
nn
el
Link controller
NI output channel
ou
tput
ch
an
n
el
NI input channel
Each router has four input channels and four output channels and one network interface for providing communication service to resource nodes. The input channel adopts FIFO for flow control, while output terminal sends information forward directly without needing FIFO. Routing and arbitration module can be adjusted according to certain routing algorithms.
Our NoC employs XY routing algorithm, which is the most commonly used deterministic routing algorithm. XY routing algorithm is related to source node and destination node addresses while irrelevant to network status. It is suitable for 2D-Mesh topology and other similar topology NoCs. It is known to be deadlock-free in meshes and easy to implement in hardware.
NoCs typically use the message communication model and messages are usually formed in packets. Each packet is composed of a header and some payloads. The original data packets format of our NoC is shown in Fig. 3.
Packet_Type Destination_ID Source_ID Packet_Length Reserve HEC
0 7
31 28 24 20 17
3bit 4bit 4bit 3bit 10bit 8bit
Payload 1
Payload n
0 31
0 31
Packet_Type demonstrates the type of data packets,
Destination_ID and Source_ID are destination and source
address, Packet_length gives the total packet number of the message, Reserve field is for extension or user-defined function. HEC is used to validate the packet. Payload is the actual communication data.
B. Coverage-driven and VMM-based testbench
The hierarchical NoC testbench is based on the VMM methodology, which integrates assertions, abstraction, automation and reuse mechanism to improve validation efficiency and productivity [11]. The testbench consists of Test Layer, Scenario Layer, Function Layer, Instruction Layer and NoC Under Test. The transmission between different layers is achieved through channel mechanism [12]. The test process contains four steps and they are generating random stimuli, establishing the testbench environment, executing the test and producing the verification report.
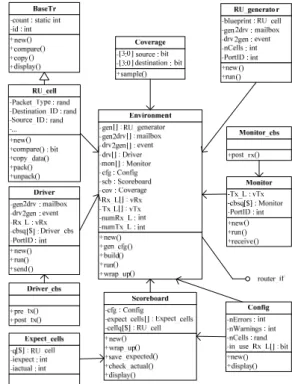
Each module of the testbench is realized in the form of certain class, the UML class diagram to explain their relationship is shown as Fig. 4.
The Environment class is the core of the NoC testbench. It
is almost related to all the modules and controls the building, operating and ending of test process.
The Config class determines whether send packets to the
specific node or not and the quantity of packets, etc. According to the configuration information, RU_generator is responsible for generating random packets with constraints and sending them to next layer through the channel.
The Driver receives packets from RU_generator, then sends them to NoC and transmits to the Scoreboard through callback at the same time. Monitor concentrates on output packets from NoC and transmit data to the Scoreboard and
Coverage class. Scoreboard achieves the expected packets
from Driver, gets actual packets from Monitor, then compares them and induces the result.
The Coverage class defines the related cover point and can
Fig. 1. 4×4 Mesh network
Fig. 2. Architecture of router under test
modify restraint based on the result of simulation. Function coverage is the important parameter to evaluate the efficiency of the testbench, which refers to the validated function of all functions percentage. Adopting different random seeds and modifying design repeatedly, our testbench finally achieves 100% function coverage.
The testbench can accomplish function verification effectively with good adaptability and expansibility. Only provided the packets format and the timing sequence of sending and receiving packets are known, the testbench can be easily applied to different NoCs without the consideration of topology structure or routing algorithm.
III. DESIGN OF NOC TEST STRUCTURES
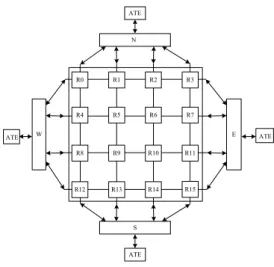
We propose the test structure which adopts edge of Mesh as TASs, as shown in Fig. 5. ATE and peripheral circuits are connected in four directions, while TAS selection can be flexible with the configuration of related circuit. The structure has less test pins and can greatly shorten the transmission path of test data packets, which will be helpful to the parallel testing and decrease testing time as well.
E N
S
W ATE
ATE ATE
R0 R1 R2 R3
R4 R6 R7
R8 R9 R10 R11
R12 R13 R14 R15
R5
ATE
The structure of periphery circuits is shown in Fig. 6. The input of periphery circuits comes from output ports of routers and input ports of ATE, while the output of periphery is connected to input ports of routers and output ports of the ATE. Test data packets are transferred from the ATE and sent to certain router according to the input configuration. Test response packets are sent into the peripheral circuits and passed through selectors to output port of the ATE. Moreover, the arbitration mechanism is added to prevent the competition between routers.
A rbitration M U X
Config
m odule
Output Port
Input Port
Periphery
M esh ATE
Router Output
Router Input
In order to reduce the area overhead, we can configure partial peripheral circuits, as shown in Fig. 7, where only two ports are selected in each direction. The number and position of TASs can be adjusted according to the network size and the application characteristic.
E ATE
ATE ATE
R0 R1 R2 R3 R4 R6 R7 R8 R9 R10 R11 R12 R13 R14 R15
R5
ATE W
S S
Based on the proposed test structure, we design the corresponding test strategy, which involves the adjustment of packets format and transmission manner.
The original format of data packets is shown as Fig. 3. The
packet_type field can be defined as follows.
(1) 000 means normal data packets.
(2) 1** means test data packets. 101 means test data packets of interconnection. The source and destination of normal packet is impossible to be the same, while they can be set to the same so as to form a loop for interconnect testing. The address of interconnect testing packet shows that the packet is sent into the network from which router. 110, 111 respectively indicate test data for routers or resources. Based
on Destination_ID field, we can know the packet is sent to
which router or resource.
(3) 01* means response data packets. 010, 011 indicate respectively for the response data of routers or resources. We certainly know the response data is for which router or resource based on the Source_ID field.
Test routing algorithm determines the transmission path of test data and response packets. The transmission of test data packets can use original XY routing algorithms, while for the response packets, the original routing algorithm need to be improved because the ATE will be the test access port instead of the network interface. To indicate the direction of the connected ATE, we need to encode other directions of the router except network interface. Therefore, 00, 01, 10, 11
respectively indicate east, south, west and north direction, as shown in Fig.8.
Router N
E
S W
00
01 10
11
Y-Y+ X+
X-Furthermore, the Direction field is added to the head flit to indicate the direction of ATE output, as shown in Fig. 9. Therefore, response packets can return to output of ATE with the original routing algorithm.
Fig. 7. Test structure of NoC with 8 TASs
Fig. 5. Test structure of NoC with16 TASs
Fig. 8. Encode of router output directions
Fig. 6. Architecture of periphery circuits
Packet_Type Destination_ID Source_ID Packet_Length Direction HEC
3bit 4bit 4bit 3bit 8bit 8bit
Reserve
2bit
0 7
31 28 24 20 17 15
After the modification of packet format, the transmission manner should be adjusted to cooperate with the test structure. Firstly, test data packet is generated from input of ATE and sent into the network through the periphery circuit. Then it is transferred to the router or resource based on routing algorithm on the assumption of all the routers on the path should already accomplish testing. After testing, the head flit of response data packet is generated according to the head flit of the test data packet. The generation is mainly to modify
Packet_Type fields and exchange information of
Destination_ID and Source_ID field. The last process will be
the transmission of response packet, which can be achieved in two steps. The first step is to reach the border router connected to ATE and the second one is to send packet to output of ATE through the periphery circuit according to the
Destination_ID field.
IV. PERFORMANCE EVALUATION OF TESTING SCHEMES
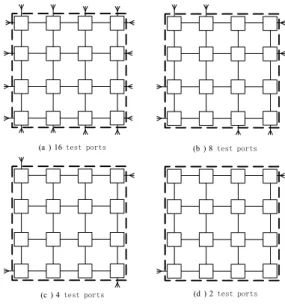
For 4x4 Mesh network, Fig. 10 gives four testing schemes with different TAS configuration and each resource chooses the nearest TAS for test vectors transmission.
(a ) 16test ports
(c ) 4test ports
(b ) 8test ports
(d ) 2test ports
How to choose TASs greatly affects test cost, test time and corresponding synthesis area. The test cost mainly refers to test power, which is relevant to the number of test packets and the length of transmission path [13] [14]. The test time can be evaluated by the modified VMM-based testbench and the area overhead of Scheme (a) and Scheme (b) are calculated and compared with the original Mesh NoC on Synopsys EDA platform.
A. Estimation of Test Cost
For simplifying and standardizing the estimation of test cost, we assume that the number of test data packets for each resource to be constant C. NRi and NCi are respectively the number of routers and channels in the test path for Resourcei
andN =N -1Ci Ri . and are respectively the average cost
of test packets passing through one router and through one channel. n is the total number of resources, so the total test costs can be calculated as follows.
R
T TC
all T
1 1 1
( * * ) *
[( * ( 1) * ]*
[( ) * ]*
n
all Ri R Ci C
i
n
Ri R Ri C
i
n
R C Ri C
i
T N T N T C
N T N T C
T T N T C
=
=
=
= +
= + −
= + −
∑
∑
∑
(1)
Most parameters in Equation (1) are constants exceptNRi,
so the total test cost can be measured by , that is the number of routers in test paths for all resources.Test costs of four testing schemes in Fig. 11 are shown as Table I.
Fig. 9. Head flit of the test data packet
Scheme NRi=1 NRi=2 NRi=3 NRi=4 Sum
(a) 12 4 0 0 20
(b) 8 8 0 0 24
(c) 4 8 4 0 32
(d) 2 4 6 4 44
It is evident that the test cost increases with the decrease of TASs and obviously Scheme (c) and scheme (d) have too high test costs to be good testing schemes. Scheme (a) has lowest test cost but 16 TASs will lead to unacceptable size overhead. Compared with Scheme (a), Scheme (b) has a little increase on test cost and much decrease on test ports, so it should be optimal scheme. Reasonable choice of the position and number of TASs is extremely important especially when the scale of network increases.
B. Evaluation of Test Time
For the function verification, the driver and monitor module of the testbench are connected to each router to verify the communication between resources. However, for the testing, the driver and monitor module should be connected to periphery circuits to make the original test platform equivalent to the ATE.
Because we concentrate on the evaluation of test time for test structures instead of how to test resources, the resource module is simply programmed to simulate test response. The test data packets are generated from the testbench, then sent to resources through TAS and related routers. Resource module is responsible for generating response data packets and sending them to the test port. The time spent by resource module itself will be ignored. Such a process accomplishes reusing the communication network as test access mechanism.
We take IP6 as an example to explain the test process, as shown in Fig.11.
The router R3 is set as the input and output port of the
1 n
Ri i
N =
∑
TABLE I
COMPARISON OF TEST COSTS
Fig. 10. Schemes of different test ports configuration
The majority of synthesized areas are interconnection lines, so the increase of TASs will surely increase the area overhead. The results of Table II show the Mesh network with additional test structure has bigger size than original Mesh network and Scheme (b) is superior to Scheme (a) on size overhead.
Mesh network and that is TAS. The transmission path for test data packets from the input port to the IP6 is: input
port , the response path is:
output port.
R3 R2 R6 IP6
→ → → →
6→R6→R7→R3→
IP
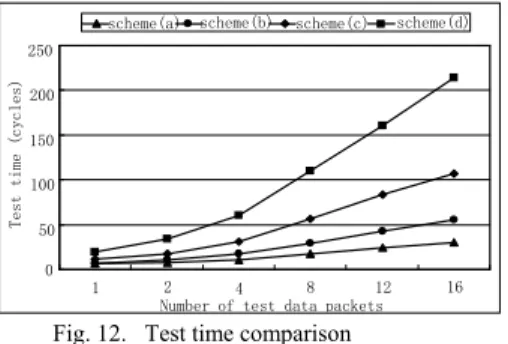
The test time of four testing schemes is shown in Fig. 12. X axis is the number of test data packets received by each resource node and Y axis is the time when the last packet is received. When packets number is small, there is no obvious different in test time for all the schemes, however, with increase in packets number, the test time of four schemes gradually increase and the difference between them also becomes increasing. The increase of TASs greatly enhances testing parallelism and effectively reduces the test time.
The testability design can reduce the testing time, but it would increase the cost of the area. We manage to find the strategy to make balance between two aspects. This paper puts forward four testing schemes, Scheme (b) is the best one which has relatively shorter test time and delay time, small synthesized area and its test costs is modest.
V. CONCLUSION
We proposed a configurable test structure for 2D-Mesh NoC and given four practical schemes with different TASs configuration. The evaluation platform is the coverage-driven and VMM-based testbench which is originally designed for communication verification on NoC. By adjusting the packet format and routing mechanism, the testbench is applied to evaluating the performance of different testing schemes. Combined with the circuit synthesis results, the optimal scheme can be verified. The experimental results showed that the shortening of transmission path and parallel testing effectively decreases the test cost and test time.
The average delay time between sending test data packets and receiving response packets is shown as Fig.13.With the decrease of TASs, the average delay also increases gradually, because average path from TAS to resource gets longer. However the difference between Scheme (a) and Scheme (b) is not obvious.
a b c d 0
20 40 60 80 100
A
v
er
age D
elay
(c
ycl
es)
Schemes 57.52 60.41
68.93 87.89
Based on the analysis of the test time with variable packets number and the statics of test packet transmission time, we can conclude that test time is mainlyaffected by the number of test ports, especially when the amount of communication information increases greatly.
C. Evaluation of Area Overhead
For the advantage in test cost and test time, the Scheme (a) and Scheme (b) were synthesized and optimized based on Synopsys DC Compiler and SMIC 0.18 CMOS technology library. Table II gives the area overhead of original Mesh network and the Scheme (a) and (b). The ratio of increase is relative to the synthesized area of original Mesh network.
Original Mesh
Scheme(a)
Ratio of increase
Scheme(b)
Ratio of increase Combination
logic 959583.24 972296.74 1.325% 964227.32 0.484%
Sequence logic 2134660.71 2156475.23 1.022% 2145984.61 0.530%
Interconnect 30881190.62 31257792.38 1.220% 31008210.76 0.411%
Total size 33975434.56 34386564.36 1.210% 34118422.69 0.421%
REFERENCES
[1] Chris Spear, SystemVerilog for Verification, Synopsys, Inc. 2006. [2] C. Grecu, P. Pande, B. Wang et al. “Methodologies and Algorithms for
Testing Switch-based NoC Interconnects,” in Proc. 20th. DFT Conf. Defect and Fault Tolerance in VLSI Systems, Montery(CA), 2005, pp. 238–246.
[3] Y. Li, L. Liang, “An NoC Modeling and Simulating Method with SystemC,” Microelectronic & Computer, China, vol.27, no. 3, pp. 78–82, Mar. 2010.
[4] N. Banerjee, P. Vellanki, and K. S. Chaha, “A power and performance model for Network-on-Chip architectures,” in Proc. DATE Conf. France, 2004, pp. 1250–1255.
[5] J. Kreku, M. Hoppari, and T. Kestilä, “Application-platform performance modeling and evaluation,” in Proc. Forum on FDL Conf. Specification, Verification and Design Languages, Sttargart, 2008, pp. 43–48.
[6] M. Hosseinabady, A. Banaiyan, M.N. Bojnordi et al. “A concurrent testing method for NoC switches,” in Proc. Design Automation & Test in Europe Conf. Vol.1, Munich, 2006, pp. 244.
[7] F. Zhang. “Design-for-Testability Optimal Strategy and
Design-for-Testability Research Based on Network-on-Chip,” M.S. thesis, Dept. Electron. Eng., Tsinghua Univ., China, 2007.
[8] M. Sedghi, E. Koopahi, A. Alaghi et al. “An NoC test strategy based on flooding with power, test time and coverage considerations,” in Proc. VLSI Design Conf. Hyderabad, 2008, pp. 409–414.
[9] Tayan, O. “Networks-on-Chip: Challenges, trends and mechanisms for enhancements,” in Proc. ICICT'09 Conf. Information and Communication Technologies, Karachi, 2009, pp. 57–62.
[10] S. Ding, N. Wu, F. Ge, Q. Wang, “The research on system-level modeling of router for Network-on-Chip,” Microelectronic & Computer, China, vol.26, no. 1, pp. 93–96, Jan. 2009.
[11] J. Bergeron, E. Cerny, A. Hunter, A. Nightingale, Verification Methodology Manual for SystemVerilog, Synopsys & ARM Inc. 2006. [12] Mao Ye, “Research and Implementation of VMM-Based Verification Platform,” M.S. thesis, Dept. Electron. Eng., Huazhong University of Science and Technology, 2008.
[13] Erika Cota, Luigui Carro, Flavio Wagner et al. “Power-aware noc reuse on the testing of core-basedsystems,” in Proc. ITC’02 Conf. Baltimore, 2002, pp. 612–621.
[14] C.A. Zeferino, A.A. Susin. “SoCIN: A Parametric and scalable network-on-chip,” in Proc. Intergrated Circuits and Systems Design (SBCCI)’03 Conf. Sao Paulo, 2003, pp. 169–174.
TABLEII
AREA OVERHEAD COMPARISON
Fig. 13. Average delay time comparison Fig. 12. Test time comparison
0 50 100 150 200 250
1 2 4 8 12 16
Number of test data packets
Test time (cycles)
scheme(a) scheme(b) scheme(c) scheme(d)
m2 m
μ μ 2 μm2