Cardiorespiratory Fitness of a Brazilian Regional Sample Distributed
in Different Tables
Karlyse Claudino Belli
1, Carine Calegaro
3, Cleusa Maria Richter
2, Jonatas Zeni Klafke
2,4, Ricardo Stein
1,
Paulo Ricardo Nazario Viecili
2,3Universidade Federal do Rio Grande do Sul1, Porto Alegre; Instituto de Cardiologia de Cruz Alta2, Cruz Alta; Universidade de Cruz Alta3, Cruz Alta; Universidade Federal de Santa Maria4, Santa Maria, RS - Brazil
Mailing Address: Paulo Ricardo Nazario Viecili •
Rua Domingo Veríssimo, 636, Toríbio Veríssimo. Postal Code 98005-700, Cruz Alta, RS, Brazil
E-mail: vieciliprn@cardiol.br, vieciliprn@uol.com.br
Manuscript received January 13, 2012; manuscript revised January 18, 2012; accepted April 9, 2012.
Abstract
Background: Most classification tables of cardiorespiratory fitness (CRF) used in clinical practice are international and have not been validated for the Brazilian population. That can result in important discrepancies when that classification is extrapolated to our population.
Objective: To assess the use of major CRF tables available in a Brazilian population sample of the Central High Plan of the state of Rio Grande do Sul (RS).
Methods: This study assessed the retrospective data of 2,930 individuals, living in 36 cities of the Central High Plan of the state of RS, and considered the following: presence of risk factors for cardiovascular disease and estimated maximum oxygen consumption (VO2peak) values obtained through exercise test with Bruce protocol. To classify CRF, the
individuals were distributed according to sex, inserted in their respective age groups in the Cooper, American Heart Association (AHA) and Universidade Federal de São Paulo (Unifesp) tables, and classified according to their VO2peak.
Results: Women had lower VO2peak values as compared with those of men (23.5 ± 8.5 vs. 31.7 ± 10.8 mL.kg-1.min-1,
p < 0.001). Considering both sexes, VO2peak showed an inverse and moderate correlation with age (R = -0.48, p < 0.001). An important discrepancy in the CRF classification levels was observed between the tables, ranging from 49% (Cooper x AHA) to 75% (Unifesp x AHA).
Conclusion: Our findings indicate important discrepancy in the CRF classification levels of the tables assessed. Future studies could assess whether international tables could be used for the Brazilian population and populations of different regions of Brazil. (Arq Bras Cardiol 2012;99(3):811-817)
Keywords: Physical fitness; oxygen consumption; urban population; exercise test; classification.
Introduction
The body of evidence correlating low cardiorespiratory fitness (CRF) with an increase in cardiovascularmorbidity and mortality is very robust1-4. That association does not depend
on the presence of other risk factors, providing important diagnostic and prognostic data5.
The CRF level, assessed by use of maximum or peak oxygen consumption (VO2peak), can be measured through the
analysis of expired gases, a direct measure considered the reference standard, or can be estimated in a conventional exercise test (ET) using ergometry. Currently, the existing standardizations for conventional ET allow comparisons between individuals, the Bruce protocol being widely used for adults6-8.
Cardiorespiratory fitness can be classified by use of different tables, according to age, sex and VO2peak4. However, those
tables can vary significantly7-9, which can be a confounding
factor in the search for accuracy in classifying individuals. It is worth noting that the most used tables for CRF classification are that by Cooper9 and that of the American Heart Association
(AHA)10. The table of the Center of Physical Activity and
Sports Medicine of the Universidade Federal de São Paulo (Unifesp)11, genuinely Brazilian, is rarely used.Thus, this study
aimed at assessing the existence of equivalence among those CRF classification tables (Cooper9, AHA10 and Unifesp11),
having estimated VO2peak as the base for comparison, and
assessing individuals from a Brazilian regional sample.
Materials and Methods
Table 4 compares the percentage and number of individuals in each CRF classification level of the three tables assessed. An important disagreement is observed among the CRF levels of each table (Cooper vs. AHA= 49%; UNIFESP vs. AHA= 75%; and Cooper vs. UNIFESP 56%). Other comparisons are shown in Table 4.
Discussion
This study is the first to compare the distribution of CRF levels in a Brazilian regional sample regarding the three CRF classification tables used in Brazil. Our findings indicate relevant discrepancies among the Cooper, AHA and Unifesp CRF classification tables.
Most CRF classification tables have originated in other countries. Thus, ethnical and social differences regarding the Brazilian population might interfere in the CRF classification. In addition, it is worth noting that the different methods used to obtain VO2peak, as well as the criteria used for CRF classification and different ages might have contributed to the disagreeing results found in our study.
In addition, the external validity of data collected in other countries or from small samples should be tested in Brazilian individuals, because pure and simple extrapolation might lead to rough errors15. It is worth noting that both Neto et al.16 and
Negrão17 have already called attention to the generalization
of reference parameters regarding the evaluation of CRF. Another important point in this study relates to the wide age range of the participants (13 to 91 years). The enrollment of individuals from a wide age range and the large sample enabled a comparative CRF analysis with other similar studies. Each CRF classification table has its particularities as follows: the Cooper table used individuals over the age of 13 years, regardless of their level of physical activity9; the AHA table
encompassed individuals aged between 20 and 69 years, with either a sedentary lifestyle or not10; and the Unifesp table
selected only individuals aged between 20 and 59 years with a sedentary lifestyle11. Of the 2,930 individuals studied, 100%
were allocated to the Cooper table, 85% (2,480) to the AHA table, and 65% (1,913) to the Unifesp table, which had the greatest rate of exclusion.
When measuring functional capacity, CRF can be obtained by use of different methods. To collect that information, conventional ET on a treadmill was performed with the Bruce protocol, which has been widely used for youngsters and adults, being the most commonly used in Brazilian health services6,18. However, Cooper has used
the length of stay in the Balke treadmill protocol19. The
Unifesp table used the curve adjustment for VO2peak vs.
age11, and the direct measure through expired gas analysis.
However, independently of measuring VO2peak directly or indirectly, the major aspect for an accurate analysis lies in the specificity of the measures performed9,19.
Assessing the VO2peak variation per decade, a more expressive drop occurred as the individuals’ age increased, for both sexes, a regular and inverse correlation between age and VO2peak being observed (r = -0.48). It is worth noting the striking similarity of that value with that of the study by Jae et al.20 performed with direct measurement of expired gases
(years); sex; history of diabetes; hypercholesterolemia; hypertriglyceridemia; systemic arterial hypertension; smoking; alcohol abuse; sedentary lifestyle; stress level; and presence of coronary artery disease (CAD). The following parameters were measured: body mass (kg), by use of a precision scale (Cauduro LTDA, model BB for 150 kg); height (cm), by use of a graded ruler in centimeters; and abdominal circumference (AC), by use of a measuring tape at the level of the navel13. Body mass
index (BMI: weight/height2) was calculated according to the
World Health Organization recommendations12.
The individuals underwent ET according to the following indications of local general clinicians and cardiologists: diagnosis of myocardial ischemia; assessment of invasive and medicamentous therapies; assessment of arrhythmias; and assessment of physical fitness and exercise prescription. The ET was interrupted in the presence of limiting symptoms, maximum heart rate, or any abnormality during its execution.
The VO2peak values were obtained by use of treadmill stress test with Bruce protocol. The VO2peak was estimated based on the formulae used in the ErgoPC program, according to the method established in the Brazilian Society of Cardiology guidelines14. All data were collected by one single examiner.
This study was approved by the Ethics Committee on Research in Human Beings of the Universidade de Cruz Alta (Unicruz) (protocol 003/09).
To classify the CRF, the subjects were distributed according to sex, and inserted in the age groups of the Cooper9, AHA10
and Unifesp11 tables. Then, the percentage distribution of the
individuals was analyzed at each level of the different tables. Finally, the CRF levels were compared between the three tables. Table 1 shows the classification criteria of the tables9-11.
The results were shown as relative and absolute frequencies for categorical variables, and as mean and standard deviation for continuous variables. The variables were compared by use of the chi-square test for proportions and the t test for means. Pearson correlation coefficient was used to assess the correlations between the variables age and VO2peak. The differences between
the groups were considered significant when p ≤ 0.05.
Results
This study sample comprised 2,930 individuals, 1,765 (60%) were of the female sex, and 96%, white. Their age ranged from 13 to 91 years (mean, 54 ± 14 years). Men were younger (52 ± 14 vs. 54 ± 13 years, p = 0.001) and had greater body mass (85 ± 15 vs. 69 ± 14 kg, p < 0.001), BMI (28 ± 5 vs. 27 ± 5 kg/m2, p < 0.001), and AC (103 ±
13 vs. 94 ± 13 cm, p < 0.001) as compared with women. Table 2 shows the distribution of individuals according to the presence of risk factors.
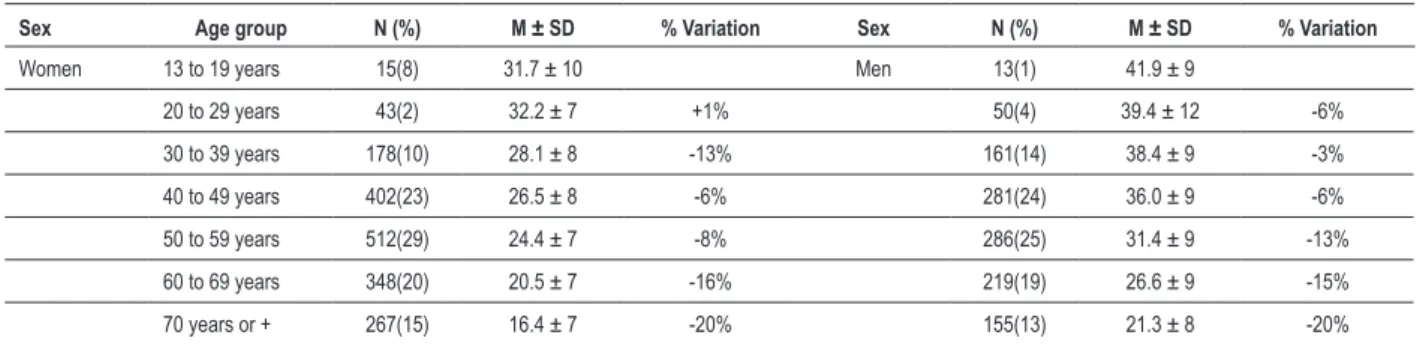
As expected, women had lower VO2peak values than men (23.5 ± 8.5 vs. 31.7 ± 10.8 mL.kg-1.min-1, p < 0.001). The
VO2peak showed an inverse and moderate correlation with age for both sexes (R = -0.48, p < 0.001). Table 3 shows the mean VO2peak values according to the age groups. For both sexes, the VO2peak percentage progressively decreased as age increased.
(r = -0.5). As expected, VO2peak decreased as age increased, especially from 50 years onwards, decreasing regularly around 20% to 25% per decade, and this was much more evident in individuals over 60 years7,8. However, the small number of
individuals allocated for the decades below 40 years might explain the irregular variation found among individuals aged between 13 and 39 years.
A study has reported that VO2peak can decrease approximately 10% per decade in non-athletic individuals, this drop varying from 3% to 6% in individuals aged between 20 and 30 years5. That decline can reach 20% after the age
of 60 years21, being faster among men15,22. It is worth noting
the similarity between those literature data and ours, taking in mind that our findings were obtained by use of indirect
Table 1 – Cardiorespiratory itness classiication levels of women and men according to Cooper, AHA and Unifesp, based on VO2peak
WOMEN Age (years) 13-19 20-29 30-39 40-49 50-59 60-69 60+
Table Category VO2 values mL(kg.min) -1
Cooper Very poor <25.0 <23.6 <22.8 <21.0 <20.2 <17.5
AHA Very weak <24 <20 <17 <15 <13
Unifesp Very weak <30 <29 <25 <25
Cooper Poor 25.0–30.9 23.6–28.9 22.8–26.9 21.0–24.4 20.2–22.7 17.5–20.1
AHA Weak 24–30 20–27 17–23 15–20 13-17
Unifesp Weak 30–34 29–33 25–29 25–29
Cooper Regular 31.0–34.9 29.0–32.9 27.0–31.4 24.5–28.9 22.8–26.9 20.2–24.4
AHA Regular 31–37 28–33 24–30 21–27 18–23
Unifesp Regular 35–36 34–35 30–32 30–32
Cooper Good 35.0–38.9 33.0–36.9 31.5–35.6 29.0–32.8 27.0–31.4 24.5–30.2
AHA Good 38–48 34–44 31–41 28–37 24–34
Unifesp Good 37–41 36–38 33–34 33–34
Cooper Excellent 39.0–41.9 37.0–40.9 35.7–40.0 32.9–36.9 31.5–35.7 30.3–31.4
AHA Excellent >49 >45 >42 >38 >35
Unifesp Excellent >41 >38 >34 >34
Cooper Superior >42.0 >41.0 >40.1 >37.0 >35.8 >31.5
MEN Age (years) 13-19 20-29 30-39 40-49 50-59 60- 69 60+
Table Category VO2 values mL(kg.min) -1
Cooper Very poor <35.0 <33.0 <31.5 <30.2 <26.1 <20.5
AHA Very weak <25 <23 <20 <18 <16
UNIFESP Very weak <36 <34 <30 <27
Cooper Poor 35.0–38.3 33.0–36.4 31.5–35.4 30.2–33.5 26.1–30.9 20.5–26.0
AHA Weak 25-33 23–30 20–26 18–24 16–22
Unifesp Weak 36–42 34–38 30–33 27–31
Cooper Regular 38.4–45.1 36.5–42.4 35.5–40.9 33.6–38.9 31.0–35.7 26.1–32.2
AHA Regular 34–42 31–38 27–35 25–33 23–30
Unifesp Regular 43–45 39–41 34–35 32–34
Cooper Good 45.2–50.9 42.5–46.4 41.0–44.9 39.0–43.7 35.8–40.9 32.3–36.4
AHA Good 43–52 39–48 36–44 34–42
Unifesp Good 46–49 42–45 36–39 35–38 31–40
Cooper Excellent 51.0–55.9 46.5–52.4 45.0–49.4 43.8–48.0 41.0–45.3 36.5–44.2
AHA Excellent >53 >49 >45 >43 >41
Unifesp Excellent >49 >45 >39 >38
Cooper Superior >56.0 >52.5 >49.5 >48.1 >45.4 >44.3
measure. In other words, VO2peak variation with age seems to differ only slightly, independently of being performed with or without expired gas analysis.
Another aspect worthy of note was the elevated percentage of disagreement between the CRF levels in the three tables (Table 4). Marins and Giannichi10 have reported that the use of different
CRF classification tables would not interfere significantly in the results of the studies. However, we observed disagreement among the CRF levels of the three tables ranging from 43% to 86% for both sexes and in almost all CRF levels (p < 0.001).
The high disagreement found in our study within the same classification level can be partially explained by the different types of samples used to elaborate the tables. Thus, we investigated the samples used to elaborate the Cooper, AHA and Unifesp tables, and discovered that the Cooper table enrolled individuals from the North-American Air Force19, differing from
this study population, which included individuals with 133 different professions/occupations (not described in this study). It is worth noting that, we have found the description of neither
the method nor the type of sample used to formulate the AHA table. Similarly, the occupation of the individuals assessed to elaborate the Unifesp table has not been described.
The disparities in the classification of this study sample can be justified by the fact that there are great variations among the classification tables (values ranging from 0 to 12 mL.kg-1.min-1)9-11 (Table 1). In addition, when analyzing
the VO2peak values used to establish each CRF level, the following different intervals were noted, hindering a better agreement between the same CRF levels: 3 to 7 mL.kg-1.
min-1 in the Cooper table9; 4 to 10 mL.kg-1.min-1 in the
AHA table10; and 1 to 6 mL.kg-1.min-1 in the Unifesp table11.
Thus, for distributing our sample in the CRF levels, there was no consensus for most individuals classified according to Cooper, AHA and Unifesp. It is worth noting that the Unifesp table, from Brazilian origin, had the highest percentage of classification disparity between individuals.
As in most parts of Brazil, cardiology clinics and services do not routinely use expired gas analysis, but the indirect method, applying either the AHA classification or Cooper’s classification, in addition to Bruce protocol. Thus, we
considered performing this study important, because an individual can be classified differently depending on the table used by the ET examiner. This, by itself, can change the perception of the clinician and/or patient regarding physical fitness, especially for general physicians who are not used to work with ergometry and physical exercises.
The ET has been increasingly indicated for initial assessment or prescription and reprograming of physical exercises to both healthy individuals and those with cardiovascular risk factors, or even severe heart disease. Thus, knowing the existence of those discrepancies among the tables is necessary, justifying the clinical importance of this study.
According to the Brazilian Society of Cardiology III Guideline on Exercise Test, the ET is a procedure in which the individual undergoes a programed and individualized physical exertion, aiming at assessing clinical, hemodynamic, autonomic, electrical, metabolic and eventually ventilatory responses to exercise23. That assessment, according to that guideline, allows
assessing functional capacity and aerobic capacity, prescribing exercise, and showing the patients and their families their actual physical conditions, providing data to attending physicians.
Table 2 - Distribution of the 2,930 individuals studied according to
the presence of cardiovascularrisk factors
Risk factors % (n)
Diabetes 6% (165)
Hypercholesterolemia 27% (805)
Hypertriglyceridemia 19% (561)
Hypertension 40% (1168)
Tobacco use 11% (326)
Alcohol abuse 6% (160)
Sedentary lifestyle 73% (2142)
Stress 76% (2238)
History of CAD 4% (118)
AC greater than recommended* 70% (2063)
CAD – coronary artery disease; AC - abdominal circumference. * For women, AC > 80 cm; for men, AC > 94 cm. Source: Database of the Instituto de Cardiologia de Cruz Alta - RS.
Table 3 - Distribution of the VO2peak (Mean ± SD and percentage variation) of 2,930 individuals according to sex and age group
Sex Age group N (%) M ± SD % Variation Sex N (%) M ± SD % Variation
Women 13 to 19 years 15(8) 31.7 ± 10 Men 13(1) 41.9 ± 9
20 to 29 years 43(2) 32.2 ± 7 +1% 50(4) 39.4 ± 12 -6%
30 to 39 years 178(10) 28.1 ± 8 -13% 161(14) 38.4 ± 9 -3%
40 to 49 years 402(23) 26.5 ± 8 -6% 281(24) 36.0 ± 9 -6%
50 to 59 years 512(29) 24.4 ± 7 -8% 286(25) 31.4 ± 9 -13%
60 to 69 years 348(20) 20.5 ± 7 -16% 219(19) 26.6 ± 9 -15%
70 years or + 267(15) 16.4 ± 7 -20% 155(13) 21.3 ± 8 -20%
Briefly, the variation found among the three CRF classification tables points to the importance of developing classification tables specific for the Brazilian population, considering all ethnical, social and cultural differences16,17,23, in the search for
more careful attention at health care services in Brazil.
Limitations of the study
Although ET with expired gas analysis is considered the reference standard for assessing CRF, and the symptom-limited protocol is currently the most used in research services, in this study, VO2peak was indirectly measured and with only the Bruce
protocol, which was an important limitation23.
However, most cardiology clinics and services use routinely the indirect method for measuring VO2 concomitantly with the
Bruce protocol. Thus, we believe that performing this study is reasonable, especially because, according to the Brazilian Society of Cardiology III Guideline on Exercise Test, the social reality of several municipalities should be considered23.
Finally, based on data collection of other centers in several regions of Brazil also using the indirect VO2 measurement and Bruce protocol, a better overview of CRF of Brazilians could be obtained, according to each regional subtype and closer to the cardiological clinical reality of the country24.
Conclusion
Our findings show discrepancies in the CRF classifications originating from the Cooper, AHA and Unifesp tables. Future studies could investigate whether international tables can be applied to the Brazilian population and populations of different Brazilian regions. National CRF classification tables, contemplating the characteristics of the Brazilian population, should be validated.
Potential Conflict of Interest
No potential conflict of interest relevant to this article was reported.
Sources of Funding
There were no external funding sources for this study.
Study Association
This study is not associated with any post-graduation program.
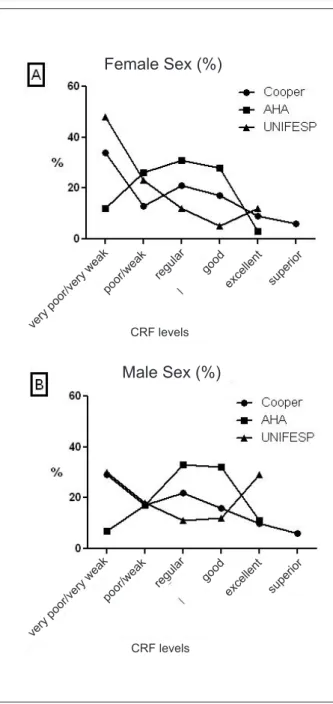
Figure 1 – Levels of CRF of a Brazilian regional sample, distributed as
percentage, according to the Cooper, AHA and Unifesp CRF classiication
tables. A: female sample; B: male sample.
Female Sex (%)
Male Sex (%)
CRF levels
very poor/
very wea
k
poor/ wea
k
regu lar
good exce
llent supe
rior
very poor/
very wea
k
poor/ wea
k
regu lar
good exce
llent supe
rior
Table 4 – Comparison of the number and percentage of individuals of a Brazilian regional sample, allocated to each classiication level of the
AHA, Cooper and Unifesp tables
AHA CRF
Very weak Weak Regular Good Excellent
Total 255 (100%) 553 (100%) 791 (100%) 733 (100%) 148 (100%)
COOPER Very poor 255 (100%) 385 (70%) 44 (6%) 0 0
Poor 0 162 (29%) 212 (27%) 0 0
Regular 0 6 (1%) 450 (57%) 101 (14%) 0
Good 0 0 83 (10%) 354 (48%) 0
Excellent 0 0 2 (1%) 226 (31%) 35 (24%)
Superior 0 0 0 52 (7%) 113 (76%)
AHA CRF
Very weak Weak Regular Good Excellent
Total 178 (100%) 411 (100%) 629 (100%) 564 (100%) 131 (100%)
UNIFESP Very weak 178 (100%) 408 (99%) 198 (31%) 1 (1%) 0
Weak 0 3 (1%) 364 (58%) 36 (6%) 0
Regular 0 0 65 (10%) 151 (27%) 0
Good 0 0 2 (1%) 144 (25%) 0
Very good 0 0 0 233 (41%) 131 (100%)
UNIFESP CRF
Very weak Weak Regular Good Very good
Total 784 (100%) 403 (100%) 216 (100%) 146 (100%) 364 (100%)
COOPER Very poor 498 (63%) 0 0 0 0
Poor 210 (27%) 77 (19%) 0 0 0
Regular 76 (10%) 223 (55%) 70 (32%) 53 (36%) 0
Good 0 103 (26%) 119 (55%) 39 (27%) 77 (21%)
Excellent 0 0 27 (13%) 54 (37%) 146 (40%)
Superior 0 0 0 0 141 (39%)
Database of the Instituto de Cardiologia de Cruz Alta - RS. For all variables p < 0.001.
1. Carnethon MR, Gulati M, Greenland P. Prevalence and cardiovascular disease correlates of low cardiorespiratory fitness in adolescents and adults. JAMA. 2005;294(23):2981-8.
2. LaMonte MJ, Barlow CE, Jurca R, Kampert JB, Church TS, Blair SN. Cardiorespiratory fitness is inversely associated with the incidence of metabolic syndrome: a prospective study of men and women. Circulation. 2005;112(4):505-12.
3. Myers J, Prakash M, Froelicher V, Do D, Partington S, Atwood JE. Exercise capacity and mortality among men referred for exercise testing. N Engl J Med. 2002;346(11):793-801.
4. Sui X, LaMonte MJ, Laditka JN, Hardin JW, Chase N, Hooker SP, et al. Cardiorespiratory fitness and adiposity as mortality predictors in older adults. JAMA. 2007;298(21):2507-16.
5. Arena R, Myers J, Williams MA, Gulati M, Kligfield P, Balady GJ, et al. Assessment of functional capacity in clinical and research settings: a scientific statement from the American Heart Association Committee on Exercise, Rehabilitation, and Prevention of the Council on Clinical Cardiology and the Council on Cardiovascular Nursing. Circulation. 2007;116(3):329-43.
6. American College of Sports Medicine (ACSM). Manual do ACSM para avaliação da aptidão física relacionada à saúde. Rio de Janeiro: Guanabara Koogan SA; 2006.
7. Belli KC, Panigas TF, Dipp T, Bundchen DC, Panigas CF, Richter CM, et al. Analysis of maximal oxygen consumption-VO2 max of a Brazilian specific population [abstract]. Circulation. 2008;117(19):107.
8. Belli KC, Richter CM, Panigas TF, Bundchen DC, Dipp T, Klafke JZ, et al. Anthropometric, metabolic and cardiorespiratory profile of subjects older than 60 years-old in Brazil southern population [abstract]. Circulation. 2008;117(19):211.
9. Powers SK, Howley ET. Fisiologia do exercício: teoria e aplicação ao condicionamento e ao desempenho. 3ª. ed. São Paulo: Editora Manole; 2000. p. 255-64.
10. Marins JCB, Giannichi RS. Avaliação & prescrição de atividade física: guia prático. Rio de Janeiro: Shape; 2003. p. 145-203.
11. Neto TLB, Cesar MC, Tambeiro VL. Avaliação da aptidão física cardiorrespiratória. In: Ghorayeb N, Barros Neto Tl. O exercício: preparação fisiológica – avaliação médica – aspectos especiais e preventivos. São Paulo: Atheneu; 1999. p. 15-24.
12. Sociedade Brasileira de Cardiologia, Sociedade Brasileira de Hipertensão, Sociedade Brasileira de Nefrologia. V Diretrizes brasileiras de hipertensão arterial. Arq Bras Cardiol. 2007;89(3):e24-e79.
13. Cabrera MAS, Jacob Filho W. Obesidade em idosos: prevalência, distribuição e associação com hábitos e co-morbidades. Arq Bras Endocrinol Metab. 2001;45(5):494-501.
14. Stein R, Vilas-Boas F, Galvão F, Nóbrega ACL, Castro RT, Aerdy AH, et al.; Sociedade Brasileira de Cardiologia. Normatização de técnicas e equipamentos para realização de exames em ergometria e ergoespirometria. Arq Bras Cardiol. 2003;80(4):458-64.
15. Vilaró J, Resqueti VR, Fregonezi GAF. Avaliação clínica da capacidade do exercício em pacientes com doença pulmonar obstrutiva crônica. Rev Bras Fisioter. 2008;12(4):249-59.
16. Maranhão Neto GA, Lourenço PM, Farinatti PT. Equações de predição da aptidão cardiorrespiratória sem testes de exercício e sua aplicabilidade em estudos epidemiológicos: uma revisão sistemática. Cad Saúde Pública. 2004;20(1):48-56.
17. Negrão, CE. Aumento da capacidade física de pico está associado à diminuição de mortalidade? Rev Assoc Med Bras. 2002;48(3):184-5.
18. Guedes DP, Guedes JE. Atividade física, aptidão cardiorrespiratória, composição da dieta e fatores de risco predisponentes às doenças cardiovasculares. Arq Bras Cardiol. 2001;77(3):243-57.
19. Cooper KH. Correndo sem medo. Rio de Janeiro: Editorial Nórtica; 1985.
20. Jae SY, Heffernan KS, Fernhall B, Lee MK, Choi YH. Cardiorespiratory fitness is inversely associated with inflammatory and fibrinolytic markers in patients with type 2 diabetes. Circulation. 2007;116 (Suppl II):800.
21. Ades PA, Toth MJ. Accelerated decline of aerobic fitness with healthy aging: what is the good news? Circulation. 2005;112(5):624-6.
22. Weiss EP, Spina RJ, Holloszy JO, Ehsani AA. Gender differences in the decline in aerobic capacity and its physiological determinants during the later decades of life. J Appl Physiol. 2006;101(3):938-44.
23. Meneghelo RS, Araújo CGS, Stein R, Mastrocolla LE, Albuquerque PF, Serra SM, et al / Sociedade Brasileira de Cardiologia. III Diretrizes da Sociedade Brasileira de Cardiologia sobre teste ergométrico. Arq Bras Cardiol. 2010;95(5 supl.1):1-26.