34
AbstractObjective: To evaluate the nutritional status at term of a cohort of newborn babies with birth weights of less than 1,500 g and to correlate this with nutritional practices and clinical variables.
Methods: Very low birth weight infants admitted to eight neonatal intensive care units from November 1999 to April 2000 were studied prospectively. The units were defined as Type I if they employed aggressive nutritional support techniques and Type II if other nutritional practices were used. Babies were defined as malnourished if their z-score for weight was less than or equal to 2 on the Canadian Perinatal Surveillance System growth curves. Data was analyzed using multivariate linear regression and logistic regression. The study was approved by the Committee for Ethics in Research.
Results: Sixty-three percent (126/200) of the study population were classified as being malnourished at term. Weight at term (corrected gestational age) showed a direct correlation with birth weight, but an indirect correlation with the length of stay, gestational age at birth, time to regain birth weight and CRIB score (p < 0.05). Small for gestational age infants had a 12.19 times greater chance of being malnourished at term. Being born at a Type I unit reduced the risk of malnutrition at term by 2.17 times, male sex reduced this risk by 0.4 times and achieving total enteral nutrition by the 10th day of life reduced it by 1.97 times (p < 0.03).
Conclusions: The most effective means of preventing babies being malnourished at term is by encouraging perinatal practices aimed at preventing restricted intrauterine growth, in addition to giving priority to aggressive nutritional management.
J Pediatr (Rio J). 2005;81(1):34-40: Very low birth weight infants, nutritional status.
Evaluation of the nutritional status
at 40 weeks corrected gestational age
in a cohort of very low birth weight infants
Nicole M. Gianini,1 Alan A. Vieira,2 Maria E. L. Moreira3
Copyright © 2005 by Sociedade Brasileira de Pediatria
1. M.Sc. Instituto Fernandes Figueiras/FIOCRUZ, Rio de Janeiro, RJ, Brazil. 2. M.Sc. Instituto Fernandes Figueiras/FIOCRUZ, Rio de Janeiro, RJ, Brazil. 3. Research fellow, Instituto Fernandes Figueiras/FIOCRUZ, Rio de Janeiro,
RJ, Brazil.
Financial support: PAPES III.
Manuscript received Jul 06 2004, accepted for publication Nov 10 2004.
Suggested citation: Gianini NM, Vieira AA, Moreira ME. Evaluation of the nutritional status at 40 weeks corrected gestational age in a cohort of very low birth weight infants. J Pediatr (Rio J). 2005;81:34-40.
Introduction
The idea that the nutrition received during the early stages of life (a period that is critical to the organisms formation and development) can influence or program adult health is being confirmed by more and more clinical and epidemiological studies.1-4
Furthermore, certain nutritional techniques employed during the neonatal period, associated with the characteristics of the newborn babies (NBs) themselves have been, during
O
RIGINALA
RTICLErecent decades, identified as risk factors for increased mortality and morbidity, both during the perinatal period and later. Among these factors, the following stand out: the presence of diseases, late starting on an enteral diet and retarded intrauterine growth.5,6
One means of assessing nutritional status and the quality of care received by NBs is by testing their weight gain. The adequacy of weight gain to corrected gestational age at term, by means of z-score calculation, has been considered by some authors to be an efficient method of evaluating the nutritional status of premature NBs and, in consequence, the nutritional practices applied to them.7
Methodology
A longitudinal study was performed in which all very low birth weight (VLBW) infants admitted to the neonatal intensive care units of eight hospitals in the city of Rio de Janeiro during the period of November 1999 to April 2000 were studied prospectively.
All NBs who did not present severe congenital malformations, chromosomopathies, innate errors of metabolism or congenital infections from the TORCH group (toxoplasmosis, rubella, cytomegalovirus and herpes) were enrolled.
The hospitals included in the study were chosen as being those that exhibited the greatest numbers of births within the defined birth weight range based on data from the Live Births Information System (Sistema de Informação de Nascidos Vivos - SINASC) provided by the Rio de Janeiro Municipal Health Department (Secretaria Municipal de Saúde) Epidemiological Data Directorate (Gerência de Informações Epidemiológicas) in 1999.
Newborns infants weights were obtained from their medical records and had been measured by nurses trained in the use of Filizola® electronic scales accurate to 5 g; gestational age at birth was calculated by Ballards method and adequacy of birth weight to gestational age was assessed with the Lubchenco curve, currently used at the units being studied.8,9
The Clinical Risk Index for Babies (CRIB) was used to calculate the severity of babies clinical status.10
The Canadian Perinatal Surveillance System curves, which are gestational age and sex specific, were used to test for the adequacy of weight to corrected gestational age at term (between 37 and 41 complete weeks) using z-scores.11,12 The weight closest to 40 weeks was recorded, allowing for data collection between 37 and 41 weeks. Malnutrition at term was defined as any z-score less than or equal to -2. Weight at term was obtained from hospital or postnatal clinic medical records.
Depending upon their predominant nutritional practice, the health centers selected for study were classified as type I or II as follows:
I centers at which nutritional support was considered more aggressive, as stipulated in written routine descriptions, of which all duty physicians were aware and which aimed at starting total parenteral nutrition (TPN) within the first 48 hours of life, early start on enteral feeding, the use of mothers milk with additives and weight gain monitoring with a target of 15 g/kg/day after birth weight had been regained.
II centers at which there was no written routine stipulating parameters for starting TPN and enteral feeding, with delayed enteral nutrition, late prescription of TPN and little concern for weight gain and where the practice of mixing additives with human milk was not employed.
The variables analyzed in the study were:
sex;
birth weight;
gestational age at birth;
adequacy of birth weight to gestational age according to the Lubchenco curve;
CRIB;
prenatal corticoid use (at any dose at any time before delivery);
postnatal corticoid use (at any dose at any time after delivery);
duration of mechanical ventilation;
presence of disease, such as: hyaline membrane disease (clinical and radiological diagnosis), sepsis (clinical and laboratorial status confirmed or probable sepsis)13 or necrotizing enterocolitis (clinical and radiological diagnosis);
weight at term by corrected gestational age;
time needed to achieve full enteral nutrition volume (140 ml/kg/day);
time taken to regain birth weight;
type of unit in terms of nutritional practice (I or II);
length of hospital stay.
Initially, sample size was calculated for a prevalence study, assuming a 40% prevalence of malnutrition at term and relative precision of 7%, which returned a sample size of 189 NBs. Assuming that mortality for the age group studied would be 50 %, we enrolled 416 NBs on the study. When we found an elevated prevalence rate we decided to investigate factors associated with this datum. Since sample size was already fixed and data collection complete, we calculated the statistical power for identifying the various risks at a prevalence of 40% and found a test power of 84.2%.
Initially, simple linear regression was used to identify continuous variables with a statistically significant correlation with weight at term according to corrected gestational age. These variables were then assessed by multivariate linear regression to determine which of them influenced nutritional adequacy at term. The stepwise method was used with significance set at 0.05.
In order to test for correlation between categorical variables and malnutrition at term (weight at term less than or equal to a z-score of -2) the binary logistic regression technique was initially employed to identify statistically significant variables. These were then evaluated by logistic regression in order to determine their influence of malnutrition at term according to corrected gestational age.
The Mann-Whitney/Wilcoxon non-parametric test was employed to compare the means of continuous variables and the chi-square test was applied to compare categorical variables, using SPSS 9.0 statistical software.
Results
Data originating from 200 NBs were analyzed because, for 216 of the 416 NBs originally enrolled it proved impossible to obtain weight at term by corrected gestational age. This was the result of death after admission (n = 165) or transfer to a different health center before full term corrected gestational age was reached (n = 39). It was not possible to determine weight at term for 12 NBs (the mean birth weight for this group was not statistically different than for the group analyzed).
The z-score for weight at term was less than or equal to -2 in 127 of the 200 NBs studied, i.e. 63.5% of the study population was classified as malnourished being below the third percentile on the reference curve.11
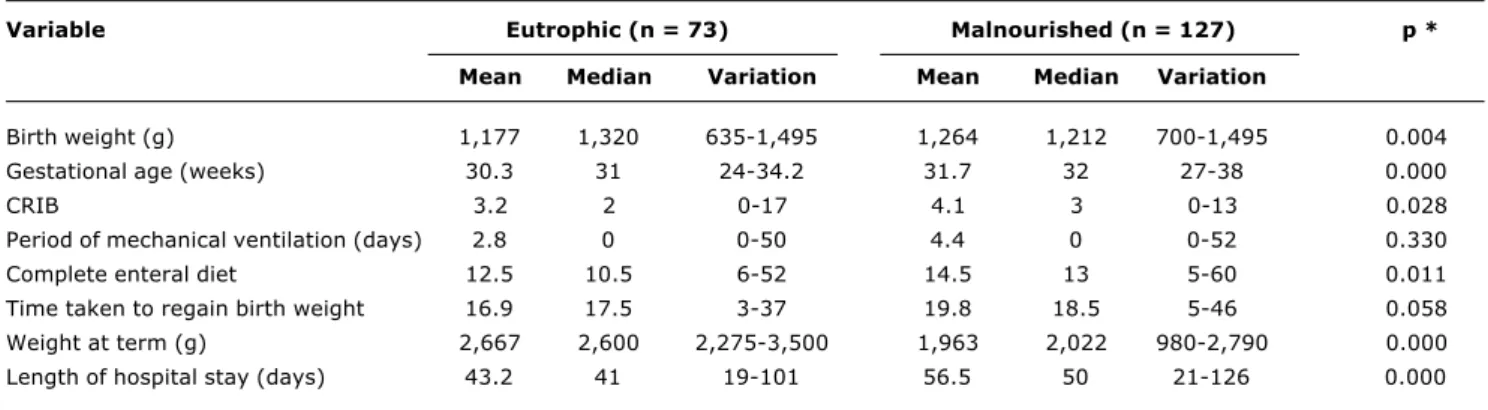
Comparing the two groups malnourished and well-nourished differences were observed in the following variables: birth weight, gestational age at birth, CRIB, time taken to achieve a complete enteral diet and length of hospital stay (p-value < 0.001). The groups were also different with respect of sex, adequacy of birth weight to gestational age and type of health center (I or II). In contrast, the groups exhibited similar means for period of mechanical ventilation and time taken to regain birth weight. The groups are also similar with respect of the presence of diseases (hyaline membrane disease, necrotizing enterocolitis, sepsis) and prenatal and postnatal corticoid use (Tables 1 and 2).
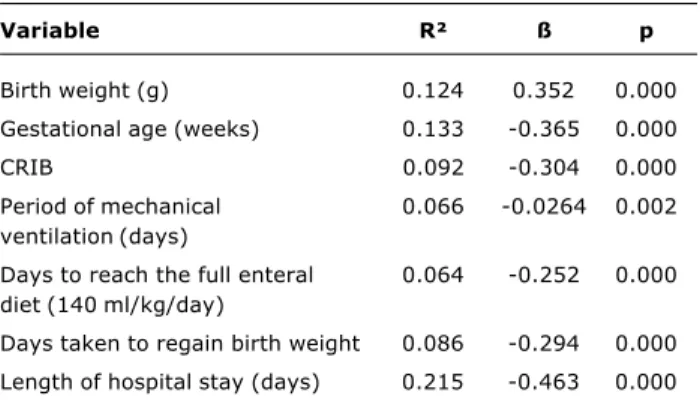
Simple linear regression was used to analyze the correlation between continuous variables and weight at term. Only statistically significant variables were selected for evaluation by multivariate linear regression: birth weight, gestational age at birth, time on mechanical ventilation,
time taken to achieve a full enteral diet and length of hospital stay (Table 3).
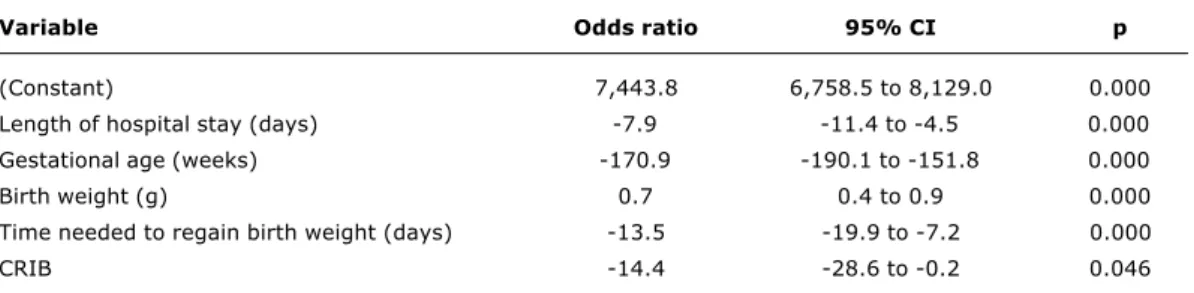
The final model, including the variables: length of hospital stay, gestational age at birth, weight at birth, time needed to regain birth weight and CRIB, exhibited a correlation coefficient of 0.69 when analyzed by multivariate linear regression, in other words it explains 69% of the variation in weight at term of the NBs studied. Period on mechanical ventilation and time taken to achieve a complete enteral diet were excluded from the final model (Table 4).
Weight at term exhibited a positive correlation with birth weight, i.e. the greater the birth weight, the greater weight at term, however, it presented a negative correlation with length of hospital stay, gestational age, time taken to regain birth weight and CRIB.
Weight at full term corrected gestational age can be represented by the following equation:
Weight at term (g) = 7443.8 7.9 x (days in hospital) 170.9 x (gestational age) + 0.7 x (birth weight) 13.5 x (days taken to regain birth weight) 14.4 x (CRIB).
Categorical variables were analyzed by binary logistic regression, taking malnutrition at full term corrected gestational age as the dependent variable (weight at term corresponding to a z-score < -2). Significant variables were: sex - OR: 0.41 (0.22-0.76); adequacy of birth weight/ gestational age OR: 10.25 (3.86-27.17); up to 10 days taken to full diet OR: 1.89 (1.04-3.45) and type of hospital unit OR: 0.20 (0.08-0.47). These were then carried forward to multivariate logistic regression for analysis of a final model to explain malnutrition at full term corrected gestational age.
Table 1 - Comparison of the clinical conditions of newborns with birth weight less than 1,500 g as for nutrition status at term (continuous variables)
CRIB = clinical risk index for babies; complete diet = complete enteral diet (140 ml/kg/day); weight at term = adjusted birthweight range expected at 40 weeks’ gestation.
* Statistical test: Mann-Whitney/Wilcoxon.
Variable Eutrophic (n = 73) Malnourished (n = 127) p *
Mean Median Variation Mean Median Variation
Birth weight (g) 1,177 1,320 635-1,495 1,264 1,212 700-1,495 0.004
Gestational age (weeks) 30.3 31 24-34.2 31.7 32 27-38 0.000
CRIB 3.2 2 0-17 4.1 3 0-13 0.028
Period of mechanical ventilation (days) 2.8 0 0-50 4.4 0 0-52 0.330
Complete enteral diet 12.5 10.5 6-52 14.5 13 5-60 0.011
Time taken to regain birth weight 16.9 17.5 3-37 19.8 18.5 5-46 0.058
Weight at term (g) 2,667 2,600 2,275-3,500 1,963 2,022 980-2,790 0.000
This evaluation made it possible to conclude that a NB who is small for gestational age (SGA) has a 12.19 times greater chance of a weight z-score below -2. Being born at a Type I health center, being male and achieving a full enteral diet in within 10 days postpartum were all protective factors for the NBs studied, i.e. they reduced the risk of malnutrition at term by 2.17, 0.4 and 1.97 times respectively (Table 5).
Discussion
The factors that determine the adequate growth and development of premature NBs remain little known. Despite technological advances making the possibility of survival ever greater for NBs with ever-smaller birth weights over recent decades, their growth remains considerably insufficient, continuing into adult life.7,14
Nowadays there is consensus that preterm NBs should grow in line with intrauterine growth rates, however, the need to develop in an adverse environment - the extrauterine generates a series of susceptibilities which directly influence this populations capacity to grow.15
In the present study the prevalence of malnutrition at term was 63.5%. This elevated prevalence rate allowed us to analyze the factors associated with a test power of 84.2% based on the initial sample. The majority of factors studied exhibited a greatly elevated risk, demonstrating that the study had sufficient statistical power to detect the relevant associations.
In this study birth weight exhibited a positive correlation with nutritional status at full-term corrected age, i.e., the closer that birth weight approached 1,500 g, the better nutritional status was at term. This could be explained by better development conditions since these infants remained longer in the uterus.
Table 2 - Distribution of NB with birth weight less than 1,500 g as for the correction of weight at term (categoric variables)
GA = gestational age; AGA = adequate for gestational age; SGA = small for gestational age; complete diet = enteral diet of 140 ml/kg/day.
Variables Eutrophic Malnourished p
n = 73 n = 127
Gender Male 38 39
Female 35 88 0.002
Hyaline membrane disease Yes 26 42
No 47 85 0.415
Sepsis Yes 4 10
No 69 117 0.371
Necrotizing enterocolitis Yes 1 2
No 72 125 0.699
Adequacy of weight gain/GA SGA 5 56
AGA 68 71 0.000
Prenatal corticoid use Yes 27 32
No 46 95 0.056
Postnatal corticoid use Yes 3 15
No 70 112 0.053
Type of unit Type I 20 9
Type II 53 118 0.000
Complete diet up to 10 days Yes 36 82
No 36 42 0.034
Table 3 - Anlysis of the simple linear regression of continuous variables and weight at term
CRIB = clinical risk index for babies.
Variable R² ß p
Birth weight (g) 0.124 0.352 0.000
Gestational age (weeks) 0.133 -0.365 0.000
CRIB 0.092 -0.304 0.000
Period of mechanical 0.066 -0.0264 0.002
ventilation (days)
Days to reach the full enteral 0.064 -0.252 0.000 diet (140 ml/kg/day)
Days taken to regain birth weight 0.086 -0.294 0.000
The presence of diseases that result in increased metabolic requirements, the liberation of endogenous factors stimulating catabolism and hydroelectrolytic imbalance and the impossibility of using the gastrointestinal tract are considered important determinants of malnutrition in premature NB populations.15
A recent study followed the growth of hospitalized preterm NBs and confirmed the difficulties of maintaining intrauterine growth rates, particularly when diseases such as necrotizing enterocolitis, infection and chronic lung disease were present.14
In the study population there were no differences between malnourished and well-nourished NBs at full-term corrected gestational age with respect of the presence of disease (necrotizing enterocolitis, sepsis and hyaline membrane disease). Nevertheless, CRIB presented a negative correlation with weight at term, i.e. the greater the CRIB score, the lower the weight at full term corrected gestational age.
The absence of uniformity in the nutritional practices aimed at this population is also a factor that determines malnutrition at term. Current research points to the need for more aggressive nutritional policies as a central factor for
Table 4 - Analysis of the multiple linear regression of continuous variables selected for the final model -stepwise method (dependent variable: weight at term)
Variable Odds ratio 95% CI p
(Constant) 7,443.8 6,758.5 to 8,129.0 0.000
Length of hospital stay (days) -7.9 -11.4 to -4.5 0.000
Gestational age (weeks) -170.9 -190.1 to -151.8 0.000
Birth weight (g) 0.7 0.4 to 0.9 0.000
Time needed to regain birth weight (days) -13.5 -19.9 to -7.2 0.000
CRIB -14.4 -28.6 to -0.2 0.046
CRIB = clinical risk index for babies.
Table 5 - Analysis of the multivariate logistic regression of the categoric variables selected (dependent variable: z-score less than -2, i.e., malnourished)
Variable Odds ratio 95% CI p
Small for gestational age 12.19 3.87-31.12 < 0.001
Type I hospital units 2.17 1.02-4.64 0.001
Male sex 0.39 0.20-0.80 0.008
Full enteral diet up to 10 days 1.97 1.08-4.30 0.029
nutritional success in premature NBs, giving priority to earlier use of TPN with higher levels of amino acids (3 g/kg/day) and to enteral diets in small portions (trophic), based on the high level of susceptibility of endogenous protein stocks to a lack of early nutrition in this population.6,14,16-18
At Type I hospital units, where nutritional practices give priority to early TPN and breastmilk from the babies own mothers, the incidence of malnourishment at term was lower than at Type II units (31 versus 69%), explaining the fact that NBs treated at Type I units exhibited a 2.17 times smaller chance of being malnourished at term (Table 5).
Fears of increasing the incidence of necrotizing enterocolitis is the principle explanation for delaying the start of enteral feeding with premature NBs, which also increases the time needed to achieve a full enteral diet. The incidence of necrotizing enterocolitis was low in the study population, even among those who started enteral diets early. A number of different studies corroborate this finding, with no significant correlation between an early enteral diet and the appearance of NEC, as long as daily increases to not pass 30 ml/kg/day.10,18-20
A number of different authors describe greater growth velocity among NBs classed as SGA when their postnatal growth is compared with NBs classed as adequate for gestational age (AGA).6,19,21,22 In this study 49% of AGA and just 5% of SGA reached full term well-nourished being SGA increased the chance of being malnourished at term by 12 times (p < 0.001) (Table 2 and Table 5). Because of the lack of data it was not possible to evaluate the growth velocity of the SGA NBs studied.
The length of hospital stay also exhibited a negative correlation with weight at full term corrected gestational age. The NBs with the largest quantity of complications, the most serious cases and those with the highest CRIB (severity risk score) generally require more time to hospital discharge weight and therefore remain in hospital longer.
With respect of the influence of sex, a number of different studies confirm the superiority of postnatal growth among male NB compared with female NBs, including demonstrating evidence that muscle mass is better incorporated among boys, suggesting that other factors in addition to nutritional practice influence this growth.7,19 In this study we found that the simple fact of being male determined a 0.4 times smaller chance of being malnourished at full term corrected gestational age.
The fact that inadequate nutrition during early periods of human development results in or programs acute or chronic diseases, makes neonatal nutrition an important topic for discussion in the area of public health and social planning politics.5,14,16,23,24
Nutritional strategy has been widely implicated as a factor determining neonatal good practice, generating, in addition to better weight gain, better control of nosocomial infections, and therefore receives great emphasis in strategies to improve perinatal care.25-27
M o n i t o r i n g t h e g r o w t h o f p r e t e r m N B s a n d recommending interventions at neonatal units or in the postnatal follow-up of these children are important strategies to the planning of improved perinatal care in Rio de Janeiro.
The most effective form of preventing malnutrition among preterm NBs and making it possible to reduce diseases during adult life is by encouraging perinatal practices with the objective of reducing and preventing the incidence of restricted intrauterine growth, in addition to prioritizing a more aggressive nutritional approach during their hospital stay (the early introduction of parenteral nutrition and an enteral diet).
References
1. Lucas A. Role of nutritional programming in determining adult morbidity. Arch Dis Child. 1994;71:288-90.
2. Georgieff MK, Mills MM, Lindeke L, Iverson S, Johnson DE, Thompson TR. Changes in nutritional management and outcome of very-low-birth-weight infants. Am J Dis Child. 1989;143:82-5. 3. Barker DJ, Gluckman PD, Godfrey KM. Fetal nutrition and cardiovascular disease in adult life. Lancet. 1993;341:938-41. 4. Novak D. Nutrition in early life. How important is it? Clin Perinat.
2002;29:203-23.
5. Unger A, Goetzman BW, Chan C, Lyons AB, Miller MF. Nutritional practices and outcome of extremely premature infants. Am J Dis Child. 1986;140:1027-33.
6. Ehrenkranz RA, Youns N, Lemons JA, Fanaroff AA, Donovan, EF, Wright LL, et al. Longitudinal growth of hospitalized very low birth weight infants. Pediatrics. 1999;104:280-9.
7. Saigal S, Stoskopf BL, Streiner DL, Burrows E. Physical growth and current health status of infants who were of extremely low birth weight and control at adolescence. Pediatrics. 2001;108:407-15.
8. Ballard JL, Khoury JC, Wedig K, Wang L, Eilers-Walsman BL, Lipp R. New Ballard Score, expanded to include extremely premature infants. J Pediatr. 1991;119:417-23.
9. Lubchenco LO, Hansman C, Dressler M, Boyd E. Intrauterine growth as estimated from live-born birth weight data at 24 to 42 weeks of gestation. Pediatrics. 1963;32:793-800.
10. CRIB Investigators Group. Clinical Risk Index For Babies. Lancet. 1993;342:193-8.
11. Kramer MS, Platt RW, Wen SW, Joseph KS, Allen A, Abrahamowicz M, et al. A new and improved population-based Canadian reference for birth weight for gestational age. Pediatrics [revista eletrônica] 2001 ago [citado 10 de setembro de 2004];108(2):[7p]. Disponível em: www.pediatrics.org/cgi/ content/full/108/2/e35.
12. Cooke RJ, Ainsworth SB, Fenton AC. Postnatal growth retardation: a universal problem in preterm infants. Arch Dis Child. 2004;89:F428-30.
13. Panero A, Pacifico L, Rossi N, Mancuso G, Stegagno M, Chiesa C. Interleukin-6 in neonates with early and late onset infection. Ped Infect Dis J. 1997;16:370-5.
14. Hay WW, Lucas A, Heird WC, Ziegler E, Levin E, Grave GD, et al. Workshop summary: nutrition of the extremely low birth weight infant. Pediatrics. 1999;104:1360-8.
15. Fanaroff AA, Martin RJ. Nutritional and metabolism in the high-risk neonate. Neonatal-perinatal medicine. 6th ed. St Louis, MO: CV Mosby; 1997. p. 562-621.
16. Heird WC. The importance of early nutritional management of low-birthweight infants. Pediatr Rev. 1999;20:e43-4. 17. Newell SJ. Enteral feeding of the micropremie. Clin Perinat.
2000;27:221-34.
18. Thureen PJ, Melara D, Fennessey PY, Hay WW. Effect of low versus high intravenous amino acid intake on very low birth weight infants in the early neonatal period. Pediatr Res. 2003;53:24-32.
19. Cooke RJ, Embleton ND. Feeding issues in preterm infants. Arch Dis Child. 2000;83:F215-8.
20. Gianini NOM. Práticas nutricionais nos recém-nascidos com menos de 1500g [dissertação de mestrado]. Rio de Janeiro (RJ): Instituto Fernandes Figueira. FIOCRUZ; 2001.
21. Uiliani AC, Carvalho R, Barros Filho AA. Evolução ponderal de recém-nascidos de muito baixo peso. J Pediatr (Rio). 1996;72:388-93.
22. Brandt I, Sticker EJ, Lentze MJ. Catch-up growth of head circumference of very low birth weight, small for gestational age preterm infants and mental development to adulthood. J Pediatr. 2003;142:463-8.
23. Embleton NE, Pang N, Cooke RJ. Postnatal malnutrition and growth retardation: an inevitable consequence of current recommendations in preterm infants? Pediatrics. 2001;107: 270-3.
24. Premer DM, Georgieff MK. Nutrition for ill neonates. Pediatr Rev. 1999;20:e56-62.
Corresponding author: Alan Araújo Vieira
Rua Dr. Nilo Peçanha, 43/1001, Ingá CEP 24210-480 Niterói, RJ Brazil
Phone: +55 (21) 2719.3154 Fax: +55 (21) 2613.1229 E-mail: [email protected] 26. Kilbride HW, Powers R, Wirtschafter DD, Sheehan MB, Charsha
DS, LaCorte M, et al. Evaluation and development of potentially better practices to prevent neonatal nosocomial bacteremia. Pediatrics. 2003;111:e504-18.