Diet quality in a sample of adults from
Cuiabá
(MT), Brazil: Association with
sociodemographic factors
Qualidade da dieta de uma amostra de adultos
de Cuiabá (MT)
:
associação com
fatores sociodemográficos
Anarlete da Silva LOUREIRO1
Regina Maria Veras Gonçalves da SILVA2 Paulo Rogério Melo RODRIGUES3 Rosângela Alves PEREIRA3 Loiva Lide WENDPAP2 Márcia Gonçalves FERREIRA2
A B S T R A C T
Objective
To analyze the dietary quality of adults and to identify associated factors.
Methods
Cross-sectional study carried out in a sample of adults (n=195), aged 20-50 years, of both genders, from a population-based study in Cuiabá, Mato Grosso, Brazil. Food consumption data was collected by a food frequency questionnaire. Sociodemographic, lifestyle, anthropometric, and body composition data were also collected. Diet quality was analyzed by the Brazilian Healthy Eating Index-Revised. The associations were estimated by Poisson regression.
Results
The mean Brazilian Healthy Eating Index-Revised score was 75.2 points (CI95%=74.2-76.1), which differed significantly between the genders (p=0.03). Women had higher scores for whole fruit and sodium (p<0.01),
1
Instituto Federal de Educação, Ciência e Tecnologia de Mato Grosso. Campus Cáceres, Av. dos Ramires, s/n., Distrito Industrial, 78200-000, Cáceres, MT, Brasil. Correspondência para/Correspondence to: AS LOUREIRO. E-mail: <[email protected]>.
2
Universidade Federal de Mato Grosso, Faculdade de Nutrição, Departamento de Alimentos e Nutrição. Cuiabá, MT, Brasil.
3
Universidade Federal do Rio de Janeiro, Instituto de Nutrição Josué de Castro, Departamento de Nutrição Social e Aplicada. Rio de Janeiro, RJ, Brasil.
while men had higher scores for oils, nuts, and fish fat (p=0.02). Individuals aged ≥30 years had higher total Brazilian Healthy Eating Index-Revised score and higher scores for the groups whole fruit; saturated fat; and calories from solid fats, alcoholic beverages, and added sugar (p<0.01). The Poisson regression between high Brazilian Healthy Eating Index-Revised and the independent variables showed that high Brazilian Healthy Eating Index-Revised was associated with being female, being aged 30 years or more, and being from families whose household head had 8 or more years of formal education.
Conclusion
The factors associated with high Brazilian Healthy Eating Index-Revised were age, gender, and education level of the household head.
Indexing terms: Adult. Diet. Food consumption.
R E S U M O
Objetivo
Analisar a qualidade da dieta e identificar fatores associados em adultos residentes na área urbana de Cuiabá, Mato Grosso, Brasil.
Métodos
Estudo transversal com amostra de 195 adultos de 20 a 50 anos, de ambos os sexos, extraída de estudo de base populacional. A ingestão alimentar foi avaliada por questionário de frequência de consumo alimentar. Foram coletados dados sociodemográficos, de estilo de vida, antropométricos e de composição corporal. A qualidade da dieta foi analisada pelo Índice de Qualidade da Dieta Revisado. As associações foram estimadas por meio da regressão de Poisson.
Resultados
A média do Índice de Qualidade da Dieta Revisado foi de 75,2 pontos (IC95%: 74,2-76,1), com diferença estatisticamente significativa entre os sexos (p=0,03). As mulheres obtiveram melhor pontuação para frutas inteiras e sódio (p<0,01), enquanto os homens obtiveram maiores escores para óleos, oleaginosas e gordura de peixe (p=0,02). Indivíduos com idade igual ou superior a 30 anos obtiveram maior pontuação para o Índice de Qualidade da Dieta Revisado total, fruta inteira, gordura saturada e calorias provenientes de gordura sólida, álcool e açúcar de adição (p<0,01). A regressão de Poisson entre o Índice de Qualidade da Dieta Revisado elevado e variáveis independentes mostrou associação para mulheres, para indivíduos com 30 anos ou mais e para aqueles cujo chefe da família apresentava maior escolaridade.
Conclusão
Os fatores que se mostraram associados ao Índice de Qualidade da Dieta Revisado elevado foram a idade, o sexo e a escolaridade do chefe da família.
Termos de indexação: Adulto. Dieta. Consumo alimentar.
I N T R O D U C T I O N
In the last decades in Brazil, changes in lifestyle, economic, social, and demographic conditions promoted changes in diet and level of physical activity that affected people’s health negatively. These changes are associated with the growing prevalence of obesity and Chronic
Non-Communicable Diseases (NCD)1,2.
The need of understanding the association between diet and NCD led to the development
and continuous improvement of dietary indices. In Brazil, Previdelli et al.3, used the Brazilian Food
Guide4 to propose the Brazilian Healthy Eating
Index-Revised (BHEI-R), which resulted in the adaptation of the North American Healthy Eating Index (HEI) to the Brazilian Population5.
Like the Healthy Eating Index5 revised in
their association with socioeconomic, demographic, anthropometric, and lifestyle components; and health-related outcomes.
The Brazilian Healthy Eating Index-Revised3
estimates dietary adequacy and detects changes in dietary patterns; it considers the recommendations for a healthy diet taking into account the Brazilian dietary characteristics and allows the dietary assessment and monitoring of individuals and populations. This index classifies individuals into dietary categories by grouping them into similar segments. The purpose is to investigate possible associations with other factors and to identify population groups that are at risk of consuming a diet inadequate in a given nutrient or food group.
The objective of this study was to analyze the dietary quality of adults living in the urban region of Cuiabá (MT), Brazil and identify possible associated factors using the BHEI-R adapted for the Brazilian population.
M E T H O D S
Study design and population
This cross-sectional study included 195 adults of both genders aged 20 to 50 years from
the urban area of Cuiabá (MT)6. A secondary
analysis was done of their food intake data, collected by a Food Frequency Questionnaire (FFQ). The sample size was calculated as recommended by Willett et al.7.
The study participants were selected from a sample of participants of a population-based study that investigated the prevalence of hypertension in the city of Cuiabá (MT), in
2003-20048. The present study used cluster sampling
in three phases. Stratification was proportional to the density of each urban region of Cuiabá (MT). More details about the sampling method can be found elsewhere8.
Data were collected from July to September 2007 through personal interviews and
anthropometric assessments done at the participants’ homes.
Measurement procedures
The participants’ race/skin color was self-reported and classified as recommended by the
Instituto Brasileiro de Geografia e Estatística9
(IBGE, Brazilian Institute of Geography and Statistics). Age was recorded in years. The individual’s and household head’s education levels
were also classified as recommended by IBGE10.
The socioeconomic level was categorized as recommended by the Associação Brasileira de
Empresas de Pesquisa11 (ABEP, Brazilian
Association of Survey Companies).
The participants were also classified as active or inactive depending on how much leisure physical activity they had practiced weekly in the month that preceded the interview; other classifications included smoking status (smokers, nonsmokers, or ex-smokers); and consumption of alcoholic beverages based on their consumption in the two weeks that preceded the interview (consumers, non-consumers). More details on their lifestyle-related variables are available elsewhere12
.
Anthropometric and body composition assessments
Weight; height; and waist, and hip circumferences were measured as recommended by the literature13,14. Weight was determined by
Waist-to-Hip Ratio (WHR) were categorized according to the cut-off points recommended by the World Health Organization15. Percentage of body fat was
categorized according to the cut-off points proposed by Gibson16.
Food consumption
Habitual food intake data were collected by a semiquantitative FFQ. The said FFQ contained 81 food items divided into food groups. Three standard serving sizes and eight intake frequency options, from three times per day to rarely or never, were available for each item. This study investigated 75 food items, leaving out those whose main components had already been reflected by other items.
The intake frequencies reported in the FFQ were converted into daily frequencies and a value of 1.0 was attributed to a once-daily consumption. Proportional values were used for the other frequency options. The mean daily intake of each food item was calculated by multiplying the daily frequency by the amount consumed.
The energy and nutrient contents of the
diet were determined by the software Nutwin17,
which uses the United States Department of Agriculture (USDA) food composition table. The food groups were grouped according to the
groups in the Brazilian Food Guide4. The
preparations that contained more than one food group, such as sandwiches, pizzas, stuffed pasta, and other mixtures, were divided into their individual components, which were then classified in the corresponding groups. The nutrients and dietary information of foods that were not found in the program’s database were collected from
the Nutrition Data System for Research (NDSR)18
and from the Tabela Brasileira de Composição de Alimentos (TACO, Brazilian Food Composition Table)19.
Diet quality assessment
The Brazilian Healthy Eating Index-Revised3
was used for assessing diet quality. Originally, this
index consisted of points given to twelve components that characterize different dietary aspects: nine components are food groups; two are nutrients (sodium and saturated fat); and one is the energy percentage of the diet coming from Solid Fats, Alcoholic beverages, and Added Sugar (SoFAAS). The score attributed to the food group components included the number of servings
recommended by the Brazilian Food Guide4 for a
2,000kcal diet.
The item “Whole Grains” in the BHEI-R was not used in the present study because the study FFQ does not distinguish between grain types. Therefore, 10 points were attributed to three 1,000kcal grain servings as a criterion for the maximum score in the item “Total Grains”. Hence, the BHEI-R in this study consists of points stemming from eleven components.
The total Brazilian Healthy Eating Index-Revised score is 100 points. High scores indicate that the diet is close to ideal, while low scores indicate that the diet is far from ideal.
Statistical analysis
The total and component Brazilian Healthy Eating Index-Revised scores were analyzed as continuous variables. Additionally, the total scores were categorized into quartiles. The continuous variables were expressed as means, standard deviation, and 95% Confidence Interval (95%CI) and the categorical variables as proportion (%) and respective 95%CI. The Kolmogorov-Smirnov test was used for determining the distribution symmetry of the continuous variables. The nonparametric variable means were compared by the Mann-Whitney test (p<0.05).
waist circumference) and the response variable (high BHEI-R). The variables with p value ≤0.20 in the bivariate analysis were included in the Poisson regression. The significance level was set at 5% (p≤0.05).
Brazilian Healthy Eating Index-Revised scores above the third quartile were considered high. The independent variables were included simultaneously in the Poisson regression model.
Ethical aspects
The research project was approved by the Research Ethics Committee of the University Hospital Júlio Muller under protocol number nº 234/CEP-HUJM/05, on December 3, 2008. All participants signed a Free and Informed Consent form before they entered the study, as
recommended by Resolution 196/9620 of the
National Health Council.
R E S U L T S
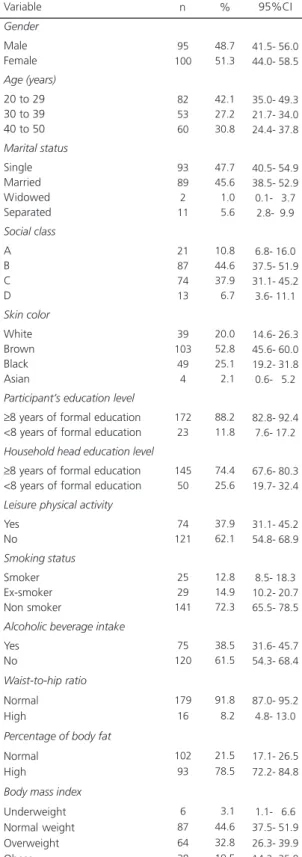
A total of 195 adults were assessed; of these, 51% were females, 58% were aged 30 years or more, 80% were not Caucasians, 55% were from the social classes A and B, 54% were single, 74% were from household whose head had more than 8 years of formal education, and 52% were overweight or obese (Table 1).
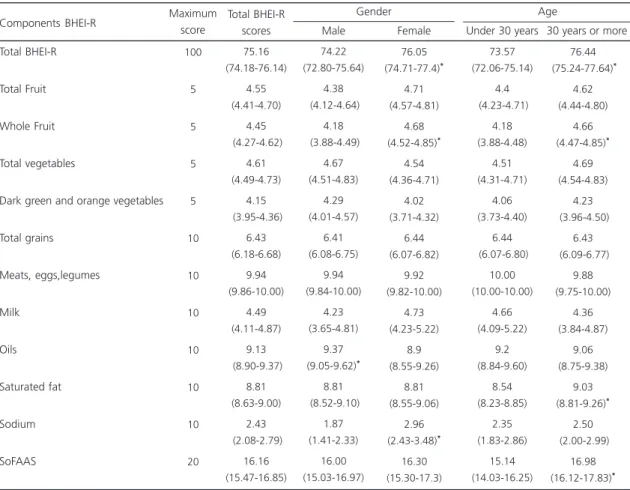
The mean Brazilian Healthy Eating Index-Revised score was 75.2 points (95%CI=74.2-76.1), and the mean scores of women and men differed significantly (76.1 and 74.2; p=0.03). Table 2 shows that men obtained higher scores for the food groups oils, nuts, and
fish oil (9.4 and 8.9; p=0.02), while women
obtained higher scores for whole fruits (4.7 and 4.2; p<0.01) and sodium (2.9 and 1.9; p<0.01).
Table 2 shows that the participants aged 30 or older had higher total BHEI-R scores (76.4 and 73,6; p<0.01), and they had higher scores for the components whole fruit (4.7 and 4.2; p<0.01), saturated fat (9.0 and 8.5; p<0.01); and
Table 1. Characterization of the sociodemographic, lifestyle, weight, and body composition data of a sample of adults from Cuiabá (MT), Brazil, 2007.
Gender
Male Female
Age (years)
20 to 29 30 to 39 40 to 50
Marital status Single Married Widowed Separated Social class A B C D Skin color White Brown Black Asian
Participant’s education level
≥8 years of formal education <8 years of formal education
Household head education level
≥8 years of formal education <8 years of formal education
Leisure physical activity
Yes No Smoking status Smoker Ex-smoker Non smoker
Alcoholic beverage intake
Yes No
Waist-to-hip ratio
Normal High
Percentage of body fat
Normal High
Body mass index
Underweight Normal weight Overweight Obese Variable
Note: 95%CI: 95% Confidence Interval. 95 100 82 53 60 93 89 2 11 21 87 74 13 39 103 49 4 172 23 145 50 74 121 25 29 141 75 120 179 16 102 93 6 87 64 38 n 48.7 51.3 42.1 27.2 30.8 47.7 45.6 01.0 05.6 10.8 44.6 37.9 06.7 20.0 52.8 25.1 02.1 88.2 11.8 74.4 25.6 37.9 62.1 12.8 14.9 72.3 38.5 61.5 91.8 08.2 21.5 78.5 03.1 44.6 32.8 19.5 41.5- 56.0 44.0- 58.5 35.0- 49.3 21.7- 34.0 24.4- 37.8 40.5- 54.9 38.5- 52.9 0.1- 3.7
2.8- 9.9
6.8- 16.0 37.5- 51.9 31.1- 45.2 3.6- 11.1 14.6- 26.3 45.6- 60.0 19.2- 31.8 0.6- 5.2
82.8- 92.4 7.6- 17.2 67.6- 80.3 19.7- 32.4 31.1- 45.2 54.8- 68.9 8.5- 18.3 10.2- 20.7 65.5- 78.5 31.6- 45.7 54.3- 68.4 87.0- 95.2 4.8- 13.0 17.1- 26.5 72.2- 84.8
1.1- 6.6 37.5- 51.9 26.3- 39.9 14.2- 25.8
calories from solid fats, alcoholic beverages and added sugar (17.0 and 15.1; p<0.01).
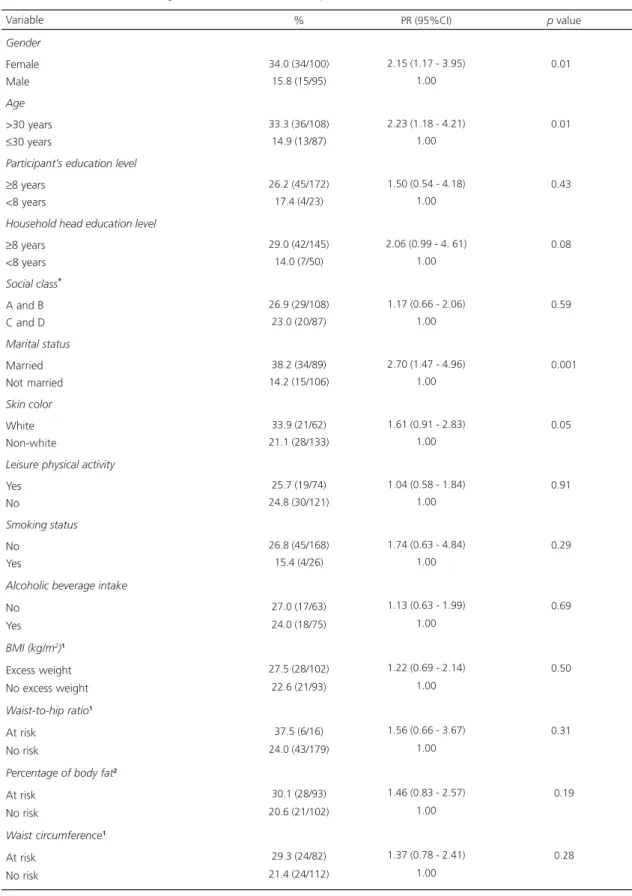
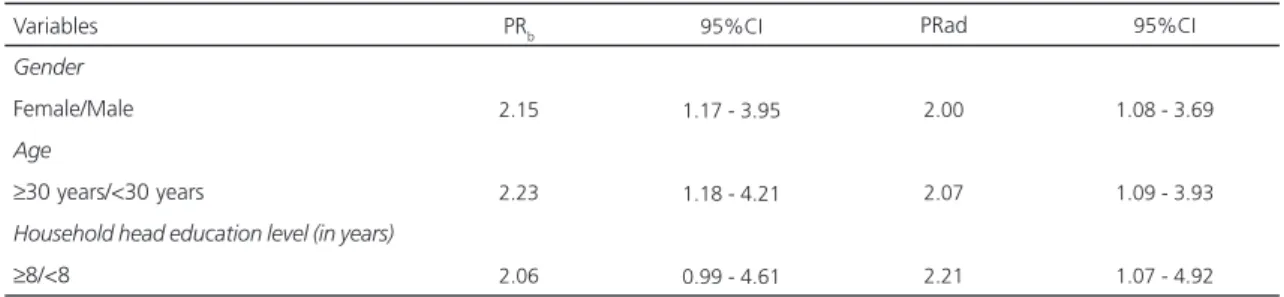
Table 3 analyzes the association between explanatory variables and the response variable (high BHEI-R) given by the crude Prevalence Ratio (PR) and its respective 95%CI. Women were more likely to have higher BHEI-R scores than men (PR=2.15; 95%CI=1.17-3.95). Likewise, higher scores of BHEI-R were seen in older individuals (PR=2.23; 95%CI=1.18-4.21), married individuals (PR=2.70; 95%CI=1.47-4.96), individuals whose household head had at least 8 years of formal education (PR=2.06; 95%CI=0.99-4.61), and Caucasians (PR=1.61; 95%CI=0.95-2.83).
Poisson regression between high BHEI-R and the independent variables showed that only
the sociodemographic variables were associated with high BHEI-R scores. Women were twice as likely to have a high BHEI-R (Oddes Ratio-OR=2.00; 95%CI=1.08-3.69). Other factors
associated with high BHEI-R were age ≥30 years
(OR=2.07; 95%CI=1.09-3.93) and belonging to a household whose head had 8 years or more of formal education (OR=2.21; 95%CI=1.07-4.92), regardless of other factors (Table 4).
D I S C U S S I O N
In the sample of adults evaluated in Cuiabá (MT) the participants with better diets were women, individuals aged 30 years or more, and individuals whose household heads had at least
Table 2. Mean and 95% confidence interval of the Brazilian Healthy Eating Index - Revised (BHEI-R) and its components according to gender and age in a sample of adults from Cuiabá (MT), Brazil, 2007.
Total BHEI-R
Total Fruit
Whole Fruit
Total vegetables
Dark green and orange vegetables
Total grains Meats, eggs,legumes Milk Oils Saturated fat Sodium SoFAAS 100 5 5 5 5 10 10 10 10 10 10 20 75.16 (74.18-76.14) 4.55 (4.41-4.70) 4.45 (4.27-4.62) 4.61 (4.49-4.73) 4.15 (3.95-4.36) 6.43 (6.18-6.68) 9.94 (9.86-10.00) 4.49 (4.11-4.87) 9.13 (8.90-9.37) 8.81 (8.63-9.00) 2.43 (2.08-2.79) 16.16 (15.47-16.85) 74.22 (72.80-75.64) 4.38 (4.12-4.64) 4.18 (3.88-4.49) 4.67 (4.51-4.83) 4.29 (4.01-4.57) 6.41 (6.08-6.75) 9.94 (9.84-10.00) 4.23 (3.65-4.81) 9.37 (9.05-9.62)* 8.81 (8.52-9.10) 1.87 (1.41-2.33) 16.00 (15.03-16.97)
Components BHEI-R Maximum
score Total BHEI-R scores 76.05 (74.71-77.4)* 4.71 (4.57-4.81) 4.68 (4.52-4.85)* 4.54 (4.36-4.71) 4.02 (3.71-4.32) 6.44 (6.07-6.82) 9.92 (9.82-10.00) 4.73 (4.23-5.22) 8.9 (8.55-9.26) 8.81 (8.55-9.06) 2.96 (2.43-3.48)* 16.30 (15.30-17.3) Male Female Gender
Under 30 years 30 years or more Age 73.57 (72.06-75.14) 4.4 (4.23-4.71) 4.18 (3.88-4.48) 4.51 (4.31-4.71) 4.06 (3.73-4.40) 6.44 (6.07-6.80) 10.00 (10.00-10.00) 4.66 (4.09-5.22) 9.2 (8.84-9.60) 8.54 (8.23-8.85) 2.35 (1.83-2.86) 15.14 (14.03-16.25) 76.44 (75.24-77.64)* 4.62 (4.44-4.80) 4.66 (4.47-4.85)* 4.69 (4.54-4.83) 4.23 (3.96-4.50) 6.43 (6.09-6.77) 9.88 (9.75-10.00) 4.36 (3.84-4.87) 9.06 (8.75-9.38) 9.03 (8.81-9.26)* 2.50 (2.00-2.99) 16.98 (16.12-17.83)*
Table 3. Prevalence of high Brazilian Healthy Eating Index-Revised (BHEI-R) score (%), Prevalence Ratio (PR), and 95% Confidence Interval (95%CI), according to the characteristics of a sample of adults from Cuiabá (MT), Brazil, 2007.
Gender
Female Male
Age
>30 years
≤30 years
Participant’s education level
≥8 years <8 years
Household head education level
≥8 years <8 years
Social class*
A and B C and D
Marital status
Married Not married
Skin color
White Non-white
Leisure physical activity
Yes No
Smoking status
No Yes
Alcoholic beverage intake
No Yes
BMI (kg/m2)1 Excess weight No excess weight
Waist-to-hip ratio1
At risk No risk
Percentage of body fat2 At risk
No risk
Waist circumference1 At risk
No risk Variable
34.0 (34/100) 15.8 (15/95)
33.3 (36/108) 14.9 (13/87)
26.2 (45/172) 17.4 (4/23)
29.0 (42/145) 14.0 (7/50)
26.9 (29/108) 23.0 (20/87)
38.2 (34/89) 14.2 (15/106)
33.9 (21/62) 21.1 (28/133)
25.7 (19/74) 24.8 (30/121)
26.8 (45/168) 15.4 (4/26)
27.0 (17/63) 24.0 (18/75)
27.5 (28/102) 22.6 (21/93)
37.5 (6/16) 24.0 (43/179)
30.1 (28/93) 20.6 (21/102)
29.3 (24/82) 21.4 (24/112)
%
2.15 (1.17 - 3.95) 1.00
2.23 (1.18 - 4.21) 1.00
1.50 (0.54 - 4.18) 1.00
2.06 (0.99 - 4. 61) 1.00
1.17 (0.66 - 2.06) 1.00
2.70 (1.47 - 4.96) 1.00
1.61 (0.91 - 2.83) 1.00
1.04 (0.58 - 1.84) 1.00
1.74 (0.63 - 4.84) 1.00
1.13 (0.63 - 1.99) 1.00
1.22 (0.69 - 2.14) 1.00
1.56 (0.66 - 3.67) 1.00
1.46 (0.83 - 2.57) 1.00
1.37 (0.78 - 2.41) 1.00 PR (95%CI)
0.010
0.010
0.430
0.080
0.590
0.001
0.050
0.910
0.290
0.690
0.500
0.310
0.19
0.28
p value
Note: *Economic classification according to the Brazilian Association of Survey Companies (ABEP)11; 1World Health Organization cut-off points15;
8 years of formal education. Analysis of the BHEI-R components shows that the consumption of fruits and non-starchy vegetables was close to the recommended intakes, but the consumption of sodium was high, and the consumption of milk and dairy products was low.
There are no other Brazilian studies that use the BHEI-R in adults. However, comparison of studies that use the HEI-2005 and BHEI-R is possible because the two indices are similar.
Results similar to those of the present study were found by other studies done in Brazil and elsewhere, that is, different HEI scores between genders, age groups, and education level of the
household head21,22. Gender, age group, and
education level are determinants of food habits since they influence an individual’s decision to adopt protective or risk behaviors concordant with the cultural standards of his group. People become more health aware as they age, which may have a positive influence on diet quality, contributing to better food choices. Regarding education level, the observed association may be explained by the relationship between low education level and low income, and by lower access to nutrition information23,24.
The use of a Food Frequency Questionaire for collecting dietary data may have affected the scores of some BHEI-R components because the main limitations of this method are its predefined food list and its dependence on the participants’
understanding and memory25. However, the FFQ
reflects the usual intake, which minimizes
intraindividual variability, contrary to the 24-hour Recall (R24h) or the food record.
The mean Brazilian Healthy Eating Index-Revised scores found by the present study, 74.2 for men and 76.1 for women, was greater than those found for North American adults, which varied from 52.6 to 65.4 points26,27. In a study
conducted by Pires28 with 204 individuals from
both genders and aged 18 to 79 years participating in a population-based study in the municipality of São Paulo, the mean BHEI-R was 64.0 points for men and 65.4 points for women. The mean BHEI-R scores found by the present study may have been overestimated because of the method used for collecting dietary data. According to the literature, the mean HEI score tends to be overestimated when the FFQ is used, contrary to the R 24h29.
In the present study, the mean score of the group meats, eggs, and legumes was close to 10 points for both genders. Similar results were
seen in adults from São Paulo(SP)28. The
consumption of meats in Brazil has been increasing according to the food acquisition per household data published by the Pesquisa de
Orçamento Familiar (POF, Family Budget Surveys)30
that show that between 2002/2003 and 2008/ 2009, the percentage of household expenditure on meats, including organ meats and fish, increased from 18.3% to 21.9% of the total food expenditures. The trend of high meat, eggs and legumes consumption has also been observed abroad26. Another factor that may justify the high
scores for this group is the fact that HEI-2005
Table 4. Crude (PRb) and adjusted (PRad) Prevalence Ratios and 95% Confidence Interval (95%CI) between the Brazilian Healthy Eating Index-Revised (BHEI-R) and associated factors. Cuiabá (MT), Brazil, 2007.
Gender
Female/Male
Age
≥30 years/<30 years
Household head education level (in years)
≥8/<8 Variables
2.15
2.23
2.06
1.17 - 3.95
1.18 - 4.21
0.99 - 4.61
2.00
2.07
2.21
PRb 95%CI PRad
1.08 - 3.69
1.09 - 3.93
and BHEI-R add legumes to the groups of meats and eggs, resulting in an overestimation of protein intake.
The intake of whole fruits, total fruits, total vegetables, dark green and orange vegetables and legumes was high, contrary to literature data26-28.
It is possible that the use of a FFQ to collect dietary data contributed to the overestimated consumption of these items. Data from POF 2008/ 200930 show that less than 10.0% of the Brazilian
population reaches the recommended intakes for fruits and non-starchy vegetables. Data from
Vigitel31 show that the frequency of regular
consumption of fruit and non-starchy vegetables was 29.9% of the adult population, being lower in men (24.7%) than in women (34.4). The study also shows that the consumption of fruits and non-starchy vegetables of both genders increase with age and education level.
The estimated scores for the group milk and dairy products in this study (4.49) were comparable to the results obtained by a study in another country32. In Brazil, Morimoto et al.21
found a score of 2.9 for the group milk and dairy products. The Inquérito Nacional de Alimentação
(INA, National Food Survey) done in 2008/200930
evidenced that the consumption of milk and dairy among Brazilian adults is much lower than ideal, which means a high prevalence of inadequate vitamin and calcium intakes.
Determining sodium intake is challenging because it is hard to measure the amount of sodium added to foods, so the reported intake is inaccurate. Sodium intake was high in this study; both genders had a low score, especially males. These scores are lower than the mean scores found by other studies done in Brazil and abroad26,28,33. According to the POF 2008-200930
data, 88.7% of men and 69.7% of women aged 19 to 59 years consumed too much sodium daily (>2300mg/day), and most of the sodium came from processed foods.
Many studies associate high sodium intake with the development of chronic diseases and indicate that if individuals aged 25 to 55 years
reduced their daily sodium intake by 1300mg, their systolic blood pressure would drop by 5mmHg and the prevalence of high blood pressure would drop by 20.0%. Low sodium intake could also reduce stroke (14.0%) and
coronary artery (9.0%) mortalities worldwide34.
The population-based sample that gave rise to this study sample had a high prevalence of high blood pressure (28.3%), and the prevalence was higher in males (33.5%) than in females (23.5%)8.
One of the limitations of the present study is its cross-sectional design because it is not possible to infer relationships of causality. However, it is possible to explore the factors associated with diet quality. Another limitation is the possible low FFQ accuracy, not only because its number of food items is limited, but also because it usually overestimates food intake, which is also influenced by recall bias.
On the other hand, a positive aspect of the study was the way the sample was selected, since the selection was based on a population-based study, which contributed to its internal validity. This study is original in this region, and its results show that the diet quality of the participants is not ideal, especially with respect to sodium intake. Therefore, monitoring and surveillance are necessary, given the high prevalence of high blood pressure in the study municipality.
C O N C L U S I O N
C O N T R I B U T O R S
AS LOUREIRO performed the study, statistical analysis, and data interpretation; and wrote the manuscript. RMVG SILVA analyzed and interpreted the results. PRM RODRIGUES analyzed and interpreted the results. RA PEREIRA analyzed and interpreted the results; and wrote the manuscript. LL WENDPAP analyzed and interpreted the results. MG FERREIRA designed and supervised the study, performed the statistical analysis, interpreted the data, and wrote the manuscript.
R E F E R E N C E S
1. Batista Filho M, Rissin A. A transição nutricional no Brasil: tendências regionais e temporais. Cad Saúde Pública. 2003; 19(1):S181-S91. doi: 10.1590/S010 2-311X2003000700019.
2. Kac G, Velásquez-Meléndez G. A transição nutri-cional e a epidemiologia da obesidade na América Latina. Cad Saúde Pública. 2003; 19(1):S4-S5. doi: 10.1590/S0102-311X2003000700001.
3. Previdelli NA, Andrade SC, Pires MM, Ferreira SRG, Fisberg RM, Marchioni DM. Índice de Qualidade da Dieta Revisado para população brasileira. Rev Saúde Pública. 2011; 45(4):794-8. doi: 10.1590/S 0034-89102011005000035.
4. Brasil. Ministério da Saúde. Secretaria de Atenção a Saúde. Guia alimentar para a população brasileira: promovendo a alimentação saudável. Brasília: MS; 2006.
5. Guenther PA, Reedy J, Krebs-Smith SM. Development of the Healthy Eating Index - 2005. J Am Diet Assoc.2008; 108:1896-901. doi: 10.1016/ j.jada.2008.08.016.
6. Ferreira MG, Silva NF, Schmidt FD, Silva RMVG, Sichieri R, Guimarães LV, et al. Development of a Food Frequency Questionnaire for adults in a population-based sample in Cuiabá, Mid-Western Region of Brazil. Rev Bras Epidemiol. 2010; 13(3):1-11. doi: 10.1590/S1415-790X2010000300005. 7. Willett W. Nutritional epidemiology. 2th ed. Oxford:
Oxford University Press; 1998.
8. Barbosa LS, Scala LCN, Ferreira MG. Associação entre marcadores antropométricos de adiposidade corporal e hipertensão arterial na população adulta de Cuiabá, Mato Grosso. Rev Bras Epidemiol. 2009; 12(2):237-47. doi: 10.1590/S1415-790X200900 0200013.
9. Instituto Brasileiro de Geografia e Estatística. Síntese de indicadores sociais. Brasília: IBGE; 2004 [acesso
2011 maio 13]. Disponível em: <http://www.sepm. gov.br/nucleo/dados/pnad_cor_2004>.
10. Instituto Brasileiro de Geografia e Estatística. Censo demográfico do Brasil. Brasília: IBGE; 2000 [acesso 2011 maio 11]. Disponível em: <http://www.ibge. gov.br>.
11. Associação Brasileira de Empresas de Pesquisa. Critério de classificação econômica Brasil. São Paulo: ABEP; 2008 [acesso 2011 maio 11]. Dispo-nível em <http://www.abep.org/novo/content. aspx?contentID=302>.
12. Ferreira MG, Valente JG, Gonçalves-Silva RMV, Sichieri R. Alcohol consumption and abdominal fat in blood donors. Rev Saúde Pública. 2008; 42(6):1-6. doi: 10.1590/S0034-89102008000600013. 13. Gordon CC, Chumlea WC, Roche AF. Stature,
recumbent length, weight. In: TG Lohman, AF Roche, R Martorell (Eds.). Anthropometric standardizing reference manual. Champaign, Illinois: Human Kinetics Books; 1988.
14. Callaway CW, Chumlea WC, Bouchard C, Himes JH, Lohman TG, Martin AD, et al. Circumferences. In: TG Lohman, AF Roche, R Martorell. Anthropometric standardization reference manual. Champaign, Illinois: Human Kinetics Books; 1988. 15. World Health Organization. Obesity: Preventing and managing the global epidemic. Geneva: WHO; 1998. WHO Technical Report Series, 894. 16. Gibson RS.Principles of nutritional assessment. 2th
ed. New York: Oxford University Press; 2005. 17. Universidade Federal de São Paulo. Programa de
apoio à nutrição: NutWin. São Paulo: Unifesp; 2005.
18. Programa Nutrition Data System for Research. Version 2008. Minnesota: University of Minnesota; 2008.
19. Núcleo de Estudos e Pesquisas em Alimentação. Tabela Brasileira de Composição de Alimentos -TACO. 2ª ed. Campinas: Unicamp; 2006. 20. Brasil. Conselho Nacional de Saúde. Resolução CNS
nº 196, de 10 de outubro de 1996. Dispõe sobre as diretrizes e normas regulamentadoras de pes-quisas envolvendo seres humanos. Brasília: CNS; 2010.
21. Morimoto JM, Latorre MRDO, César CLG, Caran-dina L, Barros MBA, Goldbaum M, et al. Fatores associados à qualidade da dieta de adultos residentes na Região Metropolitana de São Paulo, Brasil, 2002. Cad Saúde Pública. 2008; 24(1):169-78. doi: 10.1590/S0102-311X2008000100017. 22. Raffensperger S, Kuczmarski MF, Hotchkiss L,
quality in the HANDLS study sample. J Am Diet Assoc. 2010; 102(10):923-30.
23. Monteiro CA, Conde WL, Castro IRR. A tendência cambiante da relação entre escolaridade e risco de obesidade no Brasil (1975-1997). Cad Saúde Publica. 2003; 19(1):67-75. doi: 10.1590/S0102-3 11X2003000700008.
24. Vieira ACR, Sichieri R. Associação do status socioeconômico com obesidade. Physis Rev Saúde Coletiva. 2008; 18(3):415-26. doi: 10.1590/S0103-73312008000300003.
25. Pereira RA, Sichieri R. Métodos de avaliação do consumo de alimentos. In: Kac G, Sichieri R, Gigante DP, organizadores. Epidemiologia nutricional. Rio de Janeiro: Fiocruz; 2007. 26. Guenther PM, Juan WY, Reedy J, Britten P, Lino M,
Carlson A, et al. Diet quality of Americans in 1994-96 and 2001-02 as measured by the healthy eating Index - 2005. Washington (DC): USDA; 2007. 27. Hamidi M, Tarasuk V, Corey P, Cheung AM.
Association between the Healthy Eating Index and bone turnover markers in US postmenopausal women aged ≥45 y. Am J Clin Nutr. 2011; 94(1): 199-208. doi: 10.3945/ajcn.110.009605. 28. Pires MM. Análise da relação da qualidade da dieta
com nível de atividade física e destes com perfil lipídico e estado inflamatório em indivíduos de risco cardiometabólico [dissertação]. São Paulo: USP; 2011.
29. Huybrechts I, Vereecken C, Bacquer DD, Vandevijvere S, Oyen HV, Maes L, et al. Reproducibility and validity of a diet quality index for children assessed using a FFQ. Br J Nutr. 2010;
104(1):135-44. doi: 10.1017/S0007114510000 231.
30. Instituto Brasileiro de Geografia e Estatística. Sala de Imprensa: pesquisa de orçamentos familiares -POF 2008-2009. Análise do consumo alimentar pessoal no Brasil. IBGE; 2011 [acesso 2011 ago 17]. Disponível em: <http://www.ibge.gov.br/home/ estatistica/populacao/condicaodevida/pof/2008_ 2009_analise_consumo/pofanalise_2008_2009. pdf>.
31. Brasil. Ministério da Saúde. Secretaria de Vigilância em Saúde. Secretaria de Gestão Estratégica e Participativa. Vigitel Brasil 2010: vigilância de fato-res de risco e proteção para doenças crônicas por inquérito telefônico. Brasília: MS; 2011.
32. Grimstvedt ME, Woolf K, Milliron BJ, Manore MM. Lower healthy eating index-2005 dietary quality scores in older women with rheumatoid arthritis
vs. healthy controls. Public Health Nutr. 2010; 13(8):1170-7. doi: 10.1017/S136898001000008X. 33. Breslow RA, Guenther PM, Juan W, Graubard BI. Alcoholic beverage consumption, nutrient intakes, and diet quality in the us adult population, 1999-2006. J Am Diet Assoc. 2010; 110:551-62. doi: 10.1016/j. jada.2009.12.026.
34. World Health Organization. Report of a WHO forum and technical meeting, 2006; Paris, France: Reducing salt intake in populations. Geneva: WHO; 2007.