1
Universidade Federal de Mato Grosso, Faculdade de Nutrição, Departamento de Alimentos e Nutrição. Av. Fernando Corrêa da Costa, 2367, Coxipó, 78060-900, Cuiabá, MT, Brasil. Correspondência para/Correspondence to: B GORGULHO. E-mail: <[email protected]>.
2
University of Amsterdam, Faculty of Earth and Life Sciences, Section of Health and Life. Amsterdam, Netherlands. 3
Universidade de São Paulo, Escola de Artes, Ciências e Humanidades, Grupo Interdisciplinar de Pesquisa em Modelagem de Sistemas Complexos. São Paulo, SP, Brasil.
4
Universidade de São Paulo, Faculdade de Saúde Pública, Departamento de Nutrição. São Paulo, SP, Brasil.
Support: Funded by the Brazilian Council for Scientifi c and Technological Development (process n°142341/2013-4) and by the São Paulo Research Foundation (process nº2014/19355-6).
Como citar este artigo/How to cite this article
Gorgulho B, Pot GK, Sarti FM, Fisberg RM, Marchioni DM. Measuring the quality of main meals: Validation of a meal quality index. Rev Nutr. 2018;31(6):567-75. http://dx.doi.org/10.1590/1678-98652018000600006
Measuring the quality of main meals:
Validation of a meal quality index
Medida da qualidade das principais refeições
:
validação de um índice de qualidade de refeição
Bartira GORGULHO1 0000-0002-1714-3548
Gerda Karolien POT2 0000-0002-0863-4484
Flavia Mori SARTI3 0000-0003-2834-2005
Regina Mara FISBERG4 0000-0002-4490-9035
Dirce Maria MARCHIONI4 0000-0002-6810-5779
A B S T R A C T
Objective
To evaluate the internal validity and reliability of an index developed to assess the nutritional quality of meals.
Methods
The Main Meal Quality Index is composed of ten components. The fi nal scores range from 0-100 points. The index performance was measured using strategies for assessing content validity, construct validity, discriminant validity and reliability. The analyses were performed using the Stata statistical software at a 5% signifi cance level.
Results
added sugar, and cholesterol biomarker. Significant differences were found between the two groups with marked disparities in dietary quality, smokers (50.2 points) and non-smokers (53.5 points).
Conclusion
The index might be a useful tool for assessing the nutritional quality of meals and for monitoring and comparing groups.
Keywords: Dietary patterns. Dietary quality. Meals.
R E S U M O
Objetivo
Avaliar a validade interna e a confiabilidade do índice de qualidade das principais refeições.
Métodos
O indicador, Índice de Qualidade de Refeição, inclui dez componentes, com pontuação final que varia de 0 a 100 pontos. Estratégias de avaliação do desempenho do indicador incluíram: avaliação da validade de conteúdo, validade de construto, validade discriminante e confiabilidade. As análises foram realizadas no software estatístico Stata e adotou-se um nível de significância de 5%.
Resultados
O indicador associou-se positivamente com os nutrientes carboidrato, proteína vegetal, fibras, vitaminas, folato e potássio e negativamente à energia, gordura total, gordura saturada, proteína animal, colesterol, fósforo, sódio, açúcar adicionado e biomarcador de colesterol. Diferenças significativas foram encontradas entre dois grupos com disparidades acentuadas na qualidade da dieta, fumantes (50,2 pontos) e não fumantes (53,5 pontos).
Conclusão
O indicador pode ser uma ferramenta útil para avaliar a qualidade nutricional das refeições e ser empregado para monitorar e comparar grupos.
Palavras-chave: Padrões alimentares. Qualidade da dieta. Refeições.
I N T R O D U C T I O N
Food consumption patterns of “main meals” are associated with lifestyle factors, food choices and nutrient intake [1,2] and they influence both quantity and quality of dietary intake. The food choices for meals can affect bioavailability of certain nutrients, such as iron and calcium [2]. However, a lack of consistency and standardization among studies examining meals, as well as their determinants and consequences, was identified in a recent literature review [1]. In this sense, relevant evidence on the knowledge on diet-disease relationships might be missing [1]. A crossover trial showed that modification of a single meal could be sufficient to promote health benefits, observing that isocaloric meals with
distinct compositions elicit different postprandial inflammatory responses [3].
Although food choices are based on a combination of foods organized into meals, few studies to date have investigated meal quality indicators [1]. Previous meal indicators described in literature were developed to evaluate quality of institutional meals and none of them was designed for population based-surveys [4].
the aim of this study was to evaluate the validity and reliability of the Main Meal Quality Index (MMQI), an indicator developed to assess the nutritional quality of main meals in accordance with nutritional recommendations.
M E T H O D S
Main Meal Quality Index (MMQI)
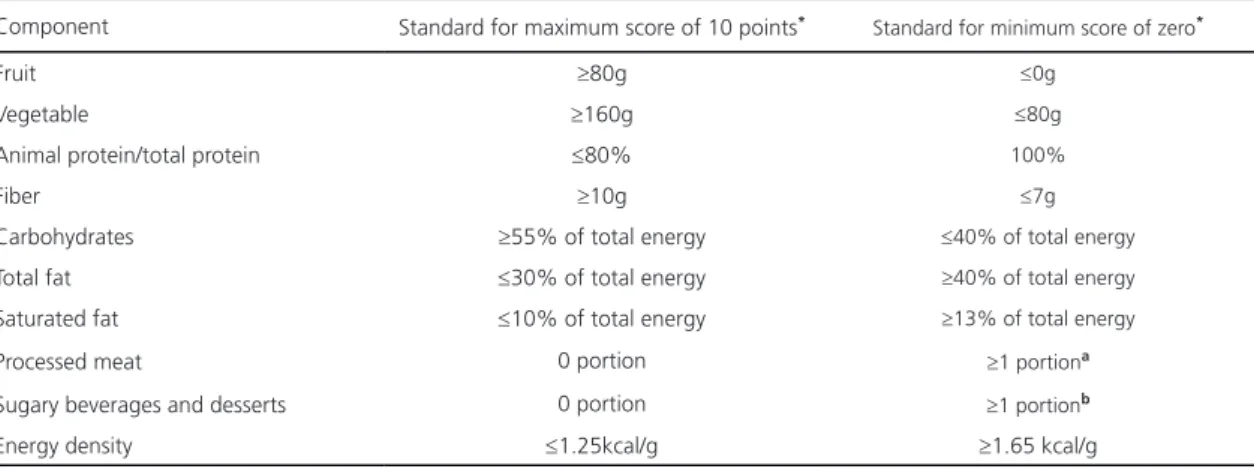
The MMQI is composed of ten components with equal weight, resulting in a final score of 0-100 points; according to Waijers et al. [5], this score range is adequate for the ranking of individuals in a population. The scoring system was based on international guidelines [6,7] and adapted for meals; the cut-off points for the maximum, intermediate, and minimum scores were based on the daily recommended proportion proposed by the World Health Organization (WHO) [7] and the World Cancer Research Fund (WCRF) [6]. The cut-off for the minimum score of zero for each component was based on the 85th percentiles of the Brazilian population, similar to the Healthy Eating Index (HEI) [8-10]. The components and the scoring system are shown in Table 1.
Based on the daily recommended intake of 400g/day [7] of fruit and vegetables (equivalent
Table 1. Main Meal Quality Index components and standards for scoring. São Paulo (SP), Brazil, 2008.
Component Standard for maximum score of 10 points* Standard for minimum score of zero*
Fruit ≥80g ≤0g
Vegetable ≥160g ≤80g
Animal protein/total protein ≤80% 100%
Fiber ≥10g ≤7g
Carbohydrates ≥55% of total energy ≤40% of total energy
Total fat ≤30% of total energy ≥40% of total energy
Saturated fat ≤10% of total energy ≥13% of total energy
Processed meat 0 portion ≥1 portiona
Sugary beverages and desserts 0 portion ≥1 portionb
Energy density ≤1.25kcal/g ≥1.65 kcal/g
Note: *For intermediate values were given a score proportional to the amount consumed. aEquivalent of 190kcal; bEquivalent of 110kcal.
analysis of energy density of the meal (energy provided per unit weight of solid foods) [6].
Sample for testing and assessing the MMQI
The data were obtained from a cross-sectional survey of health and living conditions
Inquéritos de Saúde de São Paulo 2008 (ISA,
Health Survey of the city of São Paulo), with
a representative sample of individuals. Briefly, the sample consisted of urban dwellers living in private or collective households in the municipality
of São Paulo in 2008. The participants were
selected using two-stage stratified cluster sampling in order to assure representativeness. The primary sampling units were urban census tracts, and the secondary units were households. In addition, a subsample was invited to donate a blood sample for biochemical analyses. For each potential participant, up to five attempts were made to contact them for an interview; after five unsuccessful attempts, individuals were classified as having refused to be interviewed. The ISA 2008 study has been described in detail elsewhere [11].
Food intake was recorded using a 24-Hour Dietary Recall method administered by trained interviewers according to the Multiple-Pass Method [12]. The dietary information was collected using household measurements and nutritional assessment was performed using the Nutrition Data System for Research software program version 2007 (NDS-R, University of Minnesota, Minnesota, United States). The NDS-R food composition table was compared with the Brazilian table, and the nutritional values were standardized [13].
Meals were self-reported as breakfast, lunch, dinner or snacks in the interviews, and the meal with highest caloric contribution to daily energy intake (lunch, in this population) was established as the main meal [1].
The initial sample of the study included 1258 individuals, who have complete dietary
data and a daily energy intake between 500 and 4000kcal. Thus, the final sample was composed of 956 individuals, who had had lunch the day before the interview. Of these individuals, 580 (24% adolescents, 36% adults and 40% older adults of both genders) provided a blood sample.
The project was approved by the Research Ethics Committee and all participants gave written informed consent.
Construct validity
Performance of the MMQI was measured using statistical strategies based on those used by Guenther et al. [14] to evaluate the Healthy Eating Index-2005. Correlations between MMQI scores and nutrients were evaluated.
Internal Reliability
Cronbach’s alpha coefficients were
used to determine the internal consistency of components, describing the extent to which all the items in a test measured the same concept or construct; hence, this value indicates the interrelatedness of the items within the test [15]. Higher Cronbach’s alpha values indicate greater reliability of the proposed scale, and an increase in the reliability of the estimation indicates a decrease in the fraction of a test score that is attributable to error [16].
Associations with overall dietary quality
Correlations between MMQI and overall dietary quality – assessed using the Brazilian Healthy Eating Index Revised – were explored using linear regression models adjusted for gender, age and energy [8].
Subgroup analysis
non-smokers (Wald’s test) to determine whether the index could distinguish between groups with known differences in dietary quality.
The analyses were performed using Stata statistical software version 13 (Stata Corporation, College Station, Texas, United States) at a 5% significance level.
R E S U L T S
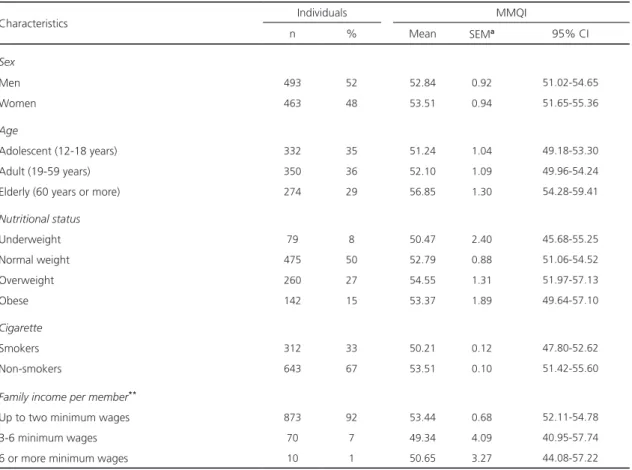
The characteristics of the study population are described in Table 2. The average energy content of lunch was 918±19kcal.
The MMQI scores were normally distributed
(Kolmorov-Smirnov Test, p=0.66) and observed
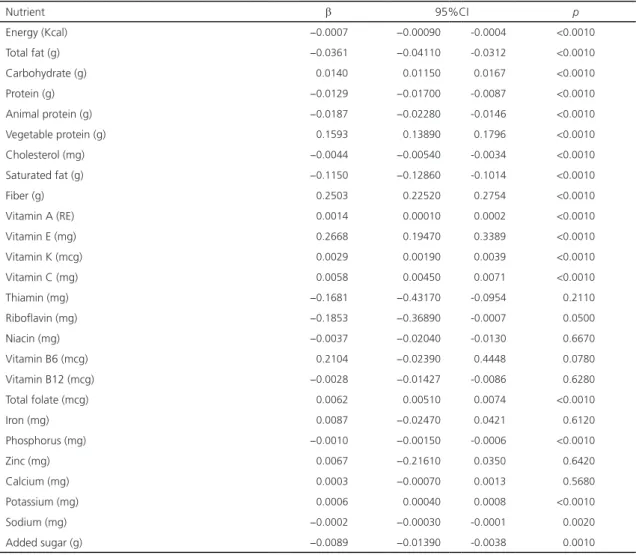
associations between MMQI and nutrients are described in Table 3.
Compared with non-smokers (53.5 points), smokers had a lower MMQI score (50.2 points), showing a significant difference between the groups (p<0.01). Furthermore, Cronbach’s alpha was 0.70, and there were weak correlations between most scores of the components; strong correlations were observed between total fat and carbohydrates (0.68) and between total fat and saturated fat (0.73).
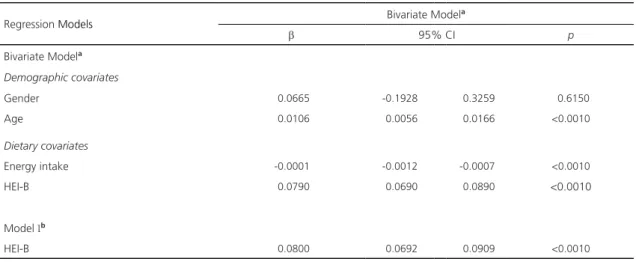
The MMQI score was significantly associated with age, energy and overall dietary quality in bivariate models (Table 4). Even after adjusting for age, gender and energy intake, main meal quality remained associated with overall dietary quality (P<0.001).
Table 2. Characteristics of the individuals* included in the study and their MMQI scores. São Paulo (SP), Brazil, 2008.
Characteristics Individuals MMQI
n % Mean SEMa 95% CI
Sex
Men 493 52 52.84 0.92 51.02-54.65
Women 463 48 53.51 0.94 51.65-55.36
Age
Adolescent (12-18 years) 332 35 51.24 1.04 49.18-53.30
Adult (19-59 years) 350 36 52.10 1.09 49.96-54.24
Elderly (60 years or more) 274 29 56.85 1.30 54.28-59.41
Nutritional status
Underweight 79 8 50.47 2.40 45.68-55.25
Normal weight 475 50 52.79 0.88 51.06-54.52
Overweight 260 27 54.55 1.31 51.97-57.13
Obese 142 15 53.37 1.89 49.64-57.10
Cigarette
Smokers 312 33 50.21 0.12 47.80-52.62
Non-smokers 643 67 53.51 0.10 51.42-55.60
Family income per member**
Up to two minimum wages 873 92 53.44 0.68 52.11-54.78
3-6 minimum wages 70 7 49.34 4.09 40.95-57.74
6 or more minimum wages 10 1 50.65 3.27 44.08-57.22
Table 3. Association between MMQI and nutrients consumed at lunch. São Paulo (SP), Brazil, 2008.
Nutrient β 95%CI p
Energy (Kcal) −0.0007 −0.00090 -0.0004 <0.0010
Total fat (g) −0.0361 −0.04110 -0.0312 <0.0010
Carbohydrate (g) 0.0140 0.01150 0.0167 <0.0010
Protein (g) −0.0129 −0.01700 -0.0087 <0.0010
Animal protein (g) −0.0187 −0.02280 -0.0146 <0.0010
Vegetable protein (g) 0.1593 0.13890 0.1796 <0.0010
Cholesterol (mg) −0.0044 −0.00540 -0.0034 <0.0010
Saturated fat (g) −0.1150 −0.12860 -0.1014 <0.0010
Fiber (g) 0.2503 0.22520 0.2754 <0.0010
Vitamin A (RE) 0.0014 0.00010 0.0002 <0.0010
Vitamin E (mg) 0.2668 0.19470 0.3389 <0.0010
Vitamin K (mcg) 0.0029 0.00190 0.0039 <0.0010
Vitamin C (mg) 0.0058 0.00450 0.0071 <0.0010
Thiamin (mg) −0.1681 −0.43170 -0.0954 0.2110
Riboflavin (mg) −0.1853 −0.36890 -0.0007 0.0500
Niacin (mg) −0.0037 −0.02040 -0.0130 0.6670
Vitamin B6 (mcg) 0.2104 −0.02390 0.4448 0.0780
Vitamin B12 (mcg) −0.0028 −0.01427 -0.0086 0.6280
Total folate (mcg) 0.0062 0.00510 0.0074 <0.0010
Iron (mg) 0.0087 −0.02470 0.0421 0.6120
Phosphorus (mg) −0.0010 −0.00150 -0.0006 <0.0010
Zinc (mg) 0.0067 −0.21610 0.0350 0.6420
Calcium (mg) 0.0003 −0.00070 0.0013 0.5680
Potassium (mg) 0.0006 0.00040 0.0008 <0.0010
Sodium (mg) −0.0002 −0.00030 -0.0001 0.0020
Added sugar (g) −0.0089 −0.01390 -0.0038 0.0010
Note: *Linear regression between MMQI and each nutrient adjusted by gender and age. β: Regression coefficient; MMQI: Main Meal Quality Index; CI: Confidence Interval. N: 956 (total of individuals).
D I S C U S S I O N
The meal quality indicator was positively related to the overall dietary quality, showing desirable measurement properties when used to evaluate the quality of meals consumed by
the representative sample. Cronbach’s alpha
showed internal consistency of the components as values equal to or greater than 0.6 indicated acceptable reliability [17]. Furthermore, the indicator was able to identify statistically significant differences between the group with marked and known disparities in dietary quality, as previously described in the literature [18].
Similar associations between dietary quality scores and nutrients have been described in the literature [10,19,20].
Table 4. Association between MMQI and revised version of the Healthy Eating Index for the Brazilian population (B-HEIR). São Paulo
(SP), Brazil, 2008.
Regression Models Bivariate Model
a
β 95% CI p
Bivariate Modela
Demographic covariates
Gender 0.0665 -0.1928 0.3259 0.6150
Age 0.0106 0.0056 0.0166 <0.0010
Dietary covariates
Energy intake -0.0001 -0.0012 -0.0007 <0.0010
HEI-B 0.0790 0.0690 0.0890 <0.0010
Model Ib
HEI-B 0.0800 0.0692 0.0909 <0.0010
Note: aLinear regression between MMQI and each demographic, dietary and outcome covariate; bLinear regression between MMQI and HEI-B adjusted by demographic covariates and energy intake. β: Regression coefficient; MMQI: Main Meal Quality Index; CI: Confidence Interval.
animal sources of protein. In Brazil, 74% of the population habitually consumes red (beef and pork) and greater amounts of processed meats than those recommended, with an average meat consumption of 157g/day [21]. The MMQI was developed to evaluate main meals, that is, meals that supply the highest levels of daily energy intake, such as lunch or dinner in most western countries. Thus, considering its characteristics, this indicator might not be appropriate for studying minor eating events, such as breakfast and snacks.
Despite cultural and social differences, countries and international organizations have developed nutritional reference values and guidelines with the aim of maintaining health status and preventing an increase in the prevalence of diet-related, non-communicable chronic diseases. Such guidelines consistently recommend high consumption of whole grains, fruits and vegetables, and reduced consumption of total fat, saturated fat and added sugar [6,7,21]. Accordingly, these consensual indicators of good food choice were used in the MMQI development [6,7]. This option allows further comparisons of main meals consumed by
different populations, without modifications to its components [22]. Therefore, although the data used to validate the index is from Brazil, we believe that the MMQI can be used to assess main meal intake in population-based data in other western countries.
The development of a quality index is complex as it involves a large degree of subjectivity and many choices related to components, cut-off values and scoring [5]. One relevant point is the adjustment for energy. Intakes of most nutrients tend to be positively correlated with total energy consumed, and particularly strong associations for macronutrients are described in the literature [23]. In an endeavor to overcome this, the MMQI evaluates the energy percentage contributed by carbohydrates and fats, including the energy density of the meal as a component. Foods rich in fiber, vitamins and minerals, such as fruits and vegetables, have lower energy density compared with foods that have higher sugar and fat contents. Furthermore, avoiding processed meats and sugary beverages and foods, irrespective of the energy consumption, is recommended [6].
indicators. In this context, we sought to apply the most common approaches used analysis described in literature. We believe that an interesting way to validate the MMQI would be an examination of the association between index scores and postprandial responses; however, we do not have enough information to conduct such an analysis. Moreover, there are no nutritional recommendations that may be apply to meals. At present, some programs and guidelines have been changed to emphasize meal-based recommendations, but few have attempted to scientifically define a “good meal”.
C O N C L U S I O N
The Main Meal Quality Index presented satisfactory proprieties and internal consistency as an instrument for evaluating lunch, the main meal in a population living in a highly urbanized and industrialized setting, and it may be used to monitor and compare the nutritional quality of meals in similar populations, but further studies are necessary.
C O N T R I B U T O R S
All authors contributed towards the study concepts and design, data analysis and interpretation.
R E F E R E N C E S
1. Leech RM, Worsley A, Timperio A, McNaughton SA. Understanding meal patterns: Definitions, methodology and impact on nutrient intake and diet quality. Nutr Res Rev. 2015;28(1):1-21.
2. Gibson RS. The role of diet-and host-related factors in nutrient bioavailability and thus in nutrient-based dietary requirement estimates. Food Nutr Bull. 2007;28(Supl.1):S77-100.
3. Monfort-Pires M, Ferreira SRG. Modification in a single meal is sufficient to provoke benefits in inflammatory responses of individuals at low-to-moderate cardiometabolic risk. Clin Nutr. 2016;35(6):1242-50. http://dx.doi.org/10.1016/j. clnu.2016.02.015
4. Gorgulho BM, Pot GK, Sarti FM, Marchioni DM. Indices for the assessment of nutritional quality of meals: A systematic review. Brit J Nutr. 2016;115(11):2017-24.
5. Waijers PM, Feskens EJ, Ocké MC. A critical review of predefined diet quality scores. Brit J Nutr. 2007;97(2):219-31.
6. World Cancer Research Fund. American Institute for Cancer Research. Food, nutrition, physical activity, and the prevention of cancer: A global perspective. Washington (DC): AICR; 2007.
7. World Health Organization. Diet, nutrition and the prevention of chronic diseases. Geneva: WHO; 2003. WHO Rechnical Report Series, n.916.
8. Previdelli AN, Andrade SC, Pires MM, Ferreira SRG, Fisberg RM, Marchioni DM. A revised version of the Healthy Eating Index for the Brazilian population. Rev Saúde Pública. 2011;45(4):794-8.
9. Guenther PM, Reedy J, Krebs-Smith SM, Reeve BB, Basiotis PP. Development and evaluation of the healthy eating index-2005. Washington (DC): Department of Agriculture; 2007.
10. Guenther PM, Casavale KO, Reedy J, Kirkpatrick SI, Hiza HA, Kuczynski KJ, et al. Update of the Healthy Eating Index: HEI-2010. J Acad Nutr Diet. 2013;113(4):569-80.
11. Secretaria Municipal de Saúde de São Paulo. Inquéritos de saúde: primeiros resultados. Boletim ISA: capital 2008. São Paulo: Secretaria Municipal da Saúde de São Paulo; 2010.
12. Moshfegh AJ, Rhodes DG, Baer DJ, Murayi T, Clemens JC, Rumpler WV, et al. The US Department of Agriculture Automated Multiple-Pass Method reduces bias in the collection of energy intakes. Am J Clin Nutr. 2008;88(2):324-32.
13. Marchioni DML, Fisberg RM. Guideline of food consumption evaluation in population surveys: A health survey experience in São Paulo. Sao Paulo: Universidade de São Paulo; 2012.
14. Guenther PM, Reedy J, Krebs-Smith SM, Reeve BB. Evaluation of the Healthy Eating Index-2005. J Am Dietetic Assoc. 2008;108(11):1854-64.
15. Cronbach LJ. Coefficient alpha and the internal structure of tests. Psychometrika. 1951;16(3):297-334.
16. Santos JRA. Cronbach’s alpha: A tool for assessing the reliability of scales. J Extension. 1999;37(2):1-5.
17. Nunnally JC. Psychometric theory. New York: McGraw-Hill; 1978.
2010 Dietary Guidelines for Americans. J Nutr. 2014;144(3):399-407. http://dx.doi.org/10.3945/ jn.113.183079
19. Sabinsky MS, Toft U, Andersen KK, Tetens I. Index of dietary Quality (Meal IQ) to assess the dietary quality of school lunches. Public Health Nutr. 2012;15(11):2091-9.
20. Gorgulho BM, Lipi M, Marchioni DML. Nutritional quality of meals served by the cafeteria of a company located in the metropolitan region of São Paulo, Brazil. Rev Nutr. 2001;24(3):463-72. http:// dx.doi.org/10.1590/S1415-52732011000300009
21. Montagnese C, Santarpia L, Buonifacio M, Nardelli A, Caldara AR, Silvestri E, et al. European
food-based dietary guidelines: A comparison and update. Nutr. 2015;31(7-8):908-15.
22. McNaughton SA. Dietary patterns and diet quality: Approaches to assessing complex exposures in nutrition. Australas Epidemiol. 2010;17(1):35-7.
23. Willett WC, McCullough ML. Dietary pattern analysis for the evaluation of dietary guidelines. Asia Pac J Clin Nutr. 2008;17(Supl.1):75-8.
Received: May 5, 2018