Universidade de Lisboa
Faculdade de Ciências
Departamento de Química e Bioquímica
PHENOLIC COMPOUNDS AND DITERPENOIDS WITH ACTIVITY IN AQUEOUS
EXTRACTS OF PLECTRANTHUS
Emma Louise Kilner Gomes
Dissertação
MESTRADO EM QUÍMICA
Universidade de Lisboa
Faculdade de Ciências
Departamento de Química e Bioquímica
PHENOLIC COMPOUNDS AND DITERPENOIDS WITH ACTIVITY IN AQUEOUS
EXTRACTS OF PLECTRANTHUS
Emma Louise Kilner Gomes
Dissertação orientada por:
Professor Doutor Carlos Manuel Ferreira de Sousa Borges
Doutor Paulo Jorge Amorim Madeira
MESTRADO EM QUÍMICA
The work presented in this dissertation was undertaken
in the Environmental and Biological Mass Spectrometry
Group, Departamento de Química e Bioquímica,
Faculdade de Ciências da Universidade de Lisboa, under
Acknowledgements
This work was achieved due to the support of a bunch of people that have been by my side not only during its performance, but also throughout my life.
First, I would like to thank Professor Doutor Carlos Borges and Doutor Paulo Madeira for the guidance, help, motivation and all the knowledge transmitted during these months.
Within the Environmental and Biological Mass Spectrometry Group, I would like to thank first Professora Maria Helena Florêncio for receiving me in her group and for the support during this work. Thanks also to Sofia Alves, Ana Marques, Samuel Barata, Joana Henriques and Daniela Guerreiro for their friendship, support and all the fun and relaxing moments. I also thank Professora Maria Luísa Serralheiro for proving me the plant extracts and for all her help during the work, Professora Doutora Lia Ascensão for the collection and identification of the plants, and Doutor Pedro Falé for the preparation of the extracts and the establishment of the initial LC-MS conditions.
From the Separation Science and Technology Group, Samir Ahmad for his help during the SPE process. From the Organometallic Group, I thank Tânia Morais for her friendship, for all the help and advice during these months, and for all the fun days passed together.
A very special thank you to Tiago Jorge for helping me out when I arrived at the lab, for teaching me how to use all the equipment, for his friendship, jokes and fun moments, and for always being there for my doubts.
Also a special thank you to my friends Filipa, Maria, Raquel and Tiago for always being by my side and supporting me through this stage of my life.
Last but certainly not least, my family, especially my mum and my sister, for always believing in me and supporting my decisions, for all the strength, motivation and friendship during this work and all my life.
Thank you all, Emma :D
Resumo
Nos dias de hoje, a análise química de alimentos e de plantas tem-se tornado importante não só para cientistas durante a sua investigação, mas tem também influência na rotina diária dos seres humanos.
Este trabalho teve como objetivo principal a identificação de compostos fenólicos e diterpenóides em extratos aquosos de Plectranthus. Estas plantas estão em uso há um grande número de anos devido às suas conhecidas propriedades medicinais.
Para começar, realizou-se um estudo do comportamento em estado gasoso para cinco flavonas (acacetina, chrysoeriol, luteolina, orientina e vitexina). Foram efetuados cálculos semi-empíricos para determinar os locais de protonação e desprotonação energeticamente mais favoráveis para as cinco flavonas. Enquanto a protonação é mais provável de ocorrer no grupo C=O da posição 4 para as cinco flavonas, o local de desprotonação mais favorável difere. Estes compostos foram depois analisados por espectrometria de massa tandem com ionização por electrospray, os seus iões produto foram estudados e algumas vias de fragmentação foram propostas. Foram observadas várias perdas neutras, juntamente com quebras de ligações C-C no anel C da aglícona e no açúcar, quando aplicável.
Os extratos aquosos de Plectranthus previamente preparados foram analisados por cromatografia líquida acoplada à espectrometria de massa. Foram testadas várias condições cromatográficas de modo a obter a melhor separação possível entre os compostos presentes nas amostras. Vários compostos foram identificados nos dez extratos, sendo que o ácido rosmarínico (conhecido pelas suas boas propriedades antioxidantes) foi o único encontrado em todas as amostras e o presente em maior abundância. A percentagem de ácido rosmarínico presente nas amostras foi depois comparada com o potencial antioxidante de cada extrato.
Palavras-chave: Plectranthus, compostos fenólicos, diterpenóides, espectrometria de massa, cálculos semi-empíricos.
Abstract
Nowadays, chemical analysis of foodstuffs and plants has become important not only for scientists during their research, but it also has influence in human beings’ daily routine.
The main goal of this work consisted in the identification of phenolic compounds and diterpenoids in aqueous extracts of Plectranthus. These plants have been in use for a large number of years due to their known medicinal properties.
First, a gas-phase behaviour study was performed for five flavones (acacetin, chrysoeriol, luteolin, orientin and vitexin). Semi-empirical calculations were used to determine the most probable protonation and deprotonation sites for the flavones. While the protonation is predicted to occur at position 4 C=O group for the five flavones, the predicted deprotonation site varies. These compounds were then analysed by electrospray tandem mass spectrometry in the positive and negative ion modes, their product ions were studied and some fragmentation pathways were established. Various neutral losses were observed, together with cross-ring cleavages of the aglycone and the sugar moiety, when applicable.
The previously prepared Plectranthus extracts were analysed by liquid chromatography coupled to electrospray mass spectrometry. Several chromatographic conditions were tested to obtain the best separation of the compounds present in the complex samples. Many compounds were identified in the ten extracts, being rosmarinic acid (which possesses great antioxidant properties) the only one present in them all and the most abundant one. The percentage of rosmarinic acid found in the samples was then compared with the antioxidant potential of each extract.
Keywords: Plectranthus, phenolic compounds, diterpenoids, mass spectrometry, semi-empirical calculations.
Resumo da dissertação de mestrado em português
“Compostos fenólicos e diterpenóides com atividade em extratos
aquosos de Plectranthus”
Introdução
Plantas com fins medicinais têm sido muito usadas durante um grande número de anos, e os seus extratos são ainda essenciais na terapia de hoje em dia, consistindo numa fonte de fármacos quase exclusiva da maioria da população mundial. As espécies de
Plectranthus são usadas numa diversidade de situações. A sua utilização mais citada reside
sobre as suas propriedades medicinais, como antissépticas, anti-inflamatórias e antimicrobianas. Embora várias plantas já tenham sido estudadas, a química de Plectranthus ainda é relativamente desconhecida. No entanto, sabe-se que os constituintes fitoquímicos maioritários deste género são os diterpenóides, os compostos fenólicos e os óleos essenciais. Este trabalho foca-se no estudo dos diterpenóides e dos compostos fenólicos. Os diterpenóides são os metabolitos secundários mais comummente encontrados nas espécies de Plectranthus, sendo a sua maioria abietanos altamente modificados. O principal composto fenólico encontrado é o ácido rosmarínico, já muito conhecido pelos seus interesses biológicos. Outros compostos fenólicos também muito encontrados nas espécies de Plectranthus são os flavonóides. Estes podem ser divididos em várias classes, sendo a maior classe a classe das flavonas. Neste trabalho, algumas flavonas são estudadas por espectrometria de massa.
A espectrometria de massa é provavelmente a técnica analítica mais versátil atualmente disponível para químicos. Mede exatamente a massa molecular de compostos individuais, através da ionização dos átomos ou moléculas de uma amostra, da sua separação pela razão massa/carga (m/z) e da sua deteção qualitativa e quantitativa pela respetiva m/z e abundância. Visto que, em princípio, todos os iões são acessíveis pela espectrometria de massa, é considerada um método universal para a análise química. As técnicas de espectrometria de massa são adequadas para a análise de flavonóides em plantas e alimentos, visto conseguirem fornecer informação estrutural significativa tanto em pequenas quantidades de amostras puras, como em misturas. A espectrometria de massa tandem com ionização por electrospray tem mostrado ser um método poderoso na identificação de compostos fenólicos em plantas. A espectrometria de massa tandem envolve pelo menos duas fases de análise de massa. Geralmente, um primeiro analisador de massa é usado para isolar o ião precursor, que depois sofre fragmentação por colisão com um gás inerte, originando iões produto e fragmentos neutros. Estes são então analisados por um segundo analisador de massa. Uma das principais vantagens da espectrometria de
X
massa tandem, para além da sua elevada especificidade, é o facto de a amostra não ter que sofrer uma purificação prévia, visto conseguir-se selecionar e isolar o ião de interesse.
Uma vez que as amostras de extratos de plantas são extremamente complexas, são necessários métodos analíticos seletivos e eficientes para determinar as estruturas dos seus compostos. A cromatografia líquida acoplada à espectrometria de massa tandem (HPLC-MSn) permite a separação e identificação de moléculas individuais em amostras complexas, sendo, por isso, a escolha de eleição. Visto que os flavonóides são compostos moderadamente polares e termolábeis, são também melhor analisados por cromatografia líquida. Obviamente, e especialmente quando a identificação individual dos flavonóides é importante, são usadas técnicas hifenadas avançadas, como por exemplo o HPLC-MSn).
Parte experimental
Todos os reagentes utilizados ao longo deste trabalho são de grau HPLC e não sofreram nenhuma purificação prévia.
As cinco flavonas estudadas (acacetina, chrysoeriol, luteolina, orientina e vitexina) foram dissolvidas em metanol a uma concentração de 10-5 M. As soluções estudadas no modo de ionização positivo foram acidificadas com 2 µL de ácido fórmico. Estas flavonas foram analisadas por espectrometria de massa e espectrometria de massa tandem utilizando, para tal, um espectrómetro de massa LCQ Duo da Thermo Scientific (USA). Os parâmetros instrumentais foram otimizados de modo a garantir a melhor razão sinal/ruído. Para as experiências tandem, o hélio foi usado com gás de colisão. Todos os dados foram adquiridos nos modos positivo e negativo, usando o software Xcalibur versão 1.2 da Thermo Scientific (USA).
Para prever os locais de protonação e desprotonação mais favoráveis para as cinco flavonas foram realizados cálculos semi-empíricos, usando para tal o PM6 hamiltoneano implementado no MOPAC2012. As entalpias de formação foram calculadas para cada composto, tanto para as espécies neutras como para as várias espécies protonadas e desprotonadas, sendo estas depois usadas para calcular as entalpias de reação.
Foram analisadas as folhas de dez espécies de Plectranthus. Depois de devidamente preparadas e liofilizadas, 10 mg de cada amostra foram diluídas em 1 mL de MeOH/H2O
(50/50), as amostras foram filtradas e introduzidas em vials.
As análises LC-MSn foram realizadas com um HPLC Surveyor Plus da Thermo Scientific (USA) acoplado a um espectrómetro de massa LCQ Duo Thermo Scientific (USA)
equipado com uma fonte de ionização por electrospray. A coluna usada foi uma LiChrospher 100 RP-8 (5µm) LiChroCART 250-4 mm da Merck. Foram testados cinco métodos diferentes, diferindo entre eles a constituição do eluente, o fluxo e o tempo de análise. A fase móvel é constituída por um sistema binário de MeOH e uma fração aquosa. Estas foram: H2O +
0.05% TFA, H2O + 1% HCOOH, H2O + 0.1% HCOOH e H2O + 0.1% NH4OH solução. Os
parâmetros instrumentais foram otimizados de modo a garantir a melhor razão sinal/ruído. O hélio foi usado com gás de colisão. Todas as experiências foram realizadas nos modos positivo e negativo, e os espectros de massa foram adquiridos e processados usando o
software Xcalibur versão 1.2 da Thermo Scientific (USA).
Resultados, discussão e conclusões
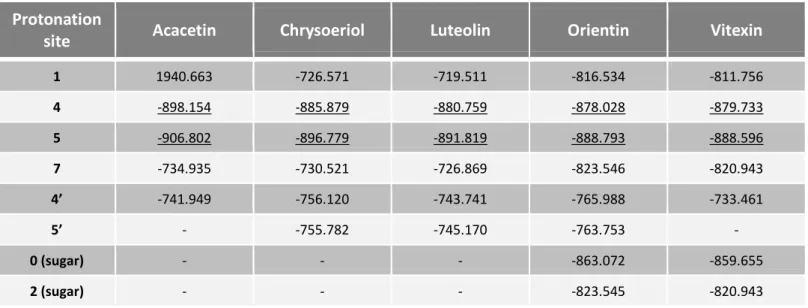
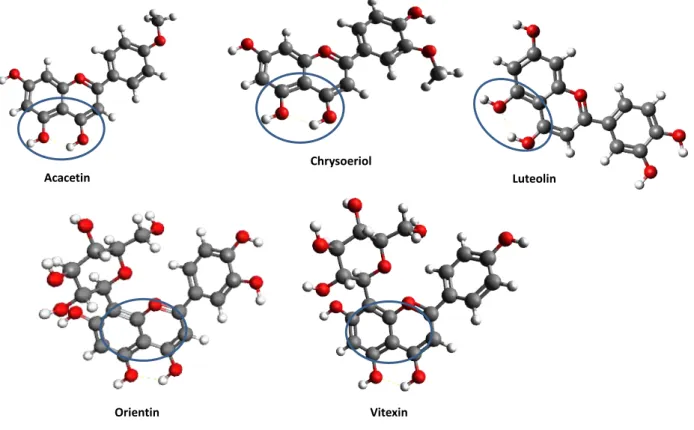
Através da realização de cálculos semi-empíricos verificou-se que a protonação é energeticamente mais favorável no grupo carbonilo (C=O) da posição 4 do anel C para as cinco flavonas. Quanto à desprotonação, esta é mais provável ocorrer no grupo hidroxilo (OH) da posição 7 para a acacetina, no grupo OH da posição 4’ para o chrysoeriol e para a luteolina, e no grupo OH da posição 4 do açúcar para a orientina e para a vitexina.
As cinco flavonas foram estudadas por espectrometria de massa com ionização por
electrospray nos modos positivo e negativo. Relativamente ao modo negativo, foram
verificadas perdas de H2O, CO, CO2, CH3 e C2H2O, juntamente com quebras de ligações C-C
no anel C da aglícona e no açúcar, quando aplicável. Foram apresentados alguns exemplos destas várias vias de fragmentação. Na análise em modo positivo, verificaram-se perdas de H2O, CO e C2H2O, juntamente com quebras de ligações C-C no anel C da aglícona e no
açúcar, quando aplicável. Para estes casos também foram apresentadas algumas vias de fragmentação exemplificativas. Os resultados analisados sugerem que os dois modos de ionização são complementares na caracterização estrutural de flavonas por espectrometria de massa.
Vários métodos foram testados para a separação e identificação dos compostos fenólicos e dos diterpenóides presentes nos extratos de Plectranthus. Todos os métodos de HPLC iniciavam com uma maior percentagem da fase aquosa, e no final de cada método as condições iniciais eram restabelecidas. A otimização das condições cromatográficas incluiu a constituição do eluente, o fluxo e o tempo de análise. Vários problemas foram encontrados, como por exemplo a formação de adutos entre os compostos e o eluente ou então a baixa resolução dos picos. No final, chegou-se à conclusão de que as condições cromatográficas
XII
usadas para a identificação dos compostos seriam as seguintes: corridas de 90 minutos, um fluxo de 0.3 mL min-1, e a fase móvel seria composta por um sistema binário de MeOH e H2O
+ HCOOH 0.1%.
A identificação dos compostos presentes em cada amostra foi feita através da análise das suas fragmentações. Vários compostos foram identificados nos dez extratos, sendo que o ácido rosmarínico (conhecido pelas suas propriedades antioxidantes) foi o único encontrado em todas as amostras e o presente em maior abundância. A percentagem de ácido rosmarínico presente nas amostras foi depois comparada com o potencial antioxidante. Contudo, alguns compostos ficaram por identificar.
Abbreviations and Symbols
a.u. – arbitrary unit CI – chemical ionization
CID – collision induced dissociation CRM – charge residue model DFT – density functional theory ECD – electron capture dissociation EI – electron ionization
ESI – electrospray ionization
ESI-MS/MS – electrospray ionization tandem mass spectrometry ETD – electron transfer dissociation
EtOAc – ethyl acetate
FAB – fast atom bombardment
FTICR – Fourier transform ion cyclotron resonance GC – gas chromatography
HCOOH – formic acid
HPLC – high performance liquid chromatography H2O – water
ICR – ion cyclotron resonance
IC50 – half maximal inhibitory concentration IEM – ion evaporation model
IRMPD – infrared multiphoton dissociation IT – ion trap
kDa – kilodalton kJ – kilojoules kV – kilovolts
LC – liquid chromatography
LC-MS – liquid chromatography-mass spectrometry
LC-MS/MS – liquid chromatography-tandem mass spectrometry MALDI – matrix assisted laser desorption/ionization
Me – methyl MeOH – methanol
XIV mf+ - product ion mn – neutral fragment mol – mole mp+ - precursor ion MS – mass spectrometry
MSn – Multi stage mass spectrometry (n – number of generations of ions being analysed)
m/z – mass-to-charge ratio
NaCl – sodium chloride Na+ – sodium ion
NH4OAc – ammonium acetate
NH4OH – ammonium hydroxide NH4+ – ammonium ion PA – Plectranthus apimentado PE – Plectranthus ersti PG – Plectranthus gradientatus PL – Plectranthus lanuginosus PM – Plectranthus madagascariensis PN – Plectranthus neochilus PV – Plectranthus verticilatus PVEN – Plectranthus ventrii
PVUB – Plectranthus verticilatus u. bombo PZ – Plectranthus zuluensis
RA – rosmarinic acid RDA – retro-Diels-Alder
SID – surface induced dissociation SPE – solid phase extraction TFA – trifluoroacetic acid
tm – time required for the mobile phase or an unretained solute to pass through the
chromatographic column TOF – time-of-flight torr – torr
tR – retention time
UV – ultraviolet V – volts α – selectivity fH – heat of formation rH – reaction enthalpy µl – microlitre
General Contents
Acknowledgments………..I Resumo………..III Abstract………..V Resumo da dissertação de mestrado em português………..VII Abbreviations and Symbols………..XIII General Contents……….XVII Figure List……….XXI Table List………..XXIII
Chapter 1 – Introduction
1.1 The Importance of Chemical Analysis in Food Stuff………...…..3 1.2 Plant extracts: Plectranthus……….……4 1.2.1 Chemical constituents isolated from Plectranthus……….4 1.2.1.1 Diterpenoids……….…….5 1.2.2.2 Phenolic compounds………5 1.3 Flavonoids………7 1.3.1 Occurrence and Properties……….7 1.3.2 Chemical Structure………8 1.4 Mass Spectrometry (MS)………..9 1.4.1 Brief History and Recent Developments………9 1.4.2 The Mass Spectrometer………11 1.4.2.1 Ion Source………..12 1.4.2.1.1 Electrospray (ESI)………..12 1.4.2.2 Mass Analyser………..15 1.4.2.2.1 Ion Trap (IT)………..15 1.4.3 Tandem Mass Spectrometry (MSn)………..………16 1.5. High-Performance Liquid Chromatography (HPLC)………..………..19 1.5.1 The HPLC System………..……….20 1.5.2 The Chromatographic Process………..………..20 1.5.3 LC-MS Interface ………..……….………….22 1.6 References………..23
XVIII
Chapter 2 – Experimental Section
2.1 Materials………..29 2.2 Reagents………29 2.3. Standard preparation……….29 2.4. MSn analysis conditions……….30 2.5. Semi-empirical calculations………..31 2.6. Sample preparation……….31 2.6.1. Solid phase extraction (SPE)……….32 2.7. LC-MSn analysis conditions……….32 2.8 References………..35
Chapter 3 – Results and Discussion
3.1. Study of the gas-phase behaviour of flavones……….39 3.1.1. Protonation and deprotonation sites by semi-empirical calculations………39 3.1.2. ESI-MS and ESI-MSn of the flavones under study………42 3.2. Analytical methodology………50 3.3. Identification of compounds present in aqueous extracts of Plectranthus……….54 3.3.1. Identification of the compounds by LC-MSn analysis……….54 3.3.2. Comparison between the percentages of rosmarinic acid present the extracts and their antioxidant potential………..………..58 3.4 References………..67
Chapter 4 – Conclusions and Future Work……….71
Appendix
A. MSn spectra of the flavones………..A A1. Acacetin – negative ion mode………..A A2. Acacetin – positive ion mode………..….A A3. Chrysoeriol – negative ion mode………B A4. Chrysoeriol – positive ion mode……….B A5. Luteolin – negative ion mode………C A6. Luteolin – positive ion mode……….C
A7. Orientin – negative ion mode………D A8. Orientin – positive ion mode……….…E A9. Vitexin – negative ion mode………..F A10. Vitexin – positive ion mode……….G
B. Chromatograms of the ten extracts………H B1. PA extract………H B2. PE extract……….H B3. PG extract………I B4. PL extract……….I B5. PM extract………...J B6. PN extract……….J B7. PV extract……….K B8. PVEN extract………..………..K B9. PVUB extract………..………..L B10. PZ extract………..………..L
C. MS, MS2 and MS3 spectra of the compounds found in the aqueous
extracts of Plectranthus………..………..M C1. Compound 1……….M C2. Compound 2………..…..M C3. Compound 3………..………..N C4. Compound 4………..……..N C5. Compound 5………..…………..O C6. Compound 6………..………..O C7. Compound 7………..………..P C8. Compound 8………..………..P C9. Compound 9………..…..Q C10. Compound 10………..…….Q C11. Compound 11………..……….R C12. Compound 12………..………….R C13. Compound 13………..……….S C14. Compound 14………..…….S
XX
C15. Compound 15………..….T C16. Compound 16………..……….T C17. Compound 17………..…….U C18. Compound 18………..…….U
Figure List
Figure 1.1 - Two different Plectranthus species (family Lamiaceae, subfamily
Nepetoideae, tribe Ocimeae)……….………..4 Figure 1.2 - Example structures of a diterpenoid and a phenolic compound
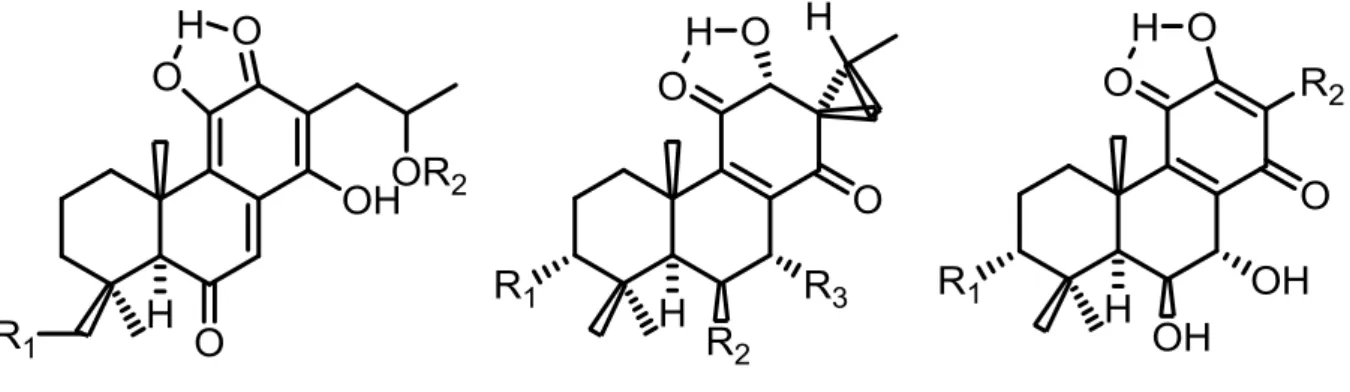
(flavone) found in Plectranthus species………..………..5 Figure 1.3 - Three examples of the variety of structures that diterpenoids
can assume………..………..………..….5 Figure 1.4 - Chemical structures of rosmarinic acid (above) and nepetoidin
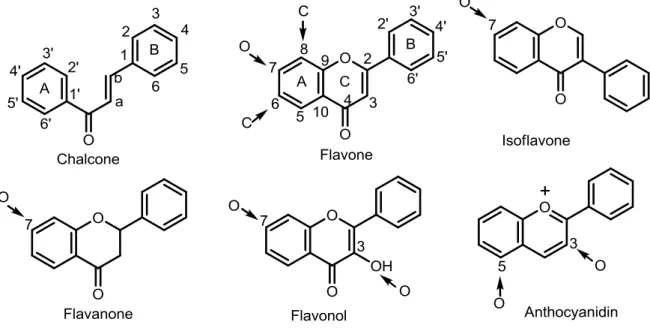
A (below)………..………..……….6 Figure 1.5 - Colour of flowers and fruits due to the presence of flavonoids……….7 Figure 1. 6 - Some foodstuff where flavonoids have been found………....8 Figure 1. 7 - Basic structures corresponding to the main classes of flavonoids,
with the common O- and C-glycosylation positions indicated with an arrow………....8 Figure 1.8 - The five main components of a mass spectrometer……….11 Figure 1.9 - The different stages of the ESI process………..13 Figure 1.10 - The two possible mechanisms for the production of
gas-phase ions in ESI (CRM and IEM)………..13 Figure 1.11 - Representation of a skimmer device………...14 Figure 1.12 - Components of an IT mass analyser………..15 Figure 1.13 - Trajectory of the ions trough the ion trap……….16 Figure 1.14 - The principle behind tandem MS………...17 Figure 1.15 - Components of a typical HPLC system……….20 Figure 1.16 - Representation of the chromatographic process……….21
Figure 2.1 – Structures of the flavone standards under study………..30
Figure 3.1 – General flavone and flavone-8-C-glucoside structures and their
respective numbering scheme……….39 Figure 3.2 - Optimized structures of the five flavones protonated at position
4 C=O group instead of at position 5 OH group………41 Figure 3.3 – Full MS spectrum of each flavone in the negative ion mode……….42 Figure 3.4 - Full MS spectrum of each flavone in the positive ion mode………46
XXII
Figure 3.5 – HPLC chromatograms obtained for Plectranthus apimentado
using method A, method B, method C and method D, respectively……….50 Figure 3.6 – MS spectrum of a compound present in Plectranthus apimentado.
The compound (m/z 359) and the adduct formed with TFA (m/z 473)………..51 Figure 3.7 – HPLC chromatogram, LC-MS chromatogram (positive ion mode)
and LC-MS chromatogram (negative ion mode) of Plectranthus apimentado after
SPE (MeOH fraction)………52 Figure 3.8 – HPLC chromatogram, LC-MS chromatogram (positive ion mode)
and LC-MS chromatogram (negative ion mode) of Plectranthus apimentado after
SPE (EtOAc fraction)………...52 Figure 3.9 - HPLC chromatogram, LC-MS chromatogram (positive ion mode)
and LC-MS chromatogram (negative ion mode) of Plectranthus apimentado after
SPE (H2O fraction)………....52
Figure 3.10 - HPLC chromatogram, LC-MS chromatogram (positive ion mode) and LC-MS chromatogram (negative ion mode) of Plectranthus apimentado using
method E……….53 Figure 3.11 – Structures of the identified compounds present in the Plectranthus
species……….………...59 Figure 3.12 – Percentage of rosmarinic acid present in each extract of Plectranthus……..60 Figure 3.13 – Medium value of IC50 for DPPH of each extract of Plectranthus……….60
Table List
Table 2.1 – Molecular masses of the flavones………..30 Table 2.2 – The tem Plectranthus species analysed in this work……….32 Table 2.3 – HPLC gradient program used for method A……….33 Table 2.4 – HPLC gradient program used for method B……….33 Table 2.5 – HPLC gradient program used for method C……….33 Table 2.6 – HPLC gradient program used for method D……….34 Table 2.7 – HPLC gradient program used for method E………..34
Table 3.1 - rH values (kJ mol-1) for the different protonation sites of the five
flavones.………...………39 Table 3.2 - rH values (kJ mol-1) for the different deprotonation sites of the five
flavones.………..………….………40 Table 3.3 – Predicted protonation and deprotonation sites for each flavone under
study.………..……….……….41 Table 3.4 – Product ions corresponding to the mass losses observed for the five
flavones in the negative ion mode………..……….…….43 Table 3.5 – Product ions corresponding to the mass losses observed for the five
flavones in the positive ion mode………..………47 Table 3.6 – m/z values of the compounds found in each extract of Plectranthus
(+ = detected) ………..………..56 Table 3.7 – Retention time, m/z values and name of the compounds found in the
PA extract………..……….62 Table 3.8 – Retention time, m/z values and name of the compounds found in the
PE extract………..……….62 Table 3.9 – Retention time, m/z values and name of the compounds found in the
PG extract………..……….62 Table 3.10– Retention time, m/z values and name of the compounds found in the
PL extract………..……….……….63 Table 3.11 – Retention time, m/z values and name of the compounds found in the
XXIV
Table 3.12– Retention time, m/z values and name of the compounds found in the
PN extract………..……….………64 Table 3.13– Retention time, m/z values and name of the compounds found in the
PV extract………..……….64 Table 3.14 – Retention time, m/z values and name of the compounds found in the
PVEN extract………..………..65 Table 3.15 – Retention time, m/z values and name of the compounds found in the
PVUB extract………..………..65 Table 3.16– Retention time, m/z values and name of the compounds found in the
CHAPTER 1
Chapter 1 – Introduction
1.1. The Importance of Chemical Analysis in Food Stuff
In the 18th and 19th centuries, the major aim for the chemists was to understand the chemical nature of food. They realised that this knowledge was essential if dietary standards were to improve. With them also health and prosperity would improve. Obviously, the food components present in larger amounts, such as carbohydrates, were the first nutrients described by chemists. As it was known that food and drink on sale to the general public could have been adulterated, it was necessary to develop analytical techniques that allow more selectivity and sensitivity to identify compounds in lower concentrations (for example vitamins). These analytical procedures (for example, gas chromatography, high-performance liquid chromatography and mass spectrometry) are used to provide information about a wide variety of different characteristics of foods, including their composition, structure, physicochemical properties and sensory attributes. It was in the 20th century with these techniques that chemists detected malpractices in food suppliers, such as additional water in milk, dangerous colourings in confectionary, amongst others.
Nowadays, the knowledge of chemical analysis has become important not only for scientists in their research, but also bears influence in the human beings’ daily routine as well. The information about the food stuff is critical to the rational understanding of the factors that determine the properties of foods, as well as to the ability to economically produce foods that are consistently safe, nutritious and desirable and for consumers to make informed choices about their diet.[1]
4
1.2. Plant extracts: Plectranthus
Plants for medicinal purposes have been in use for a great number of years, and their extracts are still essential to today’s therapy, consisting in an almost exclusive source of drugs for the majority of the world population.[2]
Figure 1.1 – Two different Plectranthus species (family Lamiaceae, subfamily Nepetoideae, tribe Ocimeae).
Many Plectranthus species are plants with economic potential and medicinal interest. The genus Plectranthus, a large and widespread genus containing around 300 species, belongs to the family Lamiaceae, subfamily Nepetoideae, tribe Ocimeae. They are warm-climate plants that occur largely in the southern hemisphere.
Plectranthus species are used in a variety of situations. The most cited use is for their
medicinal properties, such as antiseptic, anti-inflammatory and antimicrobial. As example, P.
barbatus is used as a remedy for stomach ache and as a purgative.[3, 4]
1.2.1. Chemical constituents isolated from Plectranthus
Although several plants have already been studied, the chemistry of Plectranthus is still relatively unknown. To date, the majority of the phytochemical studies on this genus have focused on the isolation of a range of diterpenoids.
The main phytochemical constituents of Plectranthus genus are diterpenoids, phenolics and essential oils. In this work, the focus remains on the diterpenoids and the phenolic compounds (structure depicted in Figure 1.2).[4, 5]
Chapter 1 – Introduction
Figure 1.2 – Example structures of a diterpenoid and a phenolic compound (flavone) found in Plectranthus species. (Adapted from references [3] and [5])
1.2.1.1. Diterpenoids
Diterpenoids belong to a class of naturally occurring secondary metabolites that present a large variety of structures (as can be seen in Figure 1.3). The diterpenes contain four isoprene units, possessing 20 C-atoms and four branched methyl (Me) groups.
Diterpenoids are found mainly in Angiospermae, and amongst Angiospermae, Lamiaceae is one of the families where they are isolated from the most. They are the most common secondary metabolites found in Plectranthus species, being generally identified from the coloured leaf-glands. The majority of them are highly modified abietanoids.[3, 5]
Figure 1.3 – Three examples of the variety of structures that diterpenoids can assume. (Adapted from reference [3])
1.2.1.2. Phenolic compounds
The main compound found in polar extracts from Plectranthus is rosmarinic acid (RA), which is a common component within the subfamily Nepetoideae of the Lamiaceae family. Rosmarinic acid (Figure 1.4) is an ester of caffeic acid and 3,4-dihydroxyphenyl lactic acid. The presence of this caffeic acid ester and also of others, like nepetoidin A (Figure 1.4), permits to distinguish this subfamily. Rosmarinic acid possesses a large variety of biological
6
interests, such as antiviral, antibacterial and antioxidant effects. Thus, its presence in medicinal plants, herbs and spices is beneficial to human health.
Figure 1.4 – Chemical structures of rosmarinic acid (above) and nepetoidin A (below). (Adapted from references [6] and [7])
Other phenolic compounds that have also been found in Plectranthus species are flavonoids. These compounds will be described in the next section.[5-7]
Chapter 1 – Introduction
1.3. Flavonoids
“…Areas dedicated to the cultivation of tea have a low index of all types of cancer…” MEDLINE
About 2% of all carbon photosynthesized by plants is estimated to be converted into flavonoids or related compounds. The list of flavonoids that have already been described reports more than 5000, but it is constantly expanding.[8-10]
1.3.1. Occurrence and Properties
Flavonoids are considered almost universal pigments of plants; they are a large group of phytochemicals mainly found in the petals, the foliage of trees and bushes, being widely distributed in the edible parts of the plants, providing protection against pathogens and herbivores.Although free aglycones have been found in a variety of plants, flavonoids are generally present as O- and/or C-glycosides.[8, 11, 12]
For the plants, flavonoids are responsible for the colour, flavour and aroma of fruits and flowers (Figure 1.5); they also act as enzyme inhibitors, as a defence against insects and ultraviolet (UV) radiation exposure, as chelating agents of metals that are noxious to plants, amongst others.[9, 13]
Figure 1.5 – Colour of flowers and fruits due to the presence of flavonoids.
However, the interest mainly remains in the physiological actions of flavonoids and their beneficial effects on human health. The best known property of flavonoids is their ability to act as antioxidants, by interfering with at least three different free radical-producing systems: they are able to reduce highly oxidizing free radicals, to scavenge nitric oxide, and also to inhibit xanthine oxidase. Due to these antioxidant properties, a lot of
8
flavonoids possess biological activities such as inflammatory, allergic and anti-tumoral.They have been found to be an important constituent of the human diet, being consumed in fresh fruits and vegetables or processed products (Figure 1.6), and are considered to be active principles of various medicinal plants. They are regularly used for the prevention of cancer, dementia, atherosclerosis and coronary heart disease. Thus, flavonoids present in foodstuffs and nutraceuticals have received much attention over the years.[8, 9, 14]
Figure 1.6 – Some foodstuff where flavonoids have been found.
1.3.2. Chemical Structure
All flavonoids present the general structure of a 15-carbon skeleton (aglycone) that consists of two phenyl rings and a heterocyclic ring. According to the differences in the functional groups and their relative position of the aglycone, flavonoids can be divided into several classes, such as isoflavones, flavones, flavonols, amongst others (Figure 1.7).[9, 15]
Figure 1.7 – Basic structures corresponding to the main classes of flavonoids, with the common O- and C-glycosylation positions indicated with an arrow. (Adapted from reference [9])
Chapter 1 – Introduction
1.4. Mass Spectrometry (MS)
Mass spectrometry (MS) is probably the most versatile analytical technique currently available for chemists. It measures precisely the molecular masses of individual compounds, by ionising the atoms or molecules of the sample, separating them by their mass-to-charge (m/z) ratio and detecting them qualitatively and quantitatively by their respective m/z and abundance. Since, in principle, all atomic and molecular ions are accessible by MS, it is considered a universal method for chemical analysis.[16-18]
Mass spectrometric techniques are suitable to analyse flavonoids in plants and foodstuffs, since they can provide significant structural information on small quantities of pure samples as well as on mixtures, and ESI-MS/MS has been shown to be a powerful method for the identification of plant phenolics.[9, 19]
1.4.1. Brief History and Recent Developments
To really appreciate the way that the mass spectrometry field has expanded until the present, it is useful to look back and examine some of the great advances and the people who made them happen.
Although MS is mostly under the purview of analytical chemistry, it was born in the physics field.[20] The birth of MS occurred in 1897 with the studies of Sir J. J. Thomson, studies these that in 1907 led to the construction of a parabola mass spectrograph (first mass spectrometer).[21, 22] In 1906, Thomson received the Nobel Prize in Physics for his work in “discovering” the electron and determining its m/z ratio.[20] As a continuation to his investigations, Thomson and his protégé Francis W. Aston built the first mass spectrometer with velocity focusing. In the first three decades of the 20th century, Aston redesigned the instruments, improving their resolving power and began to use them to separate and prove the existence of elemental isotopes.[23] These studies with isotopes won him his own Nobel Prize in Chemistry, in 1922.[20]
A large contribution to the development of mass spectrometers was the introduction of the electron ionization (EI) source for solids by A. J. Dempster, in 1918[24], and for gases by W. Bleakney, in 1929[25]. Nowadays, this ionization source is used in large scale coupled to gas chromatography (GC).
10
The time-of-flight (TOF) mass analyser and the ion cyclotron resonance (ICR) were introduced in 1946 and in 1949, respectively.[26, 27] In 1953, W. Paul described the quadrupole mass analyser and the ion traps.[28]
The 1960s witnessed the development of tandem MS and collision-induced decompositions[29], being very important in the field of structural analysis. But, in spite of all these improvements, the analysis of molecules of higher molecular weight was not yet possible. The first significant progress occurred in 1966, by M. S. Munson and F. H. Field, who introduced the chemical ionization (CI) technique, allowing the ionization of labile biomolecules.[30]
During the 1980s, a variety of softer ionizations methods were developed to try to solve the problem of the larger molecules. The first technique that had a great impact was fast atom bombardment (FAB), introduced by M. Barber in 1981.[31] Then, matrix-assisted laser desorption ionization - MALDI - (developed by F. Hillenkamp and M. Karas, in 1987)[32] and electrospray - ESI - (developed by J. Fenn, 1988)[33] appeared almost simultaneously. These ionization techniques revolutionized biological MS (the upper mass range was extended beyond 100 kDa) and are still the elected ones for macromolecule ionization.[20] Fenn also demonstrated that is was possible to obtain accuracy in the measurement of molecular weight, by applying a method that accounts the average of the obtained signals for the multiple ions formed during the electrospray process. Fenn, for his work on ESI, and Tanaka, for his laser desorption method of protein ionization, both won the Nobel Prize in Chemistry in 2002.[17, 20, 34, 35]
Recently, we have witnessed new developments in the MS field, such as the introduction of two new ion traps, the orbitrap in 2000, by A. Makarov,[36] and the linear ion trap in 2002, by J. W. Hager.[37] Also recently, a novel interface adapter for the EI technique was developed, allowing a new way of direct coupling to a nano-liquid chromatograph.[38]
Chapter 1 – Introduction 1.4.2. The Mass Spectrometer
Typically, a mass spectrometer consists of five components: an inlet system, an ion source, a mass analyser, an ion detector and a data system (as shown in Figure 1.8).
Figure 1.8 – The five main components of a mass spectrometer. (Adapted from reference [34])
Through the inlet system, a sample is introduced into the mass spectrometer and transferred into the gas phase. The gas phase analytes are then ionized in the ion source and transferred into the mass analyser. It is in the mass analyser that the ions are separated according to their m/z ratio. Except for the FTICR and orbitrap analysers, which also work as a detector, the ion detection is accomplished by an electron multiplier system, where the ion current is multiplied by acceleration of electrons on the surface of an electrode, which originates secondary electrons. This way, by means of an electric signal, the information reaches the data system, which exhibits it as an appropriate mass spectrum. The data system also controls the instrument through feedback.[34, 39]
The MS process (from the ion source to the detector) is carried out under high vacuum. To maintain this vacuum, all mass spectrometers are equipped with a vacuum system. This is necessary to avoid collisions between the ions and other gaseous molecules during their course until reaching the detector. If these collisions occurred, the ions would lose their charge against the walls of the instrument. The high vacuum requires two pumping stages: the first one is a mechanical pump (rotary pump) that provides rough vacuum down to 10-3 torr; the second one uses turbomolecular pumps or diffusion pumps
12
to provide high vacuum (10-5 torr). ICR instruments often include a cryogenic pump for a third pumping stage, due to its even higher vacuum requirements.[39, 40]
1.4.2.1. Ion Source
There is a variety of ionization techniques that can be used in MS. The most important considerations to take into account when making a choice are the internal energy transferred during the ionization process and the physico-chemical properties of the analyte that is going to be analysed. Within these techniques, the most common ones are EI, CI, MALDI and ESI.
In this work, the mass spectrometer used was equipped with an ESI ion source.
1.4.2.1.1. Electrospray (ESI)
The ESI process was first described in 1968 by M. Dole et al,[41] which recognised the possibility of generating gas-phase ions of macromolecules by spraying a solution from the tip of an electrically charged capillary. About two decades later, J. Fenn and co-workers developed ESI as a true interface for MS.[33]
The ESI process (described in Figure 1.9) is generally divided into three main steps: charged droplet formation, droplet shrinkage and gaseous ion formation. A diluted solution of the analyte is passed through a capillary tube with a weak flux (1-10 µl min-1), which is held at high voltage. This high voltage creates an electric field gradient between the capillary and the counter electrode, which induces a charge separation at the liquid surface. Due to surface destabilization the liquid is projected, assuming a cone shape, known as the Taylor Cone (named after Sir G. Taylor). When the liquid that comprises the Taylor cone reaches the Rayleigh stability limit (point when the Coulombic repulsions of the surface charge equal the surface tension of the liquid), droplets that contain an excess of (positive or negative) charge detach from its tip. Then, these droplets move through the atmosphere towards the entrance of the mass spectrometer, and generate gaseous ions by one of the possible mechanisms.[17, 18, 42-44]
Chapter 1 – Introduction
Figure 1.9 – The different stages of the ESI process. (Adapted from reference [45])
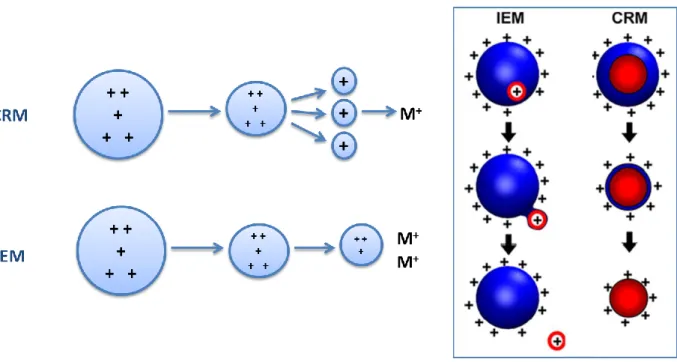
There are mainly two possible mechanisms for the production of gas-phase ions in ESI (Figure 1.10). These are the Charge Residue Model (CRM), proposed by M. Dole In 1968, and the Ion Evaporation Model (IEM), proposed by Iribarne and Thomson in 1979. It is considered that these two models describe the two extremes of the same general process; while the IEM prevails for relatively small ions (m/z < 3300), the CRM seems to be fit for larger multiply charges species.
Figure 1.10 – The two possible mechanisms for the production of gas-phase ions in ESI (CRM and IEM). (Adapted from reference [44])
14
By CRM, solvent evaporation from the charged droplets leads to an increase of electrostatic repulsions at the surface. This causes the droplets to undergo a Rayleigh explosion, originating smaller droplets. Successive divisions result in the production of mono or multicharged droplets that contain only one molecule of the analyte. The IEM predicts that direct ion emission occurs after the droplets suffer shrinkage by solvent evaporation. Recently, J. H. Gross and co-workers suggested a modification of the CRM, in which CRM is preceded by IEM. Regardless of the mechanism by which they are produced, it is certain that the ESI process generates vapour phase ions that can be analysed by their m/z within a mass spectrometer.[39, 42-44, 46]
Octopoles, quadrupoles and lenses are used to transfer the ions from a higher pressure region to a lower pressure region. A nebulizing and drying gas (usually nitrogen) is used to assist in the droplets desolvation process and to prevent the formation of agglomerates or clusters throughout the capillary. The sampling of the fully or partially desolvated ions is made using a capillary or a skimmer device. Skimmers are cones with a small aperture (Figure 1.11) which enable to establish a pressure gradient between the ion source and the mass analyser. The skimmers also acts as a time separator, separating the ions from the sample (heavier) from the molecules (lighter), the solvent and the gas.[42, 47]
Chapter 1 – Introduction 1.4.2.2. Mass Analyser
There are several different types of mass analysers that can be used in MS: sector instruments, quadrupoles and ion traps, time-of-flight, Fourier transform ion cyclotron resonance and orbitraps.
In this work, the mass spectrometer used was equipped with an ion trap type mass analyser, in which a radiofrequency electric field allows the separation of the ions according to their m/z ratio.
1.4.2.2.1. Ion Trap (IT)
Paul and Steinwedel described an IT in 1960[48, 49], and it was modified to a useful mass spectrometer by Stafford et al. in 1984.[50]
The IT mass analyser is formed by two endcap electrodes, which present a hyperbolic geometry, and a ring electrode, positioned in the centre (as can be seen in Figure 1.12).
Figure 1.12 – Components of an IT mass analyser. (Adapted from references [16] and [45])
As shown in Figure 1.13, in this type of analyser, a three dimensional field is created, which confines the ions to the middle of the analyser. This field generates stable trajectories for ions of a certain m/z range, which are sequentially ejected, in direction to the detector. While doing this, it also removes unwanted ions by colliding them with the walls of the IT. Therefore, the mass separation in the IT is achieved by storing the ions in the trapping space and manipulating their motion in time, rather than in space.
16
Figure 1.13 – Trajectory of the ions trough the ion trap. (Adapted from references [39] and [45])
In chemical analysis, the principle advantages of the IT can be summarized as follows:
High sensitivity;
Relatively inexpensive;
Compactness and mechanical simplicity in a device capable of high performance;
Enables tandem mass spectrometry experiments by performing sequential mass analysis measurements;
Ion/molecule reactions can be studied for mass-selected ions.[16, 34, 40, 45]
1.4.3. Tandem Mass Spectrometry (MSn)
Tandem MS involves at least two stages of mass analysis, either in conjunction with a dissociation process or in a chemical reaction that causes a change in the mass or charge of an ion. Generally, a first mass analyser is used to isolate the precursor ion (mp+), which then
suffers fragmentation to yield product ions (mf+) and neutral fragments (mn) that are then
analysed by a second mass analyser:
An activation barrier must be overtaken so this reaction can occur. The energy required for such process can come from one of two sources:
Chapter 1 – Introduction I. From the excess energy deposited on the precursor ion by the ionization process. This is valid only when dealing with electron ionization at high energies.
II. From activation methods such as collision induced dissociation (CID), infrared multiphoton dissociation (IRMPD), electron capture/electron transfer dissociation (ECD/ETD) and surface induced dissociation (SID).[17]
The principle of tandem MS is shown in the figure below (Figure 1.14). A precursor ion is isolated by the first mass analyser, fragmented by collision with an inert gas and the product ions are then analysed by the second mass spectrometer.
Figure 1.14 – The principle behind tandem MS. (Adapted from reference [17])
MS3 experiments are possible to perform by increasing the number of steps: select ions of a first mass, then select ions of a second mass from the fragments, obtain and finally analyse the fragments of these last selected ions. The number of steps can be increased further to yield an MSn experiment. Nevertheless, this will certainly increase the complexity of the instrument and consequently its cost.
Tandem MS can be conceived in two ways: in space, by the coupling of two mass spectrometers (quadrupole type analysers and TOF); or in time, by performing an appropriate sequence of events in an ion storage device (IT and ICR). In this process, the ion activation step is crucial and defines the type of product ions that are observed. There are several activation methods that can be used. In this work, the tandem MS experiments were performed by CID, to enable structural information of the compounds.
CID is still the most common ion activation method available. The ion activation is achieved by collisions between the precursor ion and a neutral gas target (helium), which is accompanied by an increase in the internal energy. This increase leads to the decomposition of the ion. In an IT, the CID occurs actually in the trap, which works as collision chamber. The
18
sample ions are accelerated and collide with the background helium gas, which leads to their fragmentation.
One of the main advantages of tandem MS, in addition with its enhanced specificity, is that the sample does not need to undergo a prior purification, because one is able to select and isolate the ion of interest.[17, 34, 51, 52]
I feel sure that there are many problems in Chemistry which could be solved with far greater ease by this than by any other method. The method is surprisingly sensitive – more so even than that of spectrum analysis – requires an infinitesimal amount of material and does not require this to be specially purified…
Chapter 1 – Introduction
1.5. High-Performance Liquid Chromatography (HPLC)
Since the components of herb samples are very complex, selective and efficient analytical methods are required to determine their structures. HPLC-MS/MS allows the separation and identification of individual molecules in complex samples, being the general choice.
How flavonoids are moderately polar, thermolabile compounds, they are best analysed with HPLC. Obviously, and especially if identification of individual flavonoids is important, advanced hyphenated techniques are used (HPLC-MS or HPLC-MS/MS).[19, 51]
Liquid chromatography (LC) was defined in the early 1900s through the work of the Russian botanist M. S. Tswett. His studies involved separating compounds (leaf pigments), extracted from plants using a solvent, in a column packed with particles. He observed different coloured bands separating throughout the column. Tswett then coined
chromatography to describe his experiment.[53] In the 1960s HPLC was developed as an
analytical tool, being in these days one of the most powerful ones in analytical chemistry.[54, 55]
20
1.5.1. The HPLC System
A modern HPLC system, as presented in Figure 1.15, is generally composed by a solvent delivery system, a sample injection valve, a high-pressure column, a detector, and a computer, which controls the system and displays the results. Many systems also include an oven that controls the temperature of the column. As columns are expensive and easily degraded, some equipment possess a short guard column at the entrance of the main column, which protects it from impurities that could reduce its durability.[45, 56]
Figure 1.15 – Components of a typical HPLC system.
1.5.2. The Chromatographic Process
The successful use of HPLC requires the right combination of operating conditions, such as the separating temperature, the type of mobile phase and its flow rate, and so on. To select these best conditions it is important to understand various factors that control the HPLC separation.
Differential migration constitutes the basis of chromatography separation. It results from the equilibrium distribution of the different compounds between the stationary phase (fixed to a column or surface) and the mobile phase (that in HPLC is liquid). Normal-phase chromatography uses a polar stationary phase and a less polar solvent. On the other hand, in reversed-phase chromatography the stationary-phase is nonpolar or weakly polar and the solvent is more polar. The choice of these phases is made based on the type of sample and the compounds to be analysed. Also based on these factors is the choice of the type of elution (isocratic elution or gradient elution). Isocratic elution is performed with a constant
Chapter 1 – Introduction composition of eluent over time, while in gradient elution the composition of the eluent varies with time.
As shown in Figure 1.16, the compounds pass through the column according to their affinity for both phases, and as they reach the end of the column they are carried off to the detected and their concentrations are recorded in function of time, which is presented in form of a chromatogram.
Figure 1.16 – Representation of the chromatographic process. (Adapted from reference [45])
Each peak of the chromatogram emerges from the column at a characteristic time, which can be used to identify the compounds. The retention time (tR) is measured since the
time the sample is injected to the time the first peak maximum leaves the column. The difference between the retention time and the time required for the mobile phase or an unretained solute to pass through the column (tm) is denominated adjusted retention time
(t’r) (Equation 1.1).
Equation 1.1
Another important feature in chromatography is the selectivity (α) (Equation 1.2), in other words, the capability of an analytical method to distinguish an analyte from other species in the sample. The selectivity between two peaks is determined by the ratio between the adjusted retention times of the two compounds. The higher the selectivity is, better will be the separation between the two components.
22
The efficiency, also important in chromatography, consists in the column’s capacity to limit the spreading of the peaks and therefore offer higher resolution. Thus, the straighter the peaks are, higher the resolution, so better the separation between two compounds. The efficiency of the column is generally measured by the number (N) (Equation 1.3) and height (H) (Equation 1.4) of the theoretical plates. Smaller the height of the plates, straighter the peaks are. So, in other words, for the column to reach maximum efficiency it should have a large number of theoretical plates with small height.[45, 56]
Equation 1.3 ( ) N: number of theoretical plates;
tR: retention time;
W: peak width.
Equation 1.4
H: height equivalent to a theoretical plate; L: column length;
N: number of theoretical plates.
1.5.3. LC-MS Interface
The development of coupled instrumental systems such as LC-MS helped to overcome some disadvantages of the manual methods and allowed the qualitative identification of unknown peaks. Several methods have been proposed for direct coupling, but there is no single LC-MS interface for all samples or all LC conditions.[56]
LC-MS is an “odd coupling”. First, due of the nature of the analytes; since LC-MS is preferred over gas chromatography because of the higher polarity and lower volatility of the samples and one of the prerequisites of MS analysis is the formation of volatilized ions. Second, and harder to solve, is the necessary elimination of the mobile phase, because MS functions in gaseous phase. Beyond that, a flow-rate of 1 mL min-1 is far too much to be handled by standard MS vacuum systems. Therefore, to obtain a lower flow, we can use a flow splitter at the exit of the column (in case of analytical columns ID 0.46cm), or a straighter column (ID 0.21cm), which can work at lower flows (0.2 mL min-1).[57]
Chapter 1 – Introduction
1.6
References
[1] S.S. Nielsen; Food Analysis; 3rd edition. New York; Springer New York; 2003.
[2] P.C. Dinis, P.L. Falé, P.J.A. Madeira, M.H. Florêncio, M.L. Serralheiro; Acetylcholinesterase
Inhibitory Activity After in vitro Gastrointestinal Digestion of Infusions of Mentha Species.
European Journal of Medicinal Plants. 3 (2003) 381-93.
[3] M. Abdel-Mogib, H. Albar, S. Batterjee; Chemistry of the Genus Plectranthus. Molecules. 7 (2002) 271-301.
[4] C.W. Lukhoba, M.S.J. Simmonds, A.J. Paton; Plectranthus: A review of ethnobotanical
uses. Journal of Ethnopharmacology. 103 (2006) 1-24.
[5] S. Waldia, B.C. Joshi, U. Pathak, M.C. Joshi; The Genus Plectranthus in India and Its
Chemistry. Chemistry & Biodiversity. 8 (2011) 244-52.
[6] R. Kubínová, E. Švajdlenka, K. Schneiderová, Z. Hanáková, S. Dall'Acqua, O. Farsa;
Polyphenols and diterpenoids from Plectranthus forsteri ‘Marginatus’. Biochemical
Systematics and Ecology. 49 (2013) 39-42.
[7] M. Petersen, M.S.J. Simmonds; Rosmarinic acid. Phytochemistry. 62 (2003) 121-5.
[8] N. Fabre, I. Rustan, E. de Hoffmann, J. Quetin-Leclercq; Determination of flavone,
flavonol, and flavanone aglycones by negative ion liquid chromatography electrospray ion trap mass spectrometry. Journal of the American Society for Mass Spectrometry. 12 (2001)
707-15.
[9] F. Cuyckens, M. Claeys; Mass spectrometry in the structural analysis of flavonoids. Journal of Mass Spectrometry. 39 (2004) 1-15.
[10] K.B. Pandey, S.I. Rizvi; Plant polyphenols as dietary antioxidants in human health and
disease. Oxidative Medicine and Cellular Longevity. 2 (2009) 270-8.
[11] R.E. March, E.G. Lewars, C.J. Stadey, X.-S. Miao, X. Zhao, C.D. Metcalfe; A comparison of
flavonoid glycosides by electrospray tandem mass spectrometry. International Journal of
Mass Spectrometry. 248 (2006) 61-85.
[12] Y.L. Ma, Q.M. Li, H. Van den Heuvel, M. Claeys; Characterization of flavone and flavonol
aglycones by collision-induced dissociation tandem mass spectrometry. Rapid
Communications in Mass Spectrometry. 11 (1997) 1357-64.
[13] A. Wojakowska, A. Piasecka, P.M. García-López, F. Zamora-Natera, P. Krajewski, Ł. Marczak, et al.; Structural analysis and profiling of phenolic secondary metabolites of
24
[14] P.J.A. Madeira, C.M. Borges, M.H. Florêncio; Electrospray ionization Fourier transform
ion cyclotron resonance mass spectrometric and semi-empirical calculations study of five isoflavone aglycones. Rapid Communications in Mass Spectrometry. 24 (2010) 3432-40.
[15] J. Zhang, M.B. Satterfield, J.S. Brodbelt, S.J. Britz, B. Clevidence, J.A. Novotny; Structural
Characterization and Detection of Kale Flavonoids by Electrospray Ionization Mass Spectrometry. Analytical Chemistry. 75 (2003) 6401-7.
[16] P.S.H.W.a.R.G. Cooks; Ion Trap Mass Spectrometry. Current Separations and Drug Development. 16 (1997) 1-8.
[17] P.J.A. Madeira, M.H. Florêncio; Applications of Tandem Mass Spectrometry: From Structural Analysis to Fundamental Studies. In: Tandem Mass Spectrometry - Applications
and Principles; 1st edition. Croatia; InTech; 2012. p. 3-32.
[18] J. Barker; Mass Spectrometry; 2nd edition. Chichester; Wiley & Sons; 1999.
[19] G. Zeng, H. Xiao, J. Liu, X. Liang; Identification of phenolic constituents in Radix Salvia
miltiorrhizae by liquid chromatography/electrospray ionization mass spectrometry. Rapid
Communications in Mass Spectrometry. 20 (2006) 499-506.
[20] J. Griffiths; A Brief History of Mass Spectrometry. Analytical Chemistry. 80 (2008) 5678-83.
[21] J.J. Thomson; Cathode Rays. Philosophical Magazine Series. 5 44(269) (1897) 293-316. [22] J.J. Thomson; On Rays of Positive Electricity. Philosophical Magazine Series. 6 13(77) (1907) 561-75.
[23] F.W. Aston; A positive ray spectrograph. Philosophical Magazine Series. 6 38(228) (1919) 707 - 14.
[24] A.J. Dempster; A new Method of Positive Ray Analysis. Physical Review. 11(4) (1918) 316-25.
[25] W. Bleakney; A New Method of Positive Ray Analysis and Its Application to the
Measurement of Ionization Potentials in Mercury Vapor. Physical Review. 34(1) (1929)
157-60.
[26] H. Sommer, H.A. Thomas, e. al.; The Measurement of e/M by Cyclotron Resonance. Physical Review. 82(5) (1951) 697-702.
[27] M.M. Wolff, W.E. Stephens; A Pulsed Mass Spectrometer with Time Dispersion. Review of Scientific Instruments. 24(8) (1953) 616-7.
[28] W. Paul, H. Steinwedel; A New Mass Spectrometer without a Magnetic Field. Zeitschrift für Naturforschung A. 8 (7) (1953) 448–50.
Chapter 1 – Introduction [29] K.R. Jennings; Collision-induced decompositions of aromatic molecular ions. International Journal of Mass Spectrometry and Ion Physics. 1(3) (1968) 227-35.
[30] M.S.B. Munson, F.H. Field; Chemical Ionization Mass Spectrometry. I. General
Introduction. Journal of the American Chemical Society. 88(12) (1966) 2621-30.
[31] M. Barber, R.S. Bordoli, e. al.; Fast atom bombardment of solids (F.A.B.): a new ion
source for mass spectrometry. Journal of the Chemical Society, Chemical Communications. 7
(1981) 325-7.
[32] M. Karas, F. Hillenkamp; Laser desorption ionization of proteins with molecular masses
exceeding 10,000 daltons. Analytical Chemistry. 60(20) (2002) 2299-301.
[33] J.B. Fenn, M. Mann, e. al.; Electrospray ionization for mass spectrometry of large
biomolecules. Science. 246(4926) (1989) 64-71.
[34] E.d. Hoffmann, V. Stroobant; Mass Spectrometry Principles and Applications; 3rd edition. West Sussex; Wiley & Sons; 2007.
[35] T.F.P. Jorge; Nutrientes e suplementos nutricionais em vegetais e frutos frequentemente
usados na dieta: estudo por espectrometria de massa do resveratrol nas uvas. Lisboa;
Universidade de Lisboa; 2012.
[36] A. Makarov; Electrostatic Axially Harmonic Orbital Trapping: A High-Performance
Technique of Mass Analysis. Analytical Chemistry. 72 (2000) 1156-62.
[37] J.W. Hager; A new linear ion trap mass spectrometer. Rapid Communications in Mass Spectrometry. 16 (2002) 512-26.
[38] C. Flender, C. Wolf, P. Leonhard, M. Karas; Nano-liquid chromatography—direct
electron ionization mass spectrometry: improving performance by a new ion source adapter.
Journal of Mass Spectrometry. 46 (2011) 1004-10.
[39] P.J.A. Madeira; A mass spectrometry study of compounds with environmental and
biological interest. Lisboa; Universidade de Lisboa; 2010.
[40] S.E.V. Bramer; An Introduction to Mass Spectrometry; Chester; Widener; 1998.
[41] M. Dole, L.L. Mack, R.L. Hines, R.C. Mobley, L.D. Ferguson, M.B. Alice; Molecular Beams
of Macroions. Journal of Chemical Physics. 49 (5) (1968) 2240-9.
[42] S.J. Gaskell; Electrospray: Principles and Practice. Journal of Mass Spectrometry. 32 (1997) 677-88.
[43] N.B. Cech, C.G. Enke; Practical implications of some recent studies in electrospray
26
[44] L. Konermann, E. Ahadi, A.D. Rodriguez, S. Vahidi; Unraveling the Mechanism of
Electrospray Ionization. Analytical Chemistry. 85 (2012) 2-9.
[45] D.C. Harris; Quantitative Chemical Analysis; 8th edition. New York; Clancy Marshall; 2010.
[46] J. Irbarne, B. Thomson; On the evaporation of small ions from charged droplets. Nature Biotechnology. 64 (1976) 2287-94.
[47] A.R.R. Gomes; Correlação da função antioxidante com a energia de ligação O-H em
compostos fenólicos. Lisboa; Universidade de Lisboa; 2012.
[48] W. Paul, H. Steinwedel; Apparatus for Separating Charged Particles of Different Specific
Charges. 1956: German Patent.
[49] W. Paul, H. Steinwedel; Apparatus for separating charged particles of different specific
charges. 1960: US Patent.
[50] G.C. Stafford, P.E. Kelley, J.E.P. Syka, W.E. Reynolds, J.F.J. Todd; Recent Improvements In
and Analytical Applications of Advanced Ion Trap Technology. International Journal of Mass
Spectrometry and Ion Processes. 60 (1984) 85-98.
[51] A.K. Shukla, J.H. Futrell; Tandem mass spectrometry: dissociation of ions by collisional
activation. Journal of Mass Spectrometry. 35 (2000) 1069-90.
[52] K.R. Jennings; Analytical applications of ion activation techniques. International Journal of Mass Spectrometry. (2014) http://dx.doi.org/10.1016/j.ijms.2014.05.017.
[53] M. Tswett; Physical-chemical studies of chlorophyll. Adsorption. Berichte der Deutschen botanischen Gesellschaft. 24 (1906) 316-26.
[54] http://www.medicinal-chemistry.org/files/harki/TTL%20Presentation_Jan2013.pdf; 26 February 2014.
[55] http://www.waters.com/waters/pt_PT/HPLC---High-Performance-Liquid-Chromatography/nav.htm?cid=10048919&locale=pt_PT; 26 February 2014.
[56] L.R. Snyder, J.J. Kirkland, J.W. Dolan; Introduction to Modern Liquid Chromatography; 3rd edition. New Jersey; Wiley & Sons; 2010.

![Figure 1.13 – Trajectory of the ions trough the ion trap. (Adapted from references [39] and [45])](https://thumb-eu.123doks.com/thumbv2/123dok_br/15247466.1023790/46.892.138.751.89.384/figure-trajectory-ions-trough-ion-trap-adapted-references.webp)