*Correspondence: F. H. A. Nogueira. Laboratório de Controle de Qualidade de Produtos Farmacêuticos e Cosméticos, Departamento de Produtos Farmacêuti-cos, Faculdade de Farmácia, Universidade Federal de Minas Gerais. Av. Pres. Antônio Carlos, 6627, Sala 4029 Bloco 2, 31270-901 - Belo Horizonte - MG, Brasil. E-mail: [email protected]
A
vol. 49, n. 4, oct./dec., 2013
Development and validation of an HPLC method for the
simultaneous determination of artesunate and mefloquine
hydrochloride in fixed-dose combination tablets
Fernando Henrique Andrade Nogueira
*, Naialy Fernandes Araújo Reis, Paula Rocha Chellini,
Isabela da Costa César, Gerson Antônio Pianetti
Department of Pharmaceutical Products, Faculty of Pharmacy, Federal University of Minas Gerais, MG, Brazil
The present study developed and validated an HPLC method for the simultaneous determination of
artesunate (AS) and meloquine hydrochloride (MQ) in ixed-dose combination tablets, according to ICH guidelines. The chromatographic separation was carried out on an XBridge C18 (250 x 4.6 mm i.d.,
5 µm particle size, Waters) analytical column. The mobile phase included a 0.05 M monobasic potassium
phosphate buffer (pH adjusted to 3.0 with phosphoric acid) and acetonitrile (50 + 50, v/v). The low
rate was 1.0 mL/min, and the run time was 13 minutes. A dual-wavelength approach was employed: AS detection was performed at 210 nm and MQ was detected at 283 nm, using a diode array detector. Stability of sample solutions was evaluated for 8 hours after preparation, during which time the solutions remained stable. Youden’s test was employed to evaluate robustness. The method proved to be linear (r2>0.99), precise (RSD<2.0%), accurate, selective, and robust, proving to be appropriate for routine
drug quality control analysis.
Uniterms:Artesunate/determination. Meloquine hydrochloride/determination. High performance liquid chromatography/qualitative analysis. Fixed-dose combination tablets/qualitative analysis.
Um método por cromatograia a líquido de alta eiciência para a determinação simultânea de artesunato (AS) e cloridrato de meloquina (MQ) em comprimidos em dose ixa combinada foi desenvolvido e validado, de acordo com as normas do ICH. A separação cromatográica foi realizada com uma coluna analítica XBridge C18 (250 x 4,6 mm d.i., partículas de 5 µm, Waters). A fase móvel foi constituída de tampão fosfato monobásico de potássio 0,05 M (pH ajustado para 3,0 com ácido fosfórico) e acetonitrila (50 + 50, v/v). O luxo da fase móvel foi de 1,0 mL/min e o tempo de corrida foi de 13 minutos. Utilizaram-se dois comprimentos de onda: a detecção do AS foi realizada em 210 nm e a de MQ foi realizada em 283 nm, utilizando-se um detector de arranjo de diodos. A estabilidade das soluções padrão e amostra foi avaliada por 8 horas após sua preparação e as soluções permaneceram estáveis nesse período. O teste de Youden foi empregado para a avaliação da robustez do método. O método se mostrou linear (r2>0,99),
preciso (DPR<2,0%), exato, seletivo e robusto, sendo adequado para análises rotineiras de controle de qualidade dos medicamentos.
Unitermos: Artesunato/determinação. Cloridrato de meloquina/determinação. Cromatograia líquida de alta eiciência/análise qualitativa. Comprimidos em dose ixa combinada/análise qualitativa.
INTRODUCTION
New antimalarial regimens have been deemed
sulfadoxine-pyrimethamine, and artesunate-mefloquine are recommended by the World Health Organization (WHO) for the treatment of uncomplicated P. falciparum malaria (WHO, 2011a). ACT is based on the use of two drugs with different modes of action: an artemisinin-derivative that rapidly clears asexual blood stage parasites and gametocytes, as well as a partner drug that has a longer half-life, thus eliminating residual parasites (Varotti et al., 2008).
Artesunate(AS)-Meloquine hydrochloride(MQ)--ASMQ–ixed-dose combination tablets are Brazil’s ACT choice for the treatment of uncomplicated falciparum malaria. Two tablet strengths are currently available: 25 mg of AS and 55 mg of MQ (corresponding to 50 mg of meloquine base) for children and 100 mg of AS and 220 mg of MQ (corresponding to 200 mg of meloquine base) for adults. The use of AS and MQ in a ixed-dose tablet formulation considerably reduces the possible appearance of a resistant parasite, given that the parasites are never exposed to the artemisinin derivative alone and that mefloquine contains a small residual biomass to eradicate at a time of maximum blood concentration (White, Olliaro, 1996). Chemical structures of AS and MQ are shown on Figure 1.
To date, neither pharmacopeial monographs nor methods have been reported in scientific literature to determine AS and MQ in ixed-dose combination tablets. Analytical methods to determine AS and MQ in ixed-dose combination tablets are needed to evaluate their quality in endemic areas, as well as to detect counterfeit drug products (Martino, 2010). One method in which to determine AS in tablets is described in the International Pharmacopoeia (World, 2011b), whereas a method to determine MQ in tablets is described in the Brazilian Pharmacopeia (Brasil, 2010). Methods for the single determination of AS or MQ in tablets were also found
in prior scientific literature (Nogueira et al., 2011; Gaudiano et al., 2006; Ranher et al., 2010). In addition, the simultaneous assay of AS and MQ in plasma (Hodel et al., 2009) and a method presenting a single extraction procedure and two HPLC systems to determine AS and MQ in human plasma have been published in the literature (Lai et al., 2007).
Hence, the present study aimed to develop and validate an HPLC method, using dual-wavelength UV detection, to simultaneously quantify AS and MQ in ixed-dose combination tablets. As AS and MQ present different maximum wavelengths in their UV spectra, detection was performed at 210 nm (for AS quantiication) and 283 nm (for MQ quantiication). The dual wavelength approach eliminated the standard addition procedure performed in a previous study of artemether and lumefantrine in a ixed-dose combination tablet (César et al., 2008). Stability of standard and sample solutions was also investigated due the instability of AS in aqueous solutions (Gaudin et al., 2007). The validated method was applied to the analysis of tablets containing the AS and MQ associations (25 + 55 mg).
EXPERIMENTAL
Material and reagents
AS and MQ reference standards were purchased from U.S. Pharmacopeial Convention (Rockville, MD, USA). ASMQ tablets containing 25 mg of AS and 55 mg of MQ were produced by Farmanguinhos/FIOCRUZ (Rio de Janeiro, Brazil). Concerning croscarmellose sodium, microcrystalline cellulose, magnesium stearate, opadry white and blue lake FDC 2, all excipients of the formulation, were donated by Farmanguinhos/ FIOCRUZ. Acetonitrile was obtained from Tedia (Fairfield, OH, USA) and from Honeywell (Seelze, Germany), the latter used only in the robustness study. Ultrapure water was obtained from a Millipore Direct-Q system (Billerica, MA, USA). Monobasic potassium phosphate and phosphoric acid were purchased from Merck (Darmstadt, Germany).
Instrumental and Analytical Conditions
The HPLC analyses were carried out using an Agilent 1100 system (Santa Clara, CA, USA), composed of quaternary pump, autosampler, diode array detector (DAD), and HP ChemStation Software. Chromatographic s e p a r a t i o n w a s c a r r i e d o u t o n a n X B r i d g e C 1 8 (250 x 4.6 mm i.d., 5 µm particle size) analytical column FIGURE 1 - Chemical structures of artesunate (AS) and
from Waters (Milford, MA, USA), maintained at 30 oC. UV detection was performed at 210 nm for AS quantiication and at 283 nm for MQ quantiication. UV spectra from 200 to 400 nm were online recorded for peak identification. The injection volume for all solutions was 20 μL. The optimized mobile phase was a mixture of 0.05 M monobasic potassium phosphate (pH adjusted to 3.0 with phosphoric acid) and acetonitrile (50 + 50, v/v). To determine k, t0 was estimated by injecting a 0.01% (w/v) NaNO3 solution onto the chromatograph.
An Agilent 1200 system and an ACE column (250 x 4.6 mm i.d., 5 µm particle size) from Advanced Chromatography Technologies – ACT (Aberdeen, Scotland, UK) were also employed in the robustness study.
Preparation of standard solutions
Approximately 12.5 mg of AS and 27.5 mg of MQ reference standards were accurately weighed and transferred to a 25 mL volumetric flask, followed by the addition of 20 mL of mobile phase. The flask was sonicated for 10 minutes and then illed to the mark with mobile phase to obtain a solution at 0.5 mg/mL of AS and 1.1 mg/mL of MQ.
Analysis of fixed-dose combination tablets
Twenty tablets, containing 25 mg of AS and 55 mg of MQ each, were crushed, and an accurately weighed portion of the powder, equivalent to about 25 mg of AS, was transferred to a 50 mL volumetric lask followed by the addition of 40 mL of mobile phase. The flask was sonicated for 10 minutes and illed to the mark with mobile phase, with theoretical sample concentrations of AS and MQ registered at 0.5 mg/mL and 1.1 mg/mL, respectively. The amounts of AS and MQ in the samples were calculated using a one-point calibration. Standard solutions were injected five times and sample solutions once. AS and MQ peak areas were measured, and their concentration was calculated using the average standard response factor (peak area divided by standard concentration).
Validation of the method
Selectivity
Spectral purities of AS and MQ chromatographic peaks were evaluated using the UV spectra recorded by a diode array detector. A solution containing a mixture of tablet excipients was also prepared according to the sample preparation procedure and injected onto the chromatograph to evaluate possible interfering peaks.
Linearity
Standard solutions containing 2.5 mg/mL of AS and 5.5 mg/mL of MQ were prepared in triplicate. Aliquots of these solutions were diluted in the mobile phase to ive different concentrations: 0.250, 0.375, 0.500, 0.625, and 0.750 mg/mL of AS and 0.550, 0.825, 1.100, 1.375, and 1.650 mg/mL of MQ. Calibration curves of concentration versus area were plotted, and the obtained data were subjected to regression analysis using the least-squares method.
Precision
The intra-day precision was evaluated by analyzing six samples (n = 6) at 100% of the test concentration (0.5 mg/mL of AS and 1.1 mg/mL of MQ). Samples were prepared as set forth in Analysis of ixed-dose combination
tablets. Similarly, the inter-day precision was evaluated on two consecutive days (n = 12). The AS and MQ contents (% of labeled amount) were determined, and the RSD was calculated. A Student’s t test was employed to compare the average content of AS and MQ obtained in the two consecutive days.
Accuracy
Accuracy was investigated by means of a standard addition experiment. Amounts of AS (11.25, 17.50, and 23.75 mg) and MQ (24.75, 38.50, and 68.75 mg) were added to tablet powder, corresponding to 7.5 mg of AS and 16.5 mg of MQ (0.3 average tablet weight). The mixture was transferred to a 50 mL volumetric flask, and the volume was completed with mobile phase. The accuracy was investigated at three concentration levels: 75, 100, and 125 percent of the theoretical concentrations of AS and MQ. At each level, the solutions were prepared in triplicate, and the recovery percentage was calculated.
Robustness
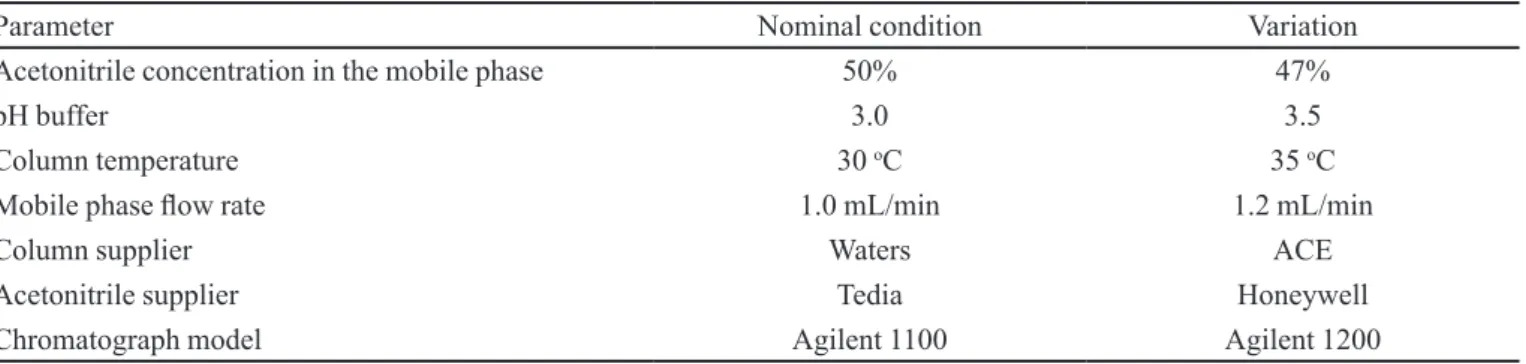
Method robustness was assessed by determining the AS and MQ contents in tablets through a series of eight experiments following a factorial design (Youden, Steiner, 1975). The seven analytical parameters employed, as well as the introduced variations, are shown in Table I. A standard and a sample solution were prepared for each condition, and were injected three times onto the chromatograph. Peak area, retention time, tailing factor, theoretical plate number, and the contents of AS and MQ in the tablets were evaluated for each condition.
Stability of solutions
as described above, and were injected onto the chromatograph, at each hour, for 8 consecutive hours. The presence of additional peaks that could indicate AS or MQ degradation and/or the decrease of AS or MQ peak areas were evaluated.
RESULTS AND DISCUSSION
Optimization of the chromatographic conditions
Initial experiments were carried out with the chromatographic conditions to determine the meloquine hydrochloride content in tablets (Nogueira et al., 2011). The mobile phase was a mixture of 0.05 M phosphate buffer pH 3.5 and methanol (40 + 60, v/v). MQ and AS retention factors (k) were 3.04 and 6.18, respectively. The resolution between the two peaks was greater than 10.0, and the run time was 40 minutes. Methanol presents a UV cutoff at 205 nm, which could therefore not be employed in the mobile phase to determine the AS content, given that AS only presents UV absorption in the initial wavelengths of the UV spectrum (200-220 nm) due to the absence of chromophores in its structure. Thus, methanol was replaced by acetonitrile in the mobile phase. The acetonitrile proportion was adjusted to 50% to maintain the same solvent strength of the previous mobile phase (methanol + buffer). The acetonitrile proportion was calculated using a nomograph.
A simultaneous quantification of AS and MQ, using the wavelength of 210 nm, proved to be impossible due to the excessive broadening of the MQ peak at this wavelength. Thus, simultaneous quantiication proved to be possible, using a wavelength of 210 nm to quantify AS and a wavelength of 283 nm to quantify MQ. The run time was 13 minutes, and the retention factors (k) for MQ and AS were approximately 0.66 and 3.26, respectively. The resolution between MQ and AS peaks was 6.9.
Method Validation
Selectivity
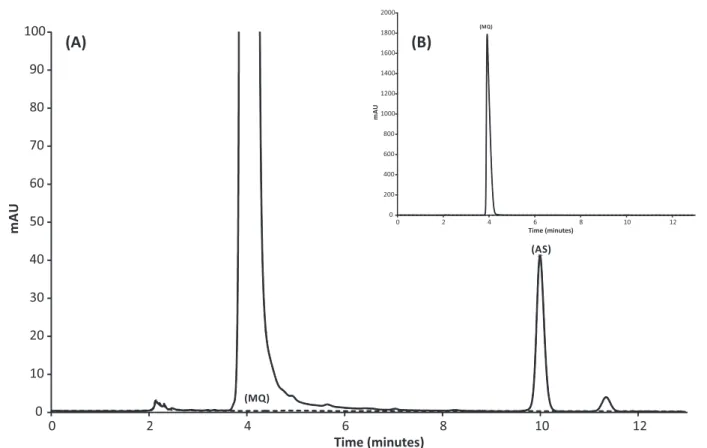
Peak purity of higher than 99.0% was obtained for AS in the chromatograms of sample solutions, demonstrating that other compounds did not co-elute. MQ peak purity could not be assessed due to the large analyte concentration used. The chromatograms obtained with the mixture of tablet excipients showed no interfering peaks in the same retention time of AS and MQ. The overlaid chromatograms of the sample solution and the mixture of excipients, at 283 nm and at 210 nm, are shown in Figure 2 and Figure 3, respectively.
Linearity
A linear correlation was found between the peak areas and the concentrations of AS and MQ in the assayed range. The regression analysis data are shown in Table II. The regression coeficient (r2) obtained in this phase was
higher than 0.99 for both compounds, which attests to the linearity of the method.
Precision
Mean contents of AS and MQ in the intra-day precision analyses (n=6) was 96.17% (RSD=1.38%) and 100.07% (RSD=1.41%) of their labeled amounts, respectively. For the inter-day precision (n=12), the mean contents obtained were 96.39% (RSD=1.19%) and 100.00% (RSD=1.01%) for AS and MQ, respectively. The RSD values below 2.0% indicated the high-level precision of the method.
Accuracy
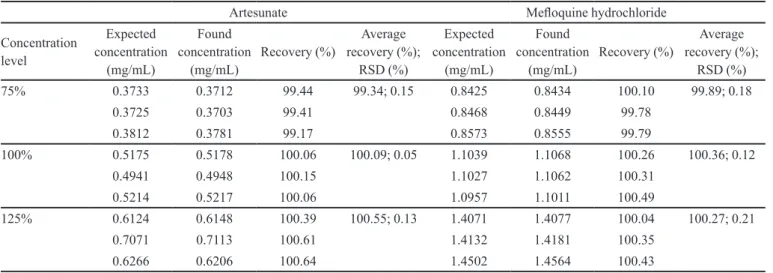
Accuracy was investigated by means of a standard addition experiment. Table III shows both the expected concentrations of AS and MQ and the recovery percentages. All values were within the speciied limits, between 98.0 and 102.0% of the theoretical concentration.
TABLE I - Analytical parameters and variations for the robustness evaluation of the chromatographic method for simultaneous AS and MQ quantiication
Parameter Nominal condition Variation
Acetonitrile concentration in the mobile phase 50% 47%
pH buffer 3.0 3.5
Column temperature 30 oC 35 oC
Mobile phase low rate 1.0 mL/min 1.2 mL/min
Column supplier Waters ACE
Acetonitrile supplier Tedia Honeywell
TABLE II - Overview of the linearity data for AS and MQ
Regression parameter Artesunate Meloquine hydrochloride
r2 0.9997 0.9997
Slope ± SE 913.9 ± 4.716 16080 ± 76.00
Intercept ± SE -6.328 ± 2.547 36.71 ± 89.39
RSD, % 0.86 0.51
Concentration range (mg/mL) 0.25 – 0.75 0.55 – 1.65
Number of points 5 5
FIGURE 2 - (A) - Overlay of the chromatogram of the sample solution (full line, λ = 210 nm) and the chromatogram of the mixture
of excipients (dotted line), optimized mobile phase, showing both meloquine hydrochloride (MQ) and artesunate (AS) peaks. (B) - overlay of the chromatogram of the sample solution (full line, λ = 283 nm) and the chromatogram of the mixture of excipients (dotted line), using the optimized mobile phase, showing the meloquine hydrochloride (MQ) peak.
Robustness
Effects of the variation of analytical parameters in content, retention time, tailing factor, and theoretical plate number are shown in Table IV. In general, the variation of the low rate and the column supplier were responsible for the greatest differences in the plate number for AS and MQ. Other factors remained practically unchanged.
Stability of solutions
No changes in the retention time could be observed for AS and MQ peaks after 8 hours. Likewise, no additional
peaks were observed. A negligible reduction (about 1.2%) of the AS peak area was observed when the initial peak area (zero time) and the area of AS peak after 8 hours of preparation were compared. Despite this small reduction in the AS peak area, the recommendation was to inject the solutions as soon as they had been prepared. MQ peak areas remained practically unchanged after 8 hours of analysis.
Analysis of fixed-dose combination tablets
using the validated method. The samples presented AS and MQ contents that proved to be very close to the labeled amount. The AS content in samples varied from 94.12% to 97.99%, while the MQ content varied from 97.80% to 102.25%.
CONCLUSION
This study is the irst report which simultaneously quantiies the artesunate and meloquine hydrochloride content in ixed-dose combination tablets. The method proved to be selective, linear, precise, accurate, and robust.
In addition, the two drugs were separated by an adequate run time of 13 minutes. The developed method proved to be a simple and suitable technique to quantify these antimalarials and can therefore be employed for routine quality control analysis.
ACKNOWLEDGEMENTS
This study was inancially supported by the Brazilian Pharmacopeia. The authors would like to thank Dr. Núbia Boechat at Farmanguinhos/FIOCRUZ for the donations of the sample.
TABLE III - Results of the recovery analysis of AS and MQ in tablets
Artesunate Meloquine hydrochloride
Concentration level Expected concentration (mg/mL) Found concentration (mg/mL) Recovery (%) Average recovery (%); RSD (%) Expected concentration (mg/mL) Found concentration (mg/mL) Recovery (%) Average recovery (%); RSD (%)
75% 0.3733 0.3712 99.44 99.34; 0.15 0.8425 0.8434 100.10 99.89; 0.18
0.3725 0.3703 99.41 0.8468 0.8449 99.78
0.3812 0.3781 99.17 0.8573 0.8555 99.79
100% 0.5175 0.5178 100.06 100.09; 0.05 1.1039 1.1068 100.26 100.36; 0.12
0.4941 0.4948 100.15 1.1027 1.1062 100.31
0.5214 0.5217 100.06 1.0957 1.1011 100.49
125% 0.6124 0.6148 100.39 100.55; 0.13 1.4071 1.4077 100.04 100.27; 0.21
0.7071 0.7113 100.61 1.4132 1.4181 100.35
0.6266 0.6206 100.64 1.4502 1.4564 100.43
TABLE IV - Effects of the analytical parameters in content, retention time (Rt), tailing factor (T), and theoretical plate number (N) of the chromatographic method for AS and MQ quantiication
Effect Artesunate Meloquine hydrochloride
Content (%)* Rt (min)* T* N* Content (%)* Rt (min)* T* N*
Acetonitrile concentration in the mobile phase
101.83-100.79 = 1.04 9.55-12.08 = -2.53 1.08-1.08 = 0.00 17055-17082 = -27 101.47-101.27 = 0.20 3.73-4.38 = -0.65 2.45-2.83 = -0.38 3797-3709 = 88
pH buffer 100.82-101.80
= -0.98 12.09-9.53 = 2.56 1.08-1.08 = 0.00 16946-17190 = -244 101.11-101.63 = -0.52 4.37-3.75 = 0.62 2.78-2.50 = 0.28 3776-3730 = 46
Column temperature 100.72-101.90 = -1.18 11.59-10.03 = 1.56 1.07-1.08 = -0.01 16662-17474 = -812 101.20-101.54 = -0.34 4.20-3.91 = 0.29 2.72-2.55 = 0.17 3711-3796 = -85
Mobile phase low rate 101.85-100.77 = 1.08 9.80-11.82 = -2.02 1.08-1.08 = 0.00 17576-16560 = 1016 101.48-101.26 = 0.22 3.90-4.21 = -0.31 2.49-2.79 = -0.30 3979-3527 = 453
Column supplier 101.69-100.93 = 0.76 9.48–12.15 = -2.67 1.10-1.05 = 0.05 17813-16323 = 1490 101.41-101.33 = 0.08 3.77-4.34 = -0.57 2.55-2.73 = -0.18 3651-3856 = -205
Acetonitrile supplier 100.80-101.82 = -1.02 11.63-9.99 = 1.64 1.08-1.08 = 0.00 16892-17244 = -352 101.25-101.49 = -0.24 4.28-3.84 = 0.44 2.74-2.54 = 0.20 3740-3766 = -26
Chromatograph model 101.71-100.91 = 0.80 9.88-11.75 = -1.87 1.09-1.06 = 0.03 17254-16882 = 372 101.55-101.19 = 0.37 3.82-4.29 = -0.47 2.55-2.72 = -0.17 3745-3762 = -17
REFERENCES
CÉSAR, I.C.; NOGUEIRA, F.H.A.; PIANETTI, G.A. Simultaneous determination of artemether and lumefantrine in fixed dose combination tablets by HPLC with UV detection. J. Pharm. Biomed. Anal., v.48, p.951-954, 2008.
FARMACOPEIA Brasileira. Agência Nacional de Vigilância Sanitária. Brasília: Anvisa, 2010. 2 v.
GAUDIANO, M.C.; ANTONIELLA, E.; BERTOCCHI, P.; VALVO, L. Development and validation of a reversed-phase LC method for analysing potentially counterfeit antimalarial medicines. J. Pharm. Biomed. Anal., v.42, p.132-135, 2006.
GAUDIN, K.; LANGLOIS, M.; BARBAUD, A.; BOYER, C.; MILLET, P.; FAWAZ, F.; DUBOST, J. Stability of artesunate in pharmaceutical solvents. J. Pharm. Biomed. Anal., v.43, p.1019-1024, 2007.
HASTINGS, I. How artemisinin-containing combination therapies slow the spread of antimalarial drug resistance. Trends Parasitol., v.27, p.67-72, 2011.
HODEL, E.M.; ZANOLARI, B.; MERCIER, T.; BIOLLAZ, J.; KEISER, J.; OLLIARO, P.; GENTON, B.; DECOSTERD, L.A. A single LC-tandem mass spectrometry method for the simultaneous determination of 14 antimalarial drugs and their metabolites in human plasma. J. Chromatogr. B Anal. Technol. Biomed. Life Sci., v.877, p.867-886, 2009.
KREMSNER, P.G.; KRISHNA, S. Antimalarial combinations. Lancet, v.364, p.285-294, 2004.
LAI, C.S.; NAIR, N.K.; MANSOR, S.M.; OLLIARO, P.L.; NAVARATNAM, V. An analytical method with a single extraction procedure and two separate high performance liquid chromatographic systems for the determination of artesunate, dihydroartemisinin and meloquine in human plasma for application in clinical pharmacological studies of the drug combination. J. Chromatogr. B Anal. Technol. Biomed Life Sci., v.857, p.308-314, 2007.
MARTINO, R.; MALET-MARTINO, M.; GILARD, V.; BALAYSSAC, S. Counterfeit drugs: analytical techniques for their identiication. Anal. Bioanal. Chem., v.398, p.77-92, 2010.
NOGUEIRA, F.H.A.; GOULART, L.P.L.; CÉSAR, I.C.; CAMPOS, L.M.M.; PIANETTI, G.A. Development and validation of an HPLC method for mefloquine hydrochloride determination in tablet dosage form. J. AOAC Int., v.94, p.1089-1093, 2011.
RANHER, S.S.; GANDHI, S.V.; KADUKAR, S.S.; RANJANE, P.N. A validated HPLC method for determination of artesunate in bulk and tablet formulation. J. Anal. Chem., v.65, p.507-510, 2010.
VAROTTI, F.P.; BOTELHO, A.C.C.; ANDRADE, A.A.; DE PAULA, R.C.; FAGUNDES, E.M.S.; VALVERDE, A.; MAYER, L.M.U.; MENDONÇA, J.S.; SOUZA, M.V.N.; BOECHAT, N.; KRETTLI, A.U. Synthesis, antimalarial activity, and intracellular targets of MEFAS, a new hybrid compound derived from mefloquine and artesunate.
Antimicrob. Agents Chemoter., v.52, p.3868-3874, 2008.
WHITE, N.J.; OLLIARO, P.L. Strategies for the prevention of antimalarial drug resistance: rationale for combination therapy for malaria. Parasitol. Today, v.12, p.399-401, 1996.
WHITE, N.J. Preventing antimalarial drug resistance through combinations. Drug Resist. Updat., v.1, p.3-9, 1998.
WORLD HEALTH ORGANIZATION. Guidelines for the treatment of malaria. 2.ed. Geneva: WHO, 2011a. p.ix.
WORLD HEALTH ORGANIZATION. The international pharmacopoeia. 4.ed., 2.supp. Geneva: WHO, 2011b.
YOUDEN, W.J.; STEINER, E.H. Statistical manual of AOAC –
Association of Oficial Analytical Chemistry. Washington: AOAC, 1975. 88 p.
Received for publication on 21st January 2013