1Universidade Federal de Santa Catarina, Centro de Ciências da Saúde, Programa de Pós-Graduação em Nutrição. Campus
Universitário, Trindade, 88040-970, Florianópolis, SC, Brasil. Correspondência para/Correspondence to: GB FELTRIN.E-mail:
Prevalence and factors associated with
central obesity in schoolchildren
in
Santa Catarina
, Brazil
Prevalência e fatores associados à obesidade
central em escolares de Santa Catarina
Gabriella Bettiol FELTRIN1
Francisco de Assis Guedes de VASCONCELOS1
Larissa da Cunha Feio COSTA1
Arlete Catarina Tittoni CORSO1
A B S T R A C T
Objective
The aims of this article are to estimate the prevalence and to identify the sociodemographic factors and food consumption associated with central obesity in schoolchildren 6-10 years old of the State of Santa Catarina, Brazil.
Methods
It consists in a cross-sectional population-based study involving 4,963 schoolchildren enrolled in the public and private sectors. The dependent variable is central obesity investigated by measuring waist circumference and classified according to percentiles/gender/age. Bivariate and multivariate analyzes were also performed.
Results
The prevalence of central obesity was 4,9% (CI95%=4,3;5,5), being more prevalent in boys with statistical significance (p=0,003). The other variables investigated (age the schoolchildren, type of school, maternal education, protective and risk food consumption, number of daily meals) were not associated with outcome. Among the schoolchildren who had central obesity (n=243), 99.3% of the boys and 99.0% of the girls also showed overweight/obesity.
Conclusion
strong association with cardiovascular risk. It is noteworthy that there is a need for obesity prevention campaigns that encourage children and their parents to adopt a healthier life style. Finally, other studies should be conducted in order to examine potential factors linked to central obesity.
Keywords: Child. Food consumption. Central obesity. Prevalence. Risk factors.
R E S U M O
Objetivo
Estimar a prevalência e verificar fatores sociodemográficos e de consumo alimentar associados à obesidade central em escolares de 6 a 10 anos do Estado de Santa Catarina, Brasil.
Métodos
Trata-se de um estudo transversal de base populacional realizado com 4.963 escolares matriculados em escolas públicas e privadas. A obesidade central foi investigada por meio da medida da circunferência da cintura e classificada de acordo com percentis/sexo/idade. Foram realizadas análises bivariadas e multivariadas.
Resultados
A prevalência de obesidade central foi de 4,9% (IC95%=4,3;5,5), sendo mais elevada nos meninos (5,9%; IC95%=4,9;6,8), apresentando diferença estatisticamente significativa (p=0,003). As demais variáveis investigadas (idade dos escolares, rede de ensino, escolaridade da mãe, consumo de alimentos protetores e de risco e número de refeições diárias) não se mostraram associadas ao desfecho. Dos escolares que apresentaram obesidade central (n=243), 99,3% dos meninos e 99.0% das meninas também apresentaram sobrepeso/ obesidade.
Conclusão
A prevalência de obesidade central encontrada foi menor do que a relatada em estudos nacionais e internacionais. O sexo (masculino) foi a única variável que se mostrou associada ao desfecho. A prevalência identificada é preocupante em função das evidências científicas que sugerem que a obesidade central pode permanecer na vida adulta e apresentar forte relação com fatores de risco cardiovasculares. Ressalta-se a necessidade de campanhas de prevenção à obesidade que estimulem as crianças e seus pais a adotarem um estilo de vida mais saudável. Sugere-se a realização de estudos prospectivos que analisem com maior clareza os possíveis fatores associados à obesidade central.
Palavras-chave: Criança. Consumo de alimentos. Obesidade central. Prevalência. Fatores de risco.
I N T R O D U C T I O N
Obesity is defined as an abnormal or excessive accumulation of body fat that can pose health risks. Excess adipose tissue when stored preferably in the abdominal cavity is called central obesity, considered a public health problem. Central obesity is associated with the development of risk factors for cardiovascular diseases1-3.
An Australian study found that the prevalence of central obesity in schoolchildren increased more than that of total obesity from 1985 to 20074. In the United States, Li et al.5 assessed child and adolescent data from the National Health and Nutrition Examination Survey (NHANES III) and found that the prevalence of
central obesity increased by 6.9% and 7.3% in boys and girls, respectively, from 1988 to 2004.
In Brazil few studies have investigated the prevalence of central obesity in children. In João Pessoa (PB), Queiroz et al.6 assessed 750 schoolchildren aged 6 to 9 years and found a prevalence of central obesity of 2.4%. In Fortaleza
(CE), Damasceno et al.7 assessed children aged 6 to 11 years and found a prevalence of 30.9%. Only two studies were found from the State of
respectively9. The different cut-off points and classifications used for diagnosing central obesity in children explain the discrepant prevalences.
The prevalence of central obesity is increasing, and studies have suggested that sociodemographic and behavioral factors are involved in its genesis, such as more time spent watching television, inappropriate eating habits, lower parental education level, being female, being young (child), and attending a private school10-13. It is important to identify these factors to create more effective interventions to prevent and treat this disease14.
Given the importance of the theme and the scarcity of domestic studies, especially on the intake of foods associated with central obesity, the objective of this study was to determine the prevalence of central obesity in schoolchildren from the State of Santa Catarina and identify the sociodemographic and food intake factors associated with it.
M E T H O D S
This is a cross-sectional, population-based study conducted from June 2007 to May 2008 with schoolchildren enrolled in public and private elementary schools from eight municipalities in the State of Santa Catarina. Santa Catarina is located in the southern region of Brazil, has an area of 95,400 km, and according to the Instituto Brasileiro de Geografia e Estatística (IBGE, Brazilian Institute of Geography and Statistics), there were 5,866,487 inhabitants in 20072.
The methodological procedures for sample size determination and sample selection have been described elsewhere15,16. In summary, sampling was done in two stages: school and schoolchild. The elementary schools of Santa Catarina were divided into three regions: center (north, serrana, and valley), coast (Great Florianó-polis, north coast, and south coast), and west (west and mid-west). Eight major municipalities are located in these regions: Blumenau, Jaraguá do Sul, and Lages in the center; Criciúma,
Florianópolis, and Joinville in the coast; and
Chapecó and Joaçaba in the west. These municipalities had more students enrolled in elementary schools.
According to the Ministry of Education’s School Census of 2006, there were 4,007 elementary schools in Santa Catarina, one federal, 3,661 state and municipal, and 345 private (http: //www.inep.gov.br/censo/basica/dataescola brasil/). To define the number of study schools we considered type (public or private) and number of students.
Hence, the study universe consisted of 140,878 schoolchildren enrolled in 569 public and private schools in the eight municipalities mentioned above divided into six strata of interest formed by the combination of three regions and two administrative sectors. The number of study schools was calculated to ensure a maximum sampling error of plus or minus six percent for each of the strata of interest. Thus, the final sample consisted of 347 schools located in urban and rural areas, of which 266 were public and 81 were private.
One class from each school was randomly selected. Therefore the sampling method consisted of two-stage cluster sampling (first the school, then the children). In order to calculate the number of schoolchildren, we estimated that in each one of the 347 schools we would select a class with 15 to 30 students enrolled between the second and fifth grades, resulting in a sample of 5,205 to 10,410 schoolchildren. The final sample depended on the number of schoolchildren enrolled in the selected class of each school and also on the parents or guardians signing an informed consent form. Therefore, the final sample consisted of 5,686 schoolchildren. Data could not be collected in three schools because of refusals, so 344 schools participated in the study, 269 public and 75 private schools.
The data collection team consisted of eight dieticians and graduate and undergraduate students of the program of nutrition of the
The team was trained based on a standardization protocol for data collection established earlier to minimize intra- and inter-tester errors. A pilot study was conducted in two schools of
Florianópolis (SC), that had not been selected for the study. To ensure the internal validity of the study, approximately 10% of the schoolchildren had their anthropometric data measured twice17.
Independent variables
The independent variables were gender (male/female); age (≤7 years/≥8 years); type of school (public/private); mother’s education level (≤8 years of formal education/≥9 years of formal education/≤11 years of formal education/≥12 years of formal education); child’s nutritional status according to his Body Mass Index (BMI) (overweight/not overweight); intake of protective foods (6 times a day/≤5 times a day); intake of risky foods (≤2 times a day/≥3 times a day); and number of daily meals (≤3 meals a day/≥4 meals a day).
Lists supplied by the schools provided the schoolchildren’s identification data (name, birth date, gender, and type of school). Data about the mother’s education level were collected by a questionnaire sent to the parents or guardians along with the informed consent form. The anthropometric data were measured as recommended by the World Health Organization (WHO)18, based on the recommendations made by Lohman et al.19.
Body weight was measured once using electronic Marte® scales (model PP 180), with 180 kg capacity and 50 g accuracy. Height was measured once using an Alturexata® stadiometer with 1 mm accuracy. BMI was calculated by dividing the weight by the square of the height.
The schoolchildren’s nutritional status was presented descriptively in the results only to characterize the sample. This variable was categorized into not overweight (<score-Z +1) and overweight (≥score-Z +1, based on the WHO’s BMI curves for age and gender20.
Food intake data (intake of health-protective and health-risky foods and number of daily meals) were collected by version 3 of the
Questionário Alimentar do Dia Anterior (QUADA, Yesterday’s Food Questionnaire)21, a structured, illustrated, and validated instrument for schoolchildren. The instrument validation results have shown high sensitivity, with values ranging from 73.4% (beans) to 95.5% (rice), and high specificity, varying from 87.3% (fruits) to 98.8% (beans)22.
Questionário Alimentar do Dia Anterior
version 3 has six meals ordered chronologically (breakfast, morning snack, lunch, afternoon snack, supper, bedtime snack). Each meal is illustrated with 21 foods or groups of foods. The foods were selected based not only on the dietary patterns of the children of the selected age group but also on the menu available at public schools and in the Brazilian Food Guide23.
Four posters (90 cm x 120 cm) were created to present the questionnaire to the schoolchildren, each showing two meals identical to those in the questionnaire. Once the questionnaires had been distributed, the researchers explained all the meals/foods illustrated in the instrument, and the schoolchildren were instructed to circle the foods that they had eaten at each meal the previous day. In order to preserve data quality and not affect the classmates’ answers, the schoolchildren were asked not to answer the questionnaire orally.
The following foods were considered protective: fruits, natural juices, leaf vegetables, non-starchy vegetables, and vegetable soup. The risky foods were chocolate mixes, soda, drink mixes, sweets, packaged snacks, French fires, and fast foods24-26.
Dependent variable
The dependent variable, central obesity, was absolute: yes for the presence of central obesity and no for its absence. Central obesity was diagnosed according to Waste Circumference (WC), measuring it nonconsecutively three times and taking the mean. WC was measured horizontally by an inelastic tape measure with an accuracy of 0.1 mm at the narrowest part of the trunk, where the natural waistline is. The cut-off points we used were those proposed by Fernández
et al.27, who defines central obesity as WC ≥90°/ gender/age.
Analyses
The collected data were entered twice in the software EpiData version 3.2 by trained personnel. Once data consistency was confirmed, the data was treated statistically by the software Stata version 11.0. Bivariate and multivariate analyses were conducted by logistic regression, considering the prevalence of the outcome.
After analyzing the sample descriptively, bivariate analysis determined whether the dependent variable was associated with each independent variable. Next, multivariate analysis was conducted using logistic regression. The variables were included and maintained in the analyses by backward selection, according to the theoretical model (Figure 1). Thus, the first variables placed in the model were the distal-level variables (mother’s education level, type of school, and schoolchild’s age), followed by the proximal-level variables (intake of protective foods, intake of risky foods, and number of meals consumed a day).
The adjustments were made for same-level variables and for the level immediately above. Only the variables with p≤0.25 or those with the smallest p when variables with p≤0.25 were not available were allowed to remain in the model. The analyses were stratified by gender since the literature reports important differences between
boys and girls. All regression results were presented as Odds Ratios (OR) and respective 95% Confidence Intervals (95%CI). The significance level for all analyses was set at p<0.05.
The research project was approved by the Research Ethics Committee of the Universidade Federal de Santa Catarina under Protocol number 031/06. The children’s parents or guardians signed an Informed Consent Form.
R E S U L T S
A total of 4,963 second- to fifth-graders aged 6 to 10 years participated in the study. The response rate was 87.3%. The final sample excluded 275 schoolchildren because they were not present on anthropometric data collection day; one child was excluded because he was aged less than six years; 358 children were excluded because they were aged more than ten years; and 89 children were excluded because their data was incomplete.
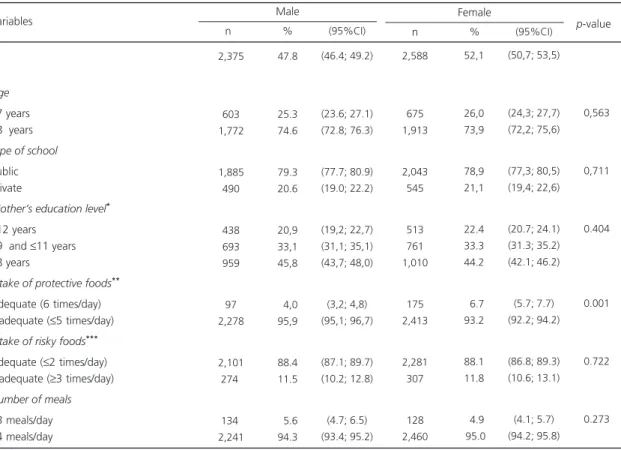
Table 1 shows the general characteristics of the sample. The proportions of male and female schoolchildren were similar, with 52.1% females. Most boys (74.6%) were aged 8 or more years; 79.3% were enrolled in public schools; and 45.8% of their mothers had up to eight years of formal education. Nearly all (95.9%) of the schoolchildren presented inadequate intake (≤5 times a day) of protective foods; 11.5% consumed risky foods three or more times a day; and again, nearly all (94.3%) had four or more meals a day. Most (73.9%) girls were aged 8 to 10 years; 78.9% studied in public schools; and 44.2% of their mothers had up to eight years of formal education. The frequencies of the dietary variables were similar to those of boys: 93.2% had inadequate intake of protective foods; 11.8% consumed risky foods three or more times a day; and 95.0% had four or more meals a day.
The prevalence of central obesity in schoolchildren from eight Santa Catarina
Figure 1. Analysis model used for the multivariate analysis according to the study variables. Prevalence of factors associated with central obesity in schoolchildren from Santa Catarina (SC), 2013.
Table 1. Characterization of the study sample according to the independent variables stratified by gender. Santa Catarina, Brazil, 2007.
Age
≤7 years
≥8 years
Type of school
Public Private
Mother’s education level*
≥12 years
≥9 and ≤11 years
≤8 years
Intake of protective foods**
Adequate (6 times/day) Inadequate (≤5 times/day)
Intake of risky foods***
Adequate (≤2 times/day) Inadequate (≥3 times/day)
Number of meals
≤3 meals/day
≥4 meals/day Variables
Note: *n males: 2,090; n females: 2,284; **Fruits, fruit juice, leaf vegetables, other non-starchy vegetables, vegetable soup; ***Chocolate milk, soda,
drink mixes, sweets, packaged snacks, French fries and fast foods. 95%CI: 95% Confidence Interval.
2,588
675 1,913
2,043 545
513 761 1,010
175 2,413
2,281 307
128 2,460
n
52,1
26,0 73,9
78,9 21,1
22.4 33.3 44.2
06.7 93.2
88.1 11.8
04.9 95.0
(50,7; 53,5)
(24,3; 27,7) (72,2; 75,6)
(77,3; 80,5) (19,4; 22,6)
(20.7; 24.1) (31.3; 35.2) (42.1; 46.2)
(5.7; 7.7) (92.2; 94.2)
(86.8; 89.3) (10.6; 13.1)
(4.1; 5.7) (94.2; 95.8) % (95%CI)
Female
0,563
0,711
0.404
0.001
0.722
0.273
p-value
02,375
603 01,772
01,885 490
438 693 959
97 02,278
02,101 274
134 02,241
n
47.8
25.3 74.6
79.3 20.6
20,9 33,1 45,8
04,0 95,9
88.4 11.5
05.6 94.3
(46.4; 49.2)
(23.6; 27.1) (72.8; 76.3)
(77.7; 80.9) (19.0; 22.2)
(19,2; 22,7) (31,1; 35,1) (43,7; 48,0)
(3,2; 4,8) (95,1; 96,7)
(87.1; 89.7) (10.2; 12.8)
(4.7; 6.5) (93.4; 95.2) % (95%CI)
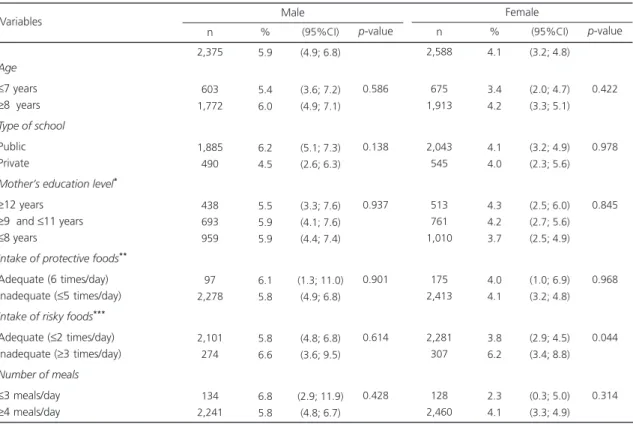
Table 2. Prevalence of central obesity according to the independent variables stratified by gender. Santa Catarina, Brazil, 2007.
Age
≤7 years
≥8 years
Type of school
Public Private
Mother’s education level*
≥12 years
≥9 and ≤11 years
≤8 years
Intake of protective foods**
Adequate (6 times/day) Inadequate (≤5 times/day)
Intake of risky foods***
Adequate (≤2 times/day) Inadequate (≥3 times/day)
Number of meals
≤3 meals/day
≥4 meals/day Variables
Note: *n males: 2,090; n females: 2,284; **Fruits, fruit juice, leaf vegetables, other non-starchy vegetables, vegetable soup; ***Chocolate milk, soda,
drink mixes, sweets, packaged snacks, French fries and fast foods. 95%CI: 95% Confidence Interval.
2,375 603 1,772 1,885 490 438 693 959 97 2,278 2,101 274 134 2,241 n 5.9 5.4 6.0 6.2 4.5 5.5 5.9 5.9 6.1 5.8 5.8 6.6 6.8 5.8 (4.9; 6.8) (3.6; 7.2) (4.9; 7.1) (5.1; 7.3) (2.6; 6.3) (3.3; 7.6) (4.1; 7.6) (4.4; 7.4) (1.3; 11.0) (4.9; 6.8) (4.8; 6.8) (3.6; 9.5) (2.9; 11.9) (4.8; 6.7) % (95%CI) Male p-value 0.586 0.138 0.937 0.901 0.614 0.428 2,588 675 1,913 2,043 545 513 761 1,010 175 2,413 2,281 307 128 2,460 n 4.1 3.4 4.2 4.1 4.0 4.3 4.2 3.7 4.0 4.1 3.8 6.2 2.3 4.1 (3.2; 4.8) (2.0; 4.7) (3.3; 5.1) (3.2; 4.9) (2.3; 5.6) (2.5; 6.0) (2.7; 5.6) (2.5; 4.9) (1.0; 6.9) (3.2; 4.8) (2.9; 4.5) (3.4; 8.8) (0.3; 5.0) (3.3; 4.9) % (95%CI) Female p-value 0.422 0.978 0.845 0.968 0.044 0.314
(p=0.003). Of the 243 children with central obesity, 99.3% of the boys and 99.0% of the girls were also overweight (data not tabulated).
Males aged eight or more years, attending public schools, and whose mothers had low education levels had higher prevalences of central obesity. The prevalence was also higher in boys with adequate intake of protective foods, inappropriate intake of risky foods, and those who had three or fewer meals a day. In females, greater prevalences of central obesity were found in those aged eight or more years, those attending public schools, and those whose mothers had higher education levels. The prevalence was also higher in girls who consumed risky foods inappropriately and protective foods inadequately, and who had four or more meals a day (Table 2).
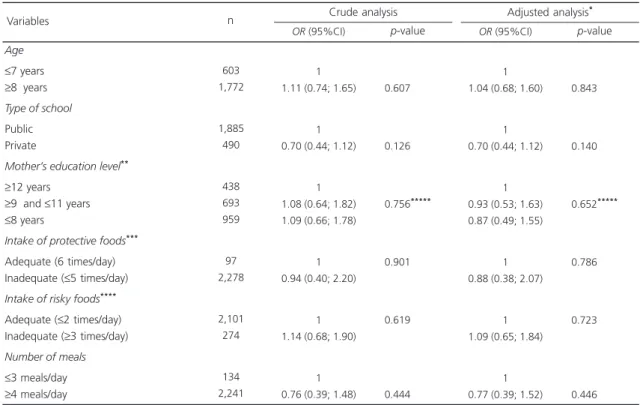
In the crude analyses, no variable was associated with the outcome in either girls or boys
(Tables 3 and 4). After multivariate analysis, the variables continued not to show association for either gender (Tables 3 and 4).
D I S C U S S I O N
the study prevalence was compared with those of other domestic studies, the variation was smaller. In Maceió (AL) a study that used the same classification used herein found a central obesity prevalence of 9.3% in schoolchildren aged 7 to 17 years, but the study used a smaller cut-off point30. Higher prevalences were found in Florianópolis (SC) (10.4% in girls and 13.1% in boys) in children aged 7 to 10 years by a study that used British references for the classification9. The different prevalences are explained by the distinct age groups, methods, and cut-off points used for diagnosing central obesity.
A study in Portugal with 1,433 schoolchildren aged 6 to 12 years also found that central obesity is significantly more prevalent in males31. This result can be due to girls’ great concern with aesthetics imposed by today’s beauty standards that value excessive thinness, making central
obesity less prevalent in females. Studies suggest that the desire to lose weight begins in girls around age six years, a period in which children acquire cultural perceptions of physical attractiveness similar to those of adults32,33. However, a population-based study with 29,244 Asian Indian children and adolescents aged 8 to 18 years found that central obesity was significantly associated with females12.
Food intake variables were not associated with central obesity in either gender. This finding disagrees with most studies that analyzed the quality of the foods consumed and central obesity in schoolchildren14,34,35. In the United States Bradlee et al.34 studied 3,761 children and adolescents aged 5 to 15 years and also failed to find association between central obesity and the intake of dairy products, grains, vegetables, and fruits. However, the same study found that the
Table 3. Crude and adjusted odds ratios of the association between central obesity and the independent variables in males. Santa Catarina, Brazil, 2007.
Age
≤7 years
≥8 years
Type of school
Public Private
Mother’s education level**
≥12 years
≥9 and ≤11 years
≤8 years
Intake of protective foods***
Adequate (6 times/day) Inadequate (≤5 times/day)
Intake of risky foods****
Adequate (≤2 times/day) Inadequate (≥3 times/day)
Number of meals
≤3 meals/day
≥4 meals/day Variables
Note: *The variables were inter-adjusted; **n males: 2.090; n females: 2284; ***Fruits, fruit juice, leaf vegetables, other non-starchy vegetables,
vegetable soup; ****Chocolate milk, soda, drink mixes, sweets, packaged snacks, French fries and fast foods; *****p of tendency. OR: Odds Ratio; 95%CI: 95% Confidence Interval.
603 1,772
1,885 490
438 693 959
97 2,278
2,101 274
134 2,241
n
1 1.11 (0.74; 1.65)
1 0.70 (0.44; 1.12)
1 1.08 (0.64; 1.82) 1.09 (0.66; 1.78)
1 0.94 (0.40; 2.20)
1 1.14 (0.68; 1.90)
1 0.76 (0.39; 1.48)
0.607*****
0.126*****
0.756*****
0.901*****
0.619*****
0.444*****
OR (95%CI)
Crude analysis
p-value
1 1.04 (0.68; 1.60)
1 0.70 (0.44; 1.12)
1 0.93 (0.53; 1.63) 0.87 (0.49; 1.55)
1 0.88 (0.38; 2.07)
1 1.09 (0.65; 1.84)
1 0.77 (0.39; 1.52)
0.843*****
0.140*****
0.652*****
0.786*****
0.723*****
0.446*****
OR (95%CI)
Adjusted analysis*
intake of meat was associated with central obesity in males. Another two studies conducted in China
with schoolchildren aged 6 to 13 years found an association between regular intake of sugary drinks and central obesity35, and between the Western diet and central obesity14. In this last study, the Western diet was characterized by high intake of red meat, eggs, and refined products. The fact that protective or risky foods are not associated with central obesity in males and females may stem from the multiple factors involved in the development of the disease. Hence, analysis of a single food intake day may not have been enough to explain the study phenomenon. Additionally, the study cross-sectional design impairs measuring the effect between cause and outcome over time, which may justify the result36.
Among the study limitations, one is the use of QUADA, which does not supply information
about the amount of foods consumed. Despite this limitation, the instrument was developed and validated for schoolchildren, identifies the nutritional quality of the foods consumed, and provides data to suggest improvements in their dietary behavior21. Other Brazilian studies that investigated association between food intake and central obesity in children have not been found. We recommend a thorough analysis of the association between types of foods consumed and central obesity in Brazilian children.
A second limitation is the use of American reference curves, which may have underestimated the prevalence of central obesity in Brazilian children. However, there is no consensus about the most appropriate diagnostic criterion or about the specific cut-off points for our population. In the absence of a consensus for the diagnosis of central obesity, the present study used the
Table 4. Crude and adjusted odds ratios of the association between central obesity and the independent variables in females. State of Santa Catarina, Brazil, 2007.
Age
≤7 years
≥8 years
Type of school
Public Private
Mother’s education level**
≥12 years
≥9 and ≤11 years
≤8 years
Intake of protective foods***
Adequate (6 times/day) Inadequate (≤5 times/day)
Intake of risky foods****
Adequate (≤2 times/day) Inadequate (≥3 times/day)
Number of meals
≤3 meals/day
≥4 meals/day Variables
Note: *The variables were inter-adjusted; **n males: 2.090; n females: 2284; ***Fruits, fruit juice, leaf vegetables, other non-starchy vegetables,
vegetable soup; ****Chocolate milk, soda, drink mixes, sweets, packaged snacks, French fries and fast foods; *****p of tendency. OR: Odds Ratio; 95%CI: 95% Confidence Interval.
675 1,913
2,043 545
513 761 1,010
175 2,413
2,281 307
128 2,460
n
1 1.26 (0.79; 2.03)
1 0.99 (0.61; 1.60)
1 0.97 (0.56; 1.70) 0.87 (0.51; 1.49)
1 1.01 (0.46; 2.20)
1 1.70. (1.01; 2.80)
1 1.80 (0.56; 5.76)
0.310*****
0.978*****
0.587*****
0.968*****
0.057*****
0.276*****
OR (95%CI)
Crude analysis
p-value
1 1.26 (0.79; 2.03)
1 1.02 (0.63; 1.65)
1 0.95 (0.51; 1.75) 0.81 (0.43; 1.55)
1 1.05 (0.48; 2.31)
1 1.68 (1.00; 2.80)
1 1.99 (0.61; 6.43)
0.321*****
0.930*****
0.494*****
0.890*****
0.050*****
0.247*****
OR (95%CI)
Adjusted analysis*
American reference to improve comparability with the other studies found in the literature. The low prevalence of central obesity found in the present study can also result from the implementation of the school canteen law, which forbids selling soda, drink mixes, deep fried snacks, packaged snacks, and other such foods in schools37.
A third limitation is the long time required for collecting data and the respective implications due to the seasonal nature of the study phenomenon. However, we cannot forget the technical, operational, and financial difficulties that are common in studies with large sample sizes. Domestic surveys, such as the Programa de Orçamento Familiar (Family Budget Surveys), are also cross-sectional and collect anthropometric and dietary data (among other variables) over a period of 12 months.
A fourth and final limitation is that the sample size was calculated only to test the prevalence of central obesity, not the associations. Nevertheless, considering the study power parameters of 80%, confidence level of 95%, and number of children in each category of the independent variables, this study could detect minimum OR of 1.70 and 1.74 in males and females, respectively.
As seen in Portugal and China38,39, the present study conducted in the Brazilian state of
Santa Catarina also found that central obesity was more prevalent in overweight children. Strategies for fighting central obesity should include the prevention of overweight. The school is a favorable environment to promote a healthy lifestyle by encouraging regular physical activity and healthy food habits. The school must also provide information to parents and clarify their doubts since parents have a critical role in controlling the child’s weight. Parents may want to improve their food habits and exercise frequency and serve as an example to their children.
Other factors seem to be associated with central obesity in the study age group, but they
have not been contemplated by the present study, such as time spent watching television, parent’s socioeconomic level, child’s skin color, and place of residence (urban/rural)10-12,40. These and other factors should be investigated to better understand central obesity in this population given that the complexity of its etiology includes biological, genetic, and environmental factors.
C O N C L U S I O N
The prevalence of central obesity in schoolchildren from Santa Catarina was 4.9% and was associated with being male. This prevalence is concerning because of the evidence found in the literature, which suggests that central obesity may persist through adulthood and be strongly related to cardiovascular risk factors. Nearly all schoolchildren diagnosed with central obesity were also overweight. Campaigns to prevent overweight and encourage children and their parents to adopt healthier lifestyles are needed.
We suggest new, preferably prospective studies to better analyze the factors associated with central obesity. There is also need of a quantitative, not only qualitative, method for analyzing the schoolchildren’s food intake more accurately.
C O L L A B O R A T O R S
GB FELTRIN analyzed the data and wrote and reviewed the manuscript. LCF COSTA helped to analyze the data and review the manuscript. ACT CORSO coordinated the greater project and reviewed the manuscript. FAG VASCONCELOS helped to design and develop the greater project, supervise the dissertation project, and review the manuscript.
R E F E R E N C E S
2. Velasco PLP, Martín FJM. Significado clínico de la obesidad abdominal. Endocrinol Nutr. 2007; 5(54):265-71.
3. Griz LHM, Viégas M, Barros M, Griz AL, Freese E, Bandeira F. Prevalence of central obesity in a large sample of adolescents from public schools in Recife, Brazil. Arq Bras Endocrinol Metab. 2010; 7(54): 607-11.
4. Garnett SP, Baur LA, Cowell ST. The prevalence of increased central adiposity in Australian school children 1985 to 2007. Obes Rev. 2011; 11(12):887-96. 5. Li C, Ford ES, Mokdad AH, Cook S. Recent trends in waist circumference and waist-height ratio among us children and adolescents. Pediatrics. 2006; 5(118):1390-97.
6. Queiroz VM, Moreira PVL, Vasconcelos THC, Vianna RPT. Prevalencia y predictores antropométricos de presión arterial elevada en escolares de João Pessoa-PB. Arq Bras Cardiol. 2010; 5(95):629-34. 7. Damasceno MMC, Fragoso LVC, Lima AKG, Lima ACS, Viana PCS. Correlação entre índice de massa corporal e circunferência da cintura em crianças. Acta Paul Enferm. 2010; 5(23):652-7.
8. Ferrazzi NB, Branco AC, Hofelmann DA. Obesidade abdominal em crianças escolares: prevalência e fatores associados.Demetra. 2014; 9(1):53-69. 9. Assis MAA, Rolland-Cachera MF, Vasconcelos FAG,
Bellisle F, Conde W, Calvo MCM, et al. Central adiposity in Brazilian schoolchildren aged 7-10 years. Br J Nutr. 2007; 4(97):799-805.
10. Wang N, Xu F, Zheng LQ, Zhang XG, Li Y, Dom GZ, et al. Effects of television viewing on body fatness among Chinese children and adolescents. Chin Med J. 2012; 8(125):1500-3.
11. Mushtaq MU, Gull S, Abdullah HM, Shaid U, Shad MA, Akram J. Waist circumference, waist-hip ratio and waist-height ratio percentiles and central obesity among Pakistani children aged five to twelve years. BMC Pediatrics. 2011; 105(11):105-20. 12. Misra A, Shah P, Goel K, Hazra DK, Gupta R, Seth
P, et al. The High Burden of Obesity and Abdominal Obesity in Urban Indian Schoolchildren: A multicentric study of 38,296 children. Ann Nutr Metab. 2011; 3(58):203-11.
13. Shang X, Li Y, Liu A, Zhang Q, Hu X, Du S, et al. Dietary Pattern and its association with the prevalence of obesity and related cardiometabolic risk factors among Chinese children. PLoS ONE. 2012; 8(7):1-9.
14. Silva DAS, Pelegrini A, Silva JMFLS, Petroski EL. Epidemiology of abdominal obesity among adolescents from a Brazilian State Capital. J Korean Med Sci. 2011; 1(26):78-84.
15. Gabriel CG, Vasconcelos FAG, Andrade DF, Schmitz BAS. First Law regulating school canteens in Brazil: Evaluation after seven years of implementation. Arch Latinoam Nutr. 2009; 59(12):128-38. 16. Ricardo GD, Caldeira GV, Corso ACT. Prevalência
de sobrepeso e obesidade e indicadores de adipo-sidade central em escolares de Santa Catarina, Bra-sil. Rev Bras Epidemiol. 2009; 3(12):424-35. 17. World Health Organization European. The
challenge of obesity in the WHO European Region and the strategies for response. Geneva: WHO; 2006.
18. World Health Organization. Physical status: The use and interpretation of anthropometry. Technical Report Series, nº 854. Geneva: WHO; 1995. 19. Lohman TG, Roche AF, Martolell R. Anthropometric
standardization reference manual. Illinois: Human Kinetics Books; 1988.
20. De Onis M, Onyango AW, Borghi E, Siyam A, Nishida C, Siekmann J. Development of a WHO growth reference for school-aged children and adolescents. Bull World Health Organ. 2007; 85(9):660-7.
21. Assis MAA, Benedet J, Kerpel R, Vasconcelos FAG, Pietro PFD, Kupek E. Validação da terceira versão do Questionário Alimentar do Dia Anterior (QUADA-3) para escolares de 6 a 11 anos. Cad Saúde Pública. 2009; 8(25):1816-26.
22. Assis MAA, Guimarães D, Calvo MCM, Barros MVG, Kupek E. Reprodutibilidade e validade de ques-tionário de consumo alimentar para escolares. Rev Saúde Pública. 2007; 6(41):1054-7.
23. Brasil. Ministério da Saúde. Departamento de Aten-ção Básica. Guia alimentar para à populaAten-ção brasi-leira: promovendo um saudável alimentação. Bra-sília: Ministério da Saúde; 2006.
24. World Health Organization. Global strategy on diet, physical activity and health: Fifty-seventh world health assembly. Technical Report Series, nº 916. Geneva: WHO.
25. Costa LCF, Vasconcelos FAG, Corso ACT. Fatores associados ao consumo adequado de frutas e hortaliças em escolares de Santa Catarina, Brasil. Cad Saúde Pública. 2012; 6(28):1133-42. 26. Bernardo CO, Vasconcelos FAG. Associação entre
estado nutricional dos pais, variáveis sociodemo-gráficas e dietéticas e o sobrepeso/obesidade em escolares de 7 a 14 anos. Cad Saúde Pública. 2012; 2(28):291-304.
28. Flores-Huerta S, Klunder-Klunder M, Cruz LR, Santos JI. Increase in body mass index and waist circumference is associated with high blood pressure in children and adolescents in Mexico city. Arch Med Res. 2009; 3(40):208-15.
29. Meininger JC, Brosnan CA, Eissa MA, Nguyen TP, Reyes LR, Upchurch SL, et al. Overweight and central adiposity in school-age children and links with hypertension. J Pediatric Nurs. 2010; 2(25):119-25.
30. Souza MGB, Rivera IR, Silva MAM, Carvalho ACC. Relação da obesidade com a pressão arterial elevada em crianças e adolescentes. Arq Bras Cardiol. 2010; 6(94):714-9.
31. Albuquerque D, Nóbrega C, Samouda H, Manco L. Assessment obesity and abdominal obesity among Portuguese children. Acta Med Port. 2012; 3(25):169-73.
32. Feldman W, Feldman MA, Goodman JT. Culture versus biology: Children’s attitudes toward thinness and fatness. Pediatrics. 1988; 2(81):190-4. 33. Lowes J, Tiggemann M. Body dissatisfaction, dieting
awareness and the impact of parental influence in young children. Br J Health Psychol. 2003; 2(8):135-47. 34. Bradlee ML, Cantor MR, Qureshi MM, Moore LL. Food group intake and central obesity among children and adolescents in the Third National Health and Nutrition Examination Survey (NHANES III). Public Health Nutr. 2009; 6(13):797-805. 35. Wen SX, Ling LA, Qian Z, Qi HX, Ming DC, Jun
MA, et al. Report on childhood obesity in China
(9): Sugar-sweetened beverages consumption and obesity.Biomed Environ Sci. 2012, 2(25):125-32. 36. Bonita R, Beaglehole R, Kjellstrom T. Basic
epidemiology. 2nd ed. Washington (DC): World
Health Organization; 2006.
37. Santa Catarina. Lei nº 12.061, de 18 de dezembro de 2001. Dispõe sobre critérios de concessão de serviços de lanches e bebidas nas unidades edu-cacionais, localizadas no Estado de Santa Catarina. Diário Oficial do Estado. 2001; 20 dez.
38. Pedrosa C, Correia F, Seabra D, Oliveira BM, Simões-Pereira C, Almeida MD. Prevalence of overweight and obesity among 7-9 year-old children in Aveiro, Portugal: Comparison between IOTF and CDC references. Public Health Nutr. 2009; 1(14):14-9. 39. Xu H, Li Y, Liu A, Zhang Q, Hu X, Fang H, et al.
Prevalence of the metabolic syndrome among children from six cities of China. BMC Public Health. 2012; 13(12):1-8.
40. Mokha JS, Srinivasan SR, Mahapatra PD, Fernandez C, Chen W, Xu J, et al. Utility of waist-to-height ratio in assessing the status of central obesity and related cardiometabolic risk profile among normal weight and overweight/obese children: The Bogalusa Heart Study. BMC Pediatrics. 2010; 10(73):1-7.