Hierarchical Model for
Evaluating Software Design Quality
Paweł Martenka∗, Bartosz Walter∗
∗Institute of Computing Science, Poznań University of Technology
[email protected], [email protected]
Abstract
Quality of software design has a decisive impact on several quality attributes of the resulting product. However, simple metrics, despite of their popularity, fail to deliver comprehensive infor-mation about the reasons of the anomalies and relation between them and metric values. More complex models that combine multiple metrics to detect a given anomaly are still only partially useful without proper interpretation. In the paper we propose a hierarchical model that extend the Factor-Strategy model defined by Marinescu in two ways: by embedding a new interpretation delivery mechanism into the model and extending the spectrum of data providing input to the model.
1. Introduction
Software design is considered one of the most complex human creative activities [13]. As such, the design process is prone to making errors, which significantly affect the quality of a soft-ware product resulting from the design. There-fore, there is a continuous search for mod-els and approaches that could help both im-proving the design process and evaluating its quality.
Since software design is a quantifiable pro-cess, well-known code metrics are advocated as the primary solution for that problem. They are easy to compute, there is also plenty of exper-imental data showing the correlation between various metrics and desired quality attributes. However, metrics are just numbers, which often do not point to the design flaws, but rather pro-vide rough and aggregate data. There are three main drawbacks of using the isolated metrics as direct providers of quality-related information: 1. There is no direct traceable connection
be-tween an actual cause and the value of a metric; usually it is the designer who is
re-quired to examine the values and identify the problem.
2. A vector of metric values has no meaning for the designer without a proper interpreta-tion. Aggregate metrics are not subject to a straightforward interpretation.
configured. For example, the Large Class bad smell [12], which describes classes bearing too much responsibility, typically denotes an overly complex, low-cohesive class with lots of mem-bers. Due to a large number of symptoms sug-gesting the presence of the flaw, metrics point-ings to them must be combined and evaluated in non-linear and fuzzy manner to deliver an effec-tive and useful measurement mechanism. Thus, the Factor-Strategy model, which is based on simple and strict rules, still does not provide a flexible abstraction for such flaws.
In this paper we propose a hierarchical model for evaluating design quality which is based on the Factor-Strategy concept, but extends it in several ways. It provides designers with hierar-chical, custom-grained information, which helps in tracing the causes of flaws, and also enriches the spectrum of utilized sources of data.
The paper is structured as follows. Section 2 provides an overview of existing literature and approaches used for similar problems. In Sec-tion 3 we present Factor-Strategy model in a more detailed way, and in Section 4 we propose the hierarchical model. Section 5 contains a sim-ple exemplary instance of the model, along with early experimental evaluation results. Section 6 summarizes our findings and proposes further extensions to the model.
2. Related Work
Historically, first attempts to quantitatively evaluate the design quality of object-oriented software were directly derived from code met-rics. Metric suites proposed by Chidamber and Kemerer [6], e Abreu [9] and others were de-signed to capture the most important inter-nal characteristics of object oriented software, like cohesion and coupling, and the use of mechanisms embedded in the object paradigm. A strong evidence has been collected pointing to correlation between these metrics and external quality characteristics.
These characteristics were further investi-gated by Briand et al. [3, 2], who noted that they are too ambiguous to be effectively captured by
generalized, aggregate metrics. As an effect, they proposed several specific metrics, which anal-ysed different flavours of cohesion and coupling. Some researchers went in the opposite direc-tion, building more holistic approaches to mod-elling design anomalies. Beck, the author of eX-treme Programming methodology, coined a term of “code bad smell” for a general label for de-scribing structures in the code that suggest for the possibility of refactoring [11]. Since specific smells describe anomalies that can result from many initial causes, they should also be backed by several symptoms [23], e.g. diversed sets of metrics. Moonen et al. [22] proposed a method for automating smell detection based on analysis of source code abstract syntax trees. Kothari et al. in [16] defined a framework for building tools that perform partially automated code inspec-tions and transformainspec-tions.
Dhambri et al. in [8] proceeded a step fur-ther and employed visualisation techniques for detecting anomalies. The main idea was based on presenting some software quality attributes (e.g. measured by metrics) to a software design expert, who made the final decision. Another work, by Simon and Lewerentz [21], focused on refactorings driven by distance based cohesion. Distance between members of classes (fields and methods) was visualised in a 3D space, so that an expert could decide on appropriate assign-ment of class members and possibly suggest refactorings.
Based on critics of the simplistic metric-based quality models, Marinescu pro-posed Factor-Strategy model [17], compro-posed of two stages: detection strategies stage respon-sible for identifying an anomaly, and composi-tion stage that evaluates the impact of suspects found in the previous step on the high-level quality factors.
This model was further extended. Ratiu [20] encapsulated the detection strategies with a new model which incorporated code changes his-tory into the classification mechanism. The new model has two main advantages:
1. removes false positives from the detected sus-pects set,
Similar concept – use of historical data – was also exploited by Graves et al. [14] and Khosh-goftaar et al. [15]. Graves presented a few models to predict fault incidence and Khoshgoftaar in-troduced a regression model to predict software reliability, both based on the code history.
3. The Factor-Strategy Model
As Marinescu noted, classical models of design quality evaluation do not provide explicit map-ping between metrics and quality criteria, so the rules behind quality quantification are im-plicit and informal. The metrics-based models can provide information about existence of a problem, but they do not reveal the actual cause of a problem. Hence, there is a need for a more comprehensive and holistic model.
The Factor-Strategy model has been pro-posed as a response to the above-mentioned weaknesses. It is composed of two main ele-ments: the Detection Strategy and the composi-tion step.
The Detection Strategy (DS) is defined as a quantifiable expression of a rule by which design fragments that are conforming to that rule can be detected in the source code.
Rules are configured by a set of selected and suitable metrics. In consequence, DS provides a more abstract level of interpretation than indi-vidual metrics do, so that the numeric values of these metrics do not need to be interpreted in isolation.
Metrics are combined into rules using two ba-sic mechanisms: filtering and composition. Fil-ters transform metrics values whereas the com-position operators aggregate into a rule. Mari-nescu gives a following example of a Detection Strategy instance for the Feature Envy smell:
FeatureEnvy := ((AID, HigherThan(4)) and (AID, TopValues(10%))
and (ALD, LowerThan(3)) and (NIC, LowerThan(3))
This examplary rule uses three metrics: Ac-cess of Import-Data (AID), AcAc-cess of Local Data (ALD) and Number of Import Classes (NIC) processed with HigherThan, TopValues
and LowerThan filters, and composed with and composition operator.
Application of DS on a set of software enti-ties (e.g. classes) results in:
1. a set of detected suspects,
2. a vector of metrics values for each suspect. Using this data, a score for a DS is calcu-lated and mapped to a normalised value (a ranked score). The score can be interpreted as a higher-level metric for the strategy. Marinescu provides a few exemplary formulas for comput-ing the score, for example the simplest is the number of suspects for a given DS.
Quantification of high-level quality factors is based on an aggregation of ranked strategies and rules. Formulas for aggregation can vary from a simple mean value, where DS and the rules have equal weight, to more sophisticated, weighted methods. Selection of a method for aggregation depends on the measurement goals. The aggre-gated value – which is a score for the quality fac-tor, is also mapped to the ranked score to provide qualitative information (labelled ranked scores).
4. Hierarchical Model
The final remark refers to the fact that oper-ators used for defining detection rules are strict, ie. they define a borderline, which may classify very similar entities to different categories. Pro-vided that the borderline is set up arbitrary, it can significantly affect the results of evaluation. The goal of this research is to develop a hierarchical model which tackles the men-tioned problems and weaknesses. It extends the Factor-Strategy model mainly in two areas: 1. diversed data sources are used instead of
metrics only,
2. a simple mechanism for dealing with fuzzy problems is proposed.
4.1. Structure of the Model
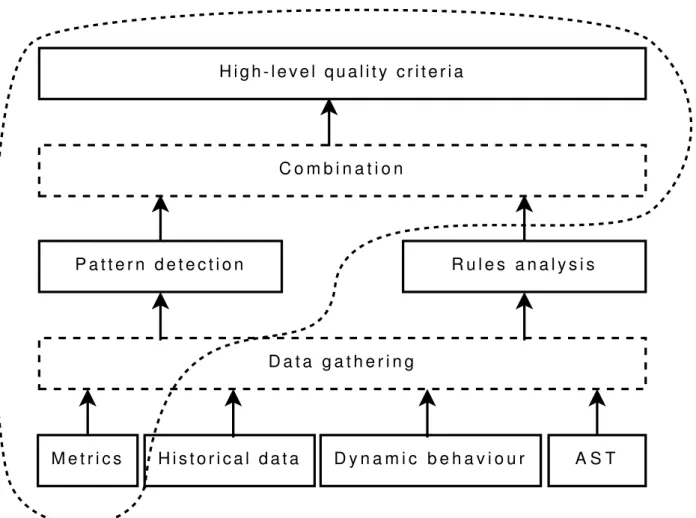
The structure of the hierarchical model and its relation to the Factor-Strategy approach is shown on Fig. 1. At the top of the model there are high-level quality criteria (or char-acteristics), which are combined with detected lower-level patterns and rules violations. Pat-tern and rule detection methods are supported by data coming from various data sources, e.g. metrics, historical data, results of dynamic behaviour and abstract syntax trees (AST), which improves accuracy of the detection mechanism.
The model schema shows a hierarchy of el-ements, but also a hierarchy of information. The evaluation criteria provide the most ab-stract and the most aggregated information. A designer can track down the hierarchy to get more detailed information and find the cause of a problem indicated by the criteria.
4.2. Analysis of Detection Rules and Design Principles
Detection strategies, which are the core part of the original Factor-Strategy model, are con-figurable sets of rules aiming at capturing vi-olations of the well-known principles of design, based on quantified data. However, actual design anomalies present in code do not always match the predicted and configured set of strategies. They can also violate multiple principles
concur-rently or – on the other hand – remain ignored by existing strategies.
The analysis mechanism present in the hier-archical model can be divided into three parts: 1. new data selection approach,
2. metrics quantisation, 3. entity-level aggregation.
4.2.1. Data Selection
Classical quality models employ a set of se-lected metrics for evaluation of quality factor (or factors). For example, a model presented by Briand et al. in [4] is built upon metrics which are supposed to measure coupling, inheri-tance, polymorphism and size, and is oriented on fault-proneness prediction. Also instances of De-tection Strategies in [17] consist of diverse sets of metrics.
The model presented in this section pro-motes different approach. Typically, behind ev-ery principle of software design an internal qual-ity characteristic is present. Based on this obser-vation, the selection of metrics should be strictly oriented on such characteristic. On the other hand, the selected metrics should be simple, suitable and adequate in the context of mea-sured characteristic. As a consequence, some types of metrics should be avoided:
1. strongly aggregating measures, like COF (Coupling Factor defined by Abreu et al. in [9]), which are biased by compensation problem – some parts of highly-coupled de-sign can be masked by parts which are loosely-coupled,
2. metrics which are ambiguously defined, or those capturing ambiguous concepts; Khaled El-Emam in [10] argues that the notion of cohesion is too general to provide significant results,
A S T M e t r i c s H i s t o r i c a l d a t a D y n a m i c b e h a v i o u r
D a t a g a t h e r i n g
P a t t e r n d e t e c t i o n R u l e s a n a l y s i s H i g h - l e v e l q u a l i t y c r i t e r i a
C o m b i n a t i o n
Figure 1. Hierarchical quality model
increase interpretability of the results. New patterns and existing strategies may be built with extended spectrum of data coming from new sources.
4.2.2. Metrics Quantization
As pointed out by Marinescu in [17], a sim-ple vector of metrics values is not very useful, because there is no clear connection between measures and quality factors. In other words, such values require of proper interpretation. The method presented below provides a new inter-pretation mechanism for metrics, so that vio-lations of rules can be detected and presented to the designer in intuitive way. In the context of the violated rules, we require an answer to the question: is the value of a metric unaccept-able and, in consequence, measured character-istic has negative impact on quality? The sim-plest solution introduces a threshold: if a value
of a metric exceeds threshold, then the measured attribute is considered to negatively impact the quality. The domain of the metric is divided into two intervals, which can be labelled as “negative impact” and “no impact”. Thus, the labels pro-vides interpretation for metrics values.
However, strict threshold values are inflex-ible, because values close to the threshold can be interpreted incorrectly in certain context. To provide a simple fix for that, the strict threshold value can be replaced with an additional interval representing the uncertainty. Values which falls into this interval should be analysed separately or supported by other data sources for correct classification.
Having considered these arguments, we can define three classes (intervals) of the attribute domain:
2. M – a value of a metric is near to threshold; additional analysis is required or other data sources should be explored,
3. H – a value of a metric is unambiguously un-acceptable, and the measured attribute has negative impact on quality.
We can formally define the labelling phase in following way:
1. E – a set of analysed entities, for example a class or a package,
2. M – a set of all metrics, suitable for the con-structed model,
3. L – a set of all labels which identify classes of impact,
4. P – a set of all principles considered in the model,
5. m– a metric (e.g. CBO),
6. m(e), e∈E– a value of metricm for entitye. mlie,m=αm(m(e)), e∈E, m∈M, mlie,m∈L.
(1) Function described by formula (1) maps a value of a metric m, measured for entity e, to a label mli1. As an effect, a numerical value delivered by a metric is replaced by a higher-lever label, which is already interpreted from the quality point of view.
The entire effort in the construction of this part of the model must be devoted to defin-ing the α function. For the basic version of the model (with three classes) at least one threshold value with surrounding interval must be defined. The crucial step deals with identification of a threshold and a width of the interval.
The quantised metric – the labelled value – is only the very first and preliminary interpreta-tion step. This informainterpreta-tion is valuable in larger context, thus labelled metrics should be utilised in compound patterns and strategies.
4.2.3. Entity-level Aggregation
Some of the characteristics and mechanisms, which constitute the basis for the rules of good design, are so complicated that there is a need for many supporting data sources, to capture all
as-pects and variations of those characteristics (e.g. coupling can be divided into import and export). Therefore, an aggregation function of a set of quantised metrics and other data sources has to be engaged, to answer the question:Does a com-pound attribute, expressed by a set of input data, have a negative impact on quality?Let be defined: 1. Mp – a set of metrics to express principlep,
in other words, a set of metrics suitable for detection of violations of the principle, 2. Ae,p – a set of all additional pieces of
in-formation, extracted from the other data sources (not metrics), for entity e and prin-ciplep,
3. Me,p={(m, mlie,m) :e∈E, p∈P, mlie,m∈
L,∀(m∈Mp)mlie,m=αm(m(e))} – a set of
pairs: metric with assigned label; the label is assigned respectively to formula (1); the set is evaluated for all metrics referring to principlep and calculated for entitye.
plie,p=βp(Me,p, Ae,p), e∈E, p∈P, plie,p∈L.
(2) Function defined by formula (2) aggregates a set of labelled metrics and additional information to label pli2, which denotes impact of underlying characteristic on quality. Aggregation defined by formula (2) may be also realized as a classifier3. Assuming labels l∈Ldenotes classes, the clas-sifier built for specific principle p will assign a classl to an entitye. Meaning of the aggregated label or class can be generalised as follows: label l∈L denotes strength of negative impact of an attribute upon quality.
Aggregation step requires careful interpreta-tion of collected results, especially in the case of compound characteristics. To sum up above considerations:
1. well-known principles of software design are always based upon internal quality charac-teristic,
2. such characteristics can be decomposed into elements which can be later evaluated by data coming from diverse data sources. The collected results are useful for detection of violations of principles,
1
Metric-level impact.
2
Principle-level impact.
3
3. aggregated results say nothing about the quality characteristic they are based on, but provide information about the negative im-pact of a measured attribute on quality. Label evaluated by formula (2) denotes impact, but do not identify a violation of a principle. To define a violation, let be assumed:
1. V Lp – a set of labels, which are treated as a
violation of principle p,
2. Vp – a symbol of a violation of rule p.
plie,p∈V Lp ⇒Vp, e∈E, p∈P. (3)
Definition If aggregated labelpli for a charac-teristic supporting principle p, for analysed en-tity e, belongs to the set VL, then the entity is flawed by a violation of rule p.
This definition is captured by formula (3). The detected violations can be scored and ranked just like Detection Strategies. As a consequence, presented method can be homo-geneously in-lined with methods presented in Factor-Strategy model.
5. Example of Application
This section brings through a process of instan-tiation of a fragment of the hierarchical model. Scope of the example is narrowed to the ele-ments which constitutes novelty of the model: rules analysis method with metrics quantization and aggregation. Instantiated model will be ap-plied to exemplary entities.
5.1. Model Creation
5.1.1. Goals
The very first step of a model creation is the selection of quality characteristic to be eval-uated. Following activities, like principles and metrics selection, are made in the context of the high-level quality goal. For the purpose of this example, readability (but analysability and un-derstandability are closely related) of code and design is selected as a goal and high-level quality factor.
5.1.2. Principles
Coupling concept is considered to be a good pre-dictor of quality. El-Emam in [10] provides evi-dence that high coupling makes programs hard to understand. Rule of low coupling, identified by Coad and Yourdon in [7] is selected as the design principle used as quality criterion in this example. Hence, let us define a set of principles P ={LowCoupling}.
5.1.3. Data Sources
For the purpose of coupling measurement, met-rics Ca and Ce, defined by Robert Martin in [18], are used. The metrics count incoming (Ce) and outgoing (Ca) couplings separately, and will be applied at class level. Additional information, based on abstract syntax tree, is defined as a flag indicating whether an entity (a class in this case) is abstract. Let us assume:
1. M =MLowCoupling ={Ca, Ce} – a set of all
metrics is actually the set of metrics for the design principle LowCoupling, because only one design principle is considered,
2. A = {IsAbstract} – additional information from a non-metrics source.
5.1.4. Definition of Quantization and Aggregation
As described in [10] by [19], a human can cope with7±2pieces of information at a time. We use this observation as a threshold for the above-se-lected coupling measures. For a quantization purpose, let us define:
1. L={L, M, H}– the basic set of labels, 2. αCe(Ce(e)):
mlie,Ce =
L, Ce(e)<5 M, Ce(e)∈[5,9] H, Ce(e)>9
(4)
3. αCa(Ca(e)):
mlie,Ca =
L, Ca(e)<5 M, Ca(e)∈[5,9] H, Ca(e)>9
The model is oriented toward detection of violations, so the simple max function will be used for aggregation, assuming that la-bels are ordered from the lowest value of L to highest H. Martin in [18] argues that classes should depend upon the most stable of them (eg. on abstract classes), so if a class is abstract then export coupling (Ca) is not taken into consideration. Aggregation func-tionβLowCoupling(Me,LowCoupling, Ae,LowCoupling)
is defined as follows:
plie,LowCoupling =
mlie,Ce, IsAbstract(e)
max{mlie,Ce, mlie,Ca},
otherwise
(6) Finally, let us define the violation:
1. V LLowCoupling = {M, H} – a set of labels
indicating violations ofLowCouplingrule; la-bel M is also included to capture entities which probably violate the rule,
2. VLowCoupling – a symbol which denotes
vio-lation ofLowCoupling rule,
3. (plie,LowCoupling ∈ V LLowCoupling) ⇒
VLowCoupling– definition ofLowCouplingrule
violation.
5.2. Application
The model will be applied on sample data, taken from a student project, depicted in ta-ble 1. All classes are large (from 384 lines to 477 lines in a file) and probably flawed in many as-pects. Results generated by the model are com-pared to results gathered in a survey, conducted among graduate software engineering students (students were asked to identify classes that are too large).
The quantized metrics and additional data for all entities:
1. MDisplayM anager,LowCoupling = {(Ce, H),
(Ca, M)}
2. MAmeChat,LowCoupling={(Ce, H),(Ca, H)}
3. MDrawableGroup,LowCoupling = {(Ce, L),
(Ca, H)}
4. ADisplayM anager,LowCoupling ={IsAbstract=
F alse}
5. AAmeChat,LowCoupling = {IsAbstract =
T rue}
6. ADrawableGroup,LowCoupling = {IsAbstract =
F alse}
Results of aggregation of quantized metrics: 1. pliDisplayM anager,LowCoupling = max{H, M}
=H
2. pliAmeChat,LowCoupling =mliAmeChat,Ce=H
3. pliDrawableGroup,LowCoupling = max{L, H}
=H
Regarding the previous definitions of violations, all entities violate the principle of low coupling and negatively affect the high-level quality cri-terion.
5.2.1. Interpretation
The high-level quality goal – readability – is not evaluated because there are too few entities to get a relevant output. Let be assumed, the high-level factor indicates a problem in software. The very first step is to look for strategies and principles which support the factor, and choose only those with current negative consequences. The second step is to look for entities (suspects) which negatively impacts the factor in the con-text of chosen principle (or strategy). In this par-ticular example there are only three classes and all of them are suspects due to violations of the principle.
Violation in DisplayManager results from the metric Ce, labelled with H, and Ca la-belled with M. Considering Ce definition, Dis-playManager suffers mainly from import cou-pling, and moderately from export coupling. Re-spondents classified DisplayManager as Middle
Table 1. Sample data
Class Ce Ca mlie,Ce mlie,Ca IsAbstract
DisplayManager 13 8 H M False
AmeChat 14 35 H H True
Man andLarge Class, and model results can in-dicate causes of these smells.
AmeChat is an abstract class, so it is ob-vious that it is used by many other classes. In consequence, only import coupling is considered, so the impact results from Ce, despite of high value of Ca. The vast majority of the respon-dents identifiedLarge Class smell, which can be connected with high import coupling.
DrawableGroup uses desirable amount of classes,Ce=L, but is used in many other places. The majority of the respondents identified Re-fused Bequest in the class. This smell deals with inheritance, which is not considered in this model. Obtained results indicates other, coupling-related problems which probably can-not be named as a defined smell.
6. Summary
The proposed hierarchical model extends the Factor-Strategy model in three ways. It delivers more comprehensive and traceable information concerning detected potential anomalies to the designer, including the interpretation of metrics values, and also broadens the spectrum of anal-ysed data sources to the non-metric ones. As the simple example suggests, these elements help in discovering new types of anomalies and also support the designer in evaluating the impact, scope and importance of the violation. It also delivers hierarchically structured data justifying the suspected flaws, and includes a uncertainty interval. Therefore, the model more resembles the human way of cognition.
Further directions of research include an ex-perimental validation of the model, defining de-tection strategies utilizing data from heteroge-neous data sources, and also embedding internal design characteristics into the model.
References
[1] I. D. Baxter, A. Yahin, L. Moura, M. Sant’Anna, and L. Bier. Clone detection using abstract syn-tax trees. InICSM ’98: Proceedings of the Inter-national Conference on Software Maintenance,
page 368, Washington, DC, USA, 1998. IEEE Computer Society.
[2] L. C. Briand, J. W. Daly, and J. K. W¨ust. A unified framework for cohesion measurement in object-oriented systems. Empirical Software Engineering, 3(1):65–117, 1998.
[3] L. C. Briand, J. W. Daly, and J. K. W¨ust. A unified framework for coupling measurement in object-oriented systems. IEEE Transactions on Software Engineering, 25:1, 1999.
[4] L. C. Briand, W. L. Melo, and J. W¨ust. Assess-ing the applicability of fault-proneness models across object-oriented software projects. Tech-nical report, ISERN, 2000.
[5] L. C. Briand, S. Morasca, and V. R. Basili. Property-based software engineering measure-ment. IEEE Transactions on Software Engi-neering, 22:68–86, 1994.
[6] S. R. Chidamber and C. F. Kemerer. A metrics suite for object oriented design. IEEE Transac-tions on Software Engineering, 20(6):476–493, 1994.
[7] P. Coad and E. Yourdon. Object Oriented De-sign. Prentice Hall, 1991.
[8] K. Dhambri, H. A. Sahraoui, and P. Poulin. Visual detection of design anomalies. In 12th European Conference on Software Maintenance and Reengineering 2008, pages 279–283, April 2008.
[9] F. B. e Abreu and R. Carapu¸ca. Object-oriented software engineering: Measuring and controlling the development process. InProceedings of the 4th International Conference on Software Qual-ity, 1994.
[10] K. E. Emam. Advances in Software Engineer-ing, chapter Object-Oriented Metrics: A Review of Theory and Practice, pages 23–50. 2002. [11] M. Fowler. Refactoring. Improving the Design
of Existing Code. Addison-Wesley, 1999. [12] M. Fowler, K. Beck, J. Brant, W. Opdyke, and
D. Roberts. Refactoring: Improving the Design of Existing Code. Addison-Wesley, 1999. [13] R. Glass. On design. Journal of Systems and
Software, 52(1):1–2, May 2000.
[14] T. L. Graves, A. F. Karr, J. Marron, and H. Siy. Predicting fault incidence using software change history. IEEE Transactions on Software Engi-neering, 26:653–661, 2000.
[15] T. M. Khoshgoftaar, E. B. Allen, R. Halstead, G. P. Trio, and R. M. Flass. Using process history to predict software quality. Computer, 31:66–72, 1998.
software anomaly detection. Software Quality Control, 12(2):99–120, 2004.
[17] R. Marinescu. Measurement and Quality in Object-Oriented Design. PhD thesis, “Politeh-nica” University of Timi¸soara, 2002.
[18] R. Martin. OO design quality metrics. An anal-ysis of dependencies. Report on Object Analysis and Design, 2(3), 1995.
[19] G. Miller. The magical number seven, plus or minus two: Some limits on our capacity for pro-cessing information. The Psychological Review, (63):81–97, 1956.
[20] D. Ratiu, S. Ducasse, T. Grba, and R. Mari-nescu. Using history information to improve design flaws detection, 2004.
[21] F. Simon, F. Steinbr¨uckner, and C. Lewerentz. Metrics based refactoring. InProceedings of the 5th European Conference on Software Mainte-nance and Reengineering, pages 30–38, 2001. [22] E. van Emden and L. Moonen. Java quality
assurance by detecting code smells. In Proceed-ings of the 9th Working Conference on Reverse Engineering, 2002.