www.atmos-chem-phys.net/11/1203/2011/ doi:10.5194/acp-11-1203-2011
© Author(s) 2011. CC Attribution 3.0 License.
Chemistry
and Physics
A sea-state based source function for size- and composition-resolved
marine aerosol production
M. S. Long1, W. C. Keene1, D. J. Kieber2, D. J. Erickson3, and H. Maring4
1Department of Environmental Sciences, University of Virginia, Charlottesville, VA, USA
2Department of Chemistry, College of Environmental Science and Forestry, State University of New York, Syracuse, NY, USA
3Computer Science and Mathematics Division, Oak Ridge National Laboratory, Oak Ridge, TN USA 4NASA Headquarters: Radiation Sciences Program, Washington DC, USA
Received: 26 July 2010 – Published in Atmos. Chem. Phys. Discuss.: 28 September 2010 Revised: 20 January 2011 – Accepted: 27 January 2011 – Published: 14 February 2011
Abstract.A parameterization for the size- and composition-resolved production fluxes of nascent marine aerosol was de-veloped from prior experimental observations and extrapo-lated to ambient conditions based on estimates of air entrain-ment by the breaking of wind-driven ocean waves. Produc-tion of particulate organic carbon (OCaer)was parameterized based on Langmuir equilibrium-type association of organic matter to bubble plumes in seawater and resulting aerosol as constrained by measurements of aerosol produced from pro-ductive and oligotrophic seawater. This novel approach is the first to parameterize size- and composition-resolved aerosol production based on explicit evaluation of wind-driven air entrainment/detrainment fluxes and chlorophyll-aas a proxy for surfactants in surface seawater. Production fluxes were simulated globally with an eight aerosol-size-bin version of the NCAR Community Atmosphere Model (CAM v3.5.07). Simulated production fluxes fell within the range of pub-lished estimates based on observationally constrained param-eterizations. Because the parameterization does not consider contributions from spume drops, the simulated global mass flux (1.5×10³Tg y−1) is near the lower end of published estimates. The simulated production of aerosol number (1.4×10⁶m−2s−1) and OC
aer (29 Tg C y−1) fall near the upper end of published estimates and suggest that primary marine aerosols may have greater influences on the physico-chemical evolution of the troposphere, radiative transfer and climate, and associated feedbacks on the surface ocean than suggested by previous model studies.
Correspondence to:M. S. Long ([email protected])
1 Introduction
Despite their global significance, the size-resolved phys-ical (mass and number) and chemphys-ical (organic and inor-ganic) characteristics and production fluxes of primary ma-rine aerosols are not adequately parameterized in compre-hensive Earth system models as functions of major drivers (wind velocity and the chemical composition of surface sea-water). Some parameterizations are based on measurements in ambient air, which are advantageous in that they directly relate variability in production rates inferred from ambient concentrations to the corresponding environmental drivers (e.g. wind speed). These include parameterizations inferred from measured number size distributions in near-surface ma-rine air (Gong et al., 2002; Gong, 2003), vertical gradients in number size distributions measured immediately down wind of coastal surf (Clarke et al., 2006), eddy covariance mea-surements of sub-µm number concentrations during onshore flow (Geever et al., 2005), and associated measurements of ambient aerosol composition (O’Dowd et al., 2008). How-ever, these and other measurement techniques cannot quan-tify, at high temporal resolution, the size-resolved composi-tion of primary marine aerosol produced by bursting bubbles over the full relevant size range (10-nm to 30-µm ambient diameter). In addition, the initial composition of nascent ma-rine aerosol changes rapidly (seconds to minutes) via expo-sure to light and reactive trace gases (Chameides and Stel-son, 1992; Erickson et al., 1999; Zhou et al., 2008). Conse-quently, it is extremely difficult to reliably deconvolute the characteristics of fresh versus processed aerosols based on ambient-air measurements.
Other recently published parameterizations have been de-veloped based on aerosols generated artificially by bubbling air through natural or artificial seawater or impinging a wa-ter jet on surface seawawa-ter. However, some of these studies consider only the sub-µm-diameter size fractions (Sellegri et al., 2006; Tyree et al., 2007; Hultin et al., 2010; Fuentes et al., 2010) thereby ignoring the larger aerosols that dominate mass and volume flux. Another study based on artificially generated aerosols employs synthetic seawater of unreported organic content (M˚artensson et al., 2003) and associated im-plications for aerosol characteristics. The reader is referred to Hultin et al. (2010) for an intercomparison of normal-ized number size distributions reported by different inves-tigators. Spatial and temporal variability in the production and impacts of size-resolved marine aerosols have also been simulated globally using models configured with some of the above parameterizations (e.g., Pierce and Adams, 2006; Langmann et al., 2008; Roelofs, 2008; Spracklen et al., 2008; Gantt et al., 2009; Vignati et al., 2010).
We report herein a new parameterization for the size-resolved production and physicochemical characteristics of nascent marine aerosol as functions of air detrainment through, and the chemical composition of, the surface sea-water column. This approach is based on measured charac-teristics of size-resolved aerosols over full size distributions that were produced via the detrainment of artificially
gener-ated bubbles from fresh, flowing seawater under controlled conditions (Keene et al, 2007; Facchini et al, 2008). This parameterization is part of a larger effort to develop, within the Community Atmosphere Model (CAM) component of the NCAR Community Climate System Model (CCSM), a more explicit description of the sources, multiphase process-ing, and climatic interactions of naturally produced aerosols.
2 Parameterization
To facilitate application by other investigators and to provide context for its derivation, the complete parameterization is presented in Appendix A. The underlying data, associated ra-tionale for the approach, intermediate steps, definitions, and units are detailed below.
2.1 Size-resolved number production flux
Observations indicate that the total number production flux of nascent marine aerosols (FT; m−2s−1)via bursting bub-bles at the seawater surface is linearly proportional to the flux of air detrained from the water column (Keene et al., 2007), which implies that the ratio of particles produced per unit volume of air detrained is approximately constant. There-fore, assuming all air entrained into the water column de-trains as bubbles that produce particles, the number produc-tion flux of marine aerosol can be estimated from the corre-sponding entrainment flux of air into the water column (FEnt, in m3m−2s−1). The dissipation of wave energy by wave breaking involves work against the buoyant force of air en-trained into the water column. Measurements demonstrate that the volume of air entrained within the water column by breaking waves (V0in m3)is proportional to the energy dis-sipated by the wind-wave field through wave breaking (EDin J; Lamarre and Melville, 1991; Loewen and Melville, 1993; Hoque, 2002; Blenkinsopp and Chaplin, 2007). Although the physical characteristics of plunging versus spilling breakers differ (e.g., Lewis and Schwartz, 2004), available evidence suggests that the V0-to-ED ratio (heretofore referred to as α)varies across a narrow range for both types of breakers. For example, measurements ofV0andEDfor 2-D plunging breakers (Lamarre and Melville,1991) yieldαvalues of 5.6 (±0.2)×10−4m3J−1(number of samples(n)=3). Similar measurements for both 2-D plunging and spilling breakers by Blenkinsopp and Chaplin (2007) yield α values of 2.2 (±0.2)×10−4m3J−1(n≈103). For the latter study,V
FEntcan be estimated from
FEnt=αεd (1)
whereεdis the rate of energy dissipation by wave breaking (W m−2). Hanson and Phillips (1999) showed thatε
dvaried as a power-law function of 10-m wind speedU10(in m s−1), εd≈4.28×10⁻⁵·U3.74
10 (uncertainties were not reported).εd values reported by Felizardo and Melville (1995) yielded a similar wind-speed dependence forFEnt, althoughεdvalues were higher by 30% to 40% (see Hanson and Phillips, 1999). Based on the available albeit limited measurements sum-marized above, we estimate that values ofαandεdfall within the ranges of 4 (±2)×10−4m3J−1and 5 (±1)×10−5· U103.74W m−2, respectively, giving
FEnt=2(±1)×10−8·U103.74 (2) Uncertainties are based on reported values or, when not re-ported, reasonable estimates.
We assume that the relationship described by Eq. (2) re-mains constant across the global wind-wave field. The simi-larity in the fraction ofεD attributed to entrainment in pre-vious studies (e.g. Melville and Rapp, 1985; Loewen and Melville, 1993; Hoque, 2002) supports this assumption over the range of wind-wave conditions that have been evaluated. We recognize that the assumption may not be valid under the more energetic wind-wave conditions at higher wind speeds (>20 m s−1). However, physical characteristics of breaking wave fields and associated particle fluxes at high sea states are poorly constrained and, consequently, Eq. (2) cannot be evaluated explicitly under these relatively infrequent model conditions (discussed in more detail below).
Physicochemical characteristics of nascent marine aerosols vary systematically as a function of size (Lewis and Schwartz, 2004; Keene et al., 2007). Super-µm size fractions dominate the volume of fresh marine aerosol with non-water masses that are comprised primarily of inorganic sea salt. Sub-µm size fractions dominate the corresponding number concentrations and contain increasing amounts of OCaer with decreasing size. One-µm diameter at 80% relative humidity (RH) represents the approximate partition between the upper end of the number-size distribution and the lower end of the volume-size distribution (Keene et al., 2007). To maximize resolution in parameterized production of both aerosol number and mass, the total number production fluxes reported by Keene et al. (2007) were binned into two size modes hereafter referred to as mode-1 and mode-2 and denoted with subscripts 1 and 2, respectively). Size ranges for mode-1 and mode-2 particles were 0.044- to 1.0-µm and 1.0- to 24.0-µm diameter at 80% RH, respectively, and are denotedR1andR2, respectively.
Keene et al. (2007) measured the size-resolved number fluxes of mode-2 particles with an aerodynamic particle sizer (APS) and also sampled the corresponding size-resolved mass fluxes with cascade impactors and quantified the ionic
composition by ion chromatography and total organic carbon by high-temperature combustion. To properly implement mode-2 fluxes in the parameterization reported herein, we evaluated the internal consistency of measurements reported by Keene et al. (2007) as follows. Size- and composition-resolved mass fluxes of mode-2 particles were converted to number fluxes at 80% RH following Keene et al. (2007) and compared with the corresponding size-resolved number fluxes measured directly with the APS (Fig. 1). The excellent agreement over most of the super-µm size range suggests that both the size-resolved number concentrations and masses were accurately measured. The divergence in fluxes of par-ticles greater than∼12-µm diameter resulted from losses of larger deliquesced particles within the APS via gravitational settling and impaction. Consequently, the parameterization of number production fluxes for particles greater than 12-µm diameter at 80% RH was based on those calculated from the mass data whereas parameterization of fluxes for smaller super-µm diameter particles was based on those measured di-rectly with the APS.
Keene et al. (2007) showed that the total number produc-tion fluxes of mode-1 and mode-2 particles (F1andF2, re-spectively, in m−2s−1)are linearly proportional to the air de-trainment flux through the water column (FDetin m3m2s−1), or
FT= 2 X
N=1
FN=FDet· 2 X
N=1
cN (3)
cN(m−3)is a wind-speed-invariant parameter describing the particle production rate per unit air detrained with the form cN=R
RN
fN(LogDP)dLogDP wherefN, in units of m−3, is a function of LogDP (defined below). Hultin et al. (2010) present evidence suggesting a wind-speed dependence forcN that may reflect changes in the water-column affecting parti-cle production; this dependence is not considered here.
Based on the assumptions that all air entrained by wave action is detrained as bubbles that produce particles (FEnt= FDet), and that bubble plumes for breaking waves of different sizes have similar bubble size distributions (e.g. see Deane, 1997), then for modeN,
FN(U10,LogDP)=FEnt(U10)· Z
RN
fN(LogDP)dLogDP (4)
Because some bubbles dissolve and others detrain as large voids (Lamarre and Melville, 1991) that presumably produce relatively few particles per unit volume of air, aerosol pro-duction fluxes based on Eq. (3) are considered upper limits. Third order polynomials were fit to the size-resolved produc-tion fluxes measured by Keene et al. (2007) based on least squares regression to yield continuous functions of the form
Fig. 1.Number production fluxes of artificially generated aerosols measured with an APS (solid diamonds) and the corresponding number production fluxes calculated from size-resolved aerosol mass sampled with a cascade impactor and analyzed by ion chro-matography (open circles).
whereDP is the deliquesced particle diameter in µm at 80% RH andPNare the polynomials
P1(LogDP)=2.87·(LogDP)3+3.40·(LogDP)2
−1.04·(LogDP)+8.92 (6) and
P2(LogDP)= −1.53·(LogDP)3−8.10×10⁻²·(LogDP)2 −4.26×10⁻¹·(LogDP)+8.84 (7) for mode-1 and mode-2 particles, respectively. The corsponding correlation coefficients (r) are 0.99 and 0.99, re-spectively. Based on James and Lang (1971), 4th-order polynomials yield marginally better fits to the data relative to 3rd order polynomials but 3rd-order relationships were employed in the parameterization for their smaller compu-tational footprint. See Supplement for a comparison of the 3rd and 4th order polynomial fits to the data. Follow-ing convention, the flux for a given diameter interval can be expressed as a flux per logarithmic diameter interval, dLogDP=Log(DP,UpperLimit)−Log(DP,LowerLimit), giving the final form of the total particle flux function at 80% RH as
dFN dLogDP
=FEnt·10PN (8)
For example, at a U10 of 9 m s−1 and a RH of 80%, the above algorithm yields mode-1 and mode-2 particle fluxes of 7.1×10⁵m−2s−1and 2.1×10⁴m−2s−1forDPvalues of 0.3 and 3.0 µm, respectively. Based on variances for replicate measurements at 80% RH reported by Keene et al. (2007), f1(LogDP)is uncertain by a factor of±21% andf2(LogDP)
by a factor of ±84% (uncertainty for all data, f1 and f2 combined, is±40%). Minor variability in RH and the com-position of feed seawater over the period of characteriza-tion coupled with random measurement errors contributed to variability in replicate measurements of production rates under otherwise identical conditions (Keene et al., 2007). Other major sources of uncertainty are discussed at the end of Sect. 4.
2.2 Production flux of particulate organic matter
Keene et al. (2007) and Facchini et al. (2008) measured size-resolved concentrations of inorganic sea salt and OCaer as-sociated with nascent marine aerosols produced via the de-trainment of artificially generated bubbles from flowing olig-otrophic and eutrophic seawater, respectively. Facchini et al. (2008) quantified total OCaerwhereas Keene et al. (2007) measured OCaer recovered via vigorous sequential extrac-tions in deionized water of nascent aerosols sampled on fil-ters. Analysis of sequential extract solutions suggests that OCaer was recovered quantitatively. However, because the filters may have retained minor fractions of tightly bound insoluble organic compounds, data reported by Keene et al. (2007) are considered lower limits. The two studies also employed different factors to account for the associated H and O when converting the measured mass of OCaerto the corresponding mass of organic matter (OMaer). Facchini et al. (2008) used factors of 1.8 and 1.4 for water-soluble and water-insoluble fractions, respectively, based on Decesari et al. (2007) whereas Keene et al. (2007) used a factor of 2.0 based on Turpin and Lim (2001). Our parameterization is based on the OMaer masses as reported in the two articles. This difference implies a corresponding uncertainty factor of ∼ ±0.4 in simulated OCaerproduction fluxes.
plumes is limited to the top one to three m of the ocean (Thorpe, 1982) whereas the corresponding mixed layer (and presumably OMsea)typically extends to depths on the or-der of 10 to 100 m. Consequently, it is likely that OMsea rather than bubble plume surface area concentration is the primary factor that regulates partitioning under most con-ditions. We assume further that the functional relationship between OMseaand the fraction thereof scavenged by sub-surface bubbles is retained in the OMaer that is produced when those bubble burst (i.e., the size-resolved production of OMaer scales proportionately with the amount of OMsea scavenged by bubble surfaces).
Based on the assumption that all OMaeris internally mixed with deliquesced inorganic sea salt (i.e., associated with the same particles), then, for a given air detrainment flux, vari-ability in OMaer would influence the shape of the num-ber size distribution but not the total numnum-ber flux, which would remain constant. Potential influences of OMsea on bubble dynamics or the corresponding aerosol production fluxes are not considered explicitly. Due to the significant size-dependent contribution of OMaerto mass and volume of mode-1 particles, the size distribution described by Eq. (5) does not represent a lower boundary condition for an organic carbon-dependent function (i.e. Eq. (5) is based on data for which OMaeris nonzero). If OMaer were removed from the particle population that was measured by Keene et al. (2007) (on which Eq. 5 is based), the distribution would shift to smaller size. To quantify the lower boundary condition in the OMsea-dependent parameterization, the size-dependent vol-ume corresponding to OMaerwas subtracted from the mea-sured size distribution to yield the size distribution corre-sponding to pure deliquesced sea salt devoid of OMaer. The calculated volume of organic matter is based on an assumed density of 1.1 g cm−3 (Schkolnik et al., 2006). The result-ing geometric mean diameter (GMD at 80% RH) for the smallest size fraction measured by Keene et al. (2007) de-creased from 0.13 µm to 0.10 µm. Based on the assumption that OMaerdoes not influence hygroscopicity (Keene et al., 2007), the modified polynomial regression (r=0.99) that in-corporates the lower boundary condition (OMaer=0) for the size-resolved production flux of mode-1 aerosols (Eq. 5) is P1(LogDP,OMsea)=1.46·(LogD
′
P)3+1.33·(LogD
′
P)2 −1.82·(LogDp′)+8.83 (9) where
D′P= 3 s
ω3 ω3+δ
N
·DP (10)
and δN=
VOM
VSS (11)
VOM is the volume of organic matter per particle in µm3 estimated as described above,VSSis the corresponding vol-ume of dry sea-salt in µm3 based on an assumed density of 2.165 g cm−3, ω is a hygroscopicity parameter relating the diameter of a dry sea-salt particle (DSS)to sea-salt deli-quesced at 80% RH (D80), such thatD80=DP′ =ωDSSand VP=ω3VSS+VOM, whereVPis the total volume of a particle at 80% RH with diameterDP. ωis assumed to be 2 (Lewis and Schwartz, 2004).
Conceptually,δNfor both mode-1 and -2 particles is lim-ited by the saturation of bubble surface area by OMsea. How-ever, different approaches were required to account for the size dependent variability within each mode.
For mode-1 particles, there were sufficient data to derive a size-resolved expression for δ1. Measurements reported by Keene et al. (2007) and Facchini et al. (2008) show that the mass and volume ratios of organic matter to inorganic sea salt increase with decreasing particle size from values near zero at the upper end of the mode-1 size distribution to values in the range of seven for the smallest measured size fractions. To account for this variability over the full mode-1 size distribution, we adopt an empirical function of the form δ1(Dp,OMsea)=B1·Dpγ1 (12) whereB1 is an empirical constant, and γ1 is a Langmuir-driven shape parameter calculated for mode 1 aerosols from γ1=
γm,1·K1·OMsea 1+K1·OMsea
(13) γm,1corresponds to the saturation constant andK1is analo-gous to the adsorption equilibrium constant for OMseain the classic Langmuir formulation (e.g., see Stumm and Morgan, 1996). In the present formulation, both constants are unitless. Mode-2 particles exhibited no statistically discernible size dependence for OMaer. Consequently, for δ2, a bulk Lang-muir approach was employed using
δ2=
δm,2·K2·OMsea 1+K2·OMsea
(14) whereδm,2 is the saturation value for the volume ratio of organic matter to dry sea salt andK2is analogous to the cor-responding absorption equilibrium constant; both constants are unitless.
The behavior of the Langmuir isotherm is such that at suf-ficiently high OMsea,γ1→γm,1andδ2→δm,2for mode-1 and mode-2 aerosol, respectively.
Table 1. Mass ratios expressed as percentages of mean OMaerto inorganic sea salt for bulk and mode-2 aerosol and corresponding mean chl-aconcentrations in surface seawater. Uncertainties correspond to reported variability in measurements.
Mass Ratio for OMaerto Mass Ratio for OMaerto chl-a
Sea Salt in Bulk Aerosola Sea Salt in Mode-2 Aerosolb (µg L−1)
Keene et al. (2007) 2.5%±2.0% 1.5%±1.1% 0.055 Facchini et al (2008) 4.5%±0.2%c 2.7%±0.2%c 1.4
aBased on measured OM
aerand inorganic sea-salt mass for size-resolved aerosol summed over all size fractions and for aerosol sampled in bulk.
bBased on measured OM
aerand inorganic sea-salt mass summed over super-µm size fractions at 80% RH.
cProvided by M.C. Facchini (Institute of Atmospheric Sciences and Climate, CNR, Bologna, Italy, unpublished data, 2008).
chl-a(Keene et al., 2007) relative to higher production rates of nascent OCaerfrom productive seawater containing high chl-a(Facchini et al., 2008). Substituting chl-afor OMseain Eqs. (12) and (13) yields
γ1=γm,1·k1· [chl-a] 1+k1· [chl-a]
(15) and
δ2=
δm,2·k2· [chl-a]
1+k2· [chl-a] (16)
respectively, wherek1andk2are the corresponding absorp-tion equilibrium constants based on chl-a.
Because dissolved organic carbon in seawater (DOC) does not correlate with either chl-aor OMaer, DOC was not con-sidered to be a reasonable proxy for OMsea. This lack of cor-relation reflects the fact that DOC is composed of a mixture of labile, semilabile, and recalcitrant compounds that origi-nate from multiple sources, are lost via different pathways, and exhibit variable lifetimes against degradation (see Carl-son et al., 1994; Doval and Hansell, 2000). We emphasize that the approach of using chl-a as a proxy for OMsea in the production parameterization is based on results of only two studies and anticipate that the parameterization will be refined as additional simultaneous measurements of chl-a, DOC, OMsea, nascent OMaer, and the corresponding specia-tion thereof become available.
Forδ1, the three dimensionless constants in Eqs. (11), (14) and (15) (B1,γm,1, andk1)were determined as follows. The mean chl-a concentrations in feed seawater and the corre-sponding size-resolved mass ratios of OMaerto sea salt mea-sured by Keene et al. (2007) and Facchini et al. (2008) (Ta-ble 1) were used to calculate individualδ1 values for each size faction in the two datasets based on Eq. (10). Regressing the resultingδ1values againstDPbased on Eq. (11) yielded B1 values of 0.277 and 0.335 and γ values of −1.38 and −1.97 for Keene et al. (2007) and Facchini et al. (2008), re-spectively. Based on the above values and using a meanB1 value of 0.306, we foundγm of −2.01 and K1 of 40.0 by solving Eq. (14) using the method of Scatchard (1942).
Mean values for chl-aand the mass ratios of OMaerto sea salt for mode-2 aerosols (Table 1) were used to empirically
constrainδ2. Again using the method of Scatchard (1942), Eq. (15) was solved forδm,2andk2yielding 0.056 and 20.8, respectively. The relatively small contributions of OMaer to the volume of mode-2 particles corresponded to negligi-ble differences in the size distribution described by Eq. (6). Therefore, substituting theDP′ transformation (Eq. 9) forDP, Eq. (6) was used as the lower boundary condition (OMsea= 0) for the mode-2 parameterization. The OM adsorption pa-rameters for mode-1 and mode-2 aerosol are summarized in Table 2.
3 Global simulations
Size-resolved number and mass production fluxes based on the parameterization derived above (as presented in Ap-pendix A, and hereafter referred to as Long10) were sim-ulated offline (i.e. with no feedbacks involving the atmo-spheric system) over five years using an 8-aerosol size-bin version (3.5.07) of the NCAR Community Atmosphere Model at 1.9◦×2.5◦lat-long resolution (Gent et al., 2009). The atmosphere model was initialized at 1 January 2000. Interfaces with ocean, ice, and land models were run us-ing offline data from 1 January 2000 through 31 Decem-ber 2004. NumDecem-ber production fluxes based on parameteri-zations reported by Gong03 and Clk06 were simulated under the same set of conditions for comparison. Fields of chl-a concentrations (in units of mg m−3)in surface seawater were set equal to monthly averages derived from SeaWIFS im-agery (1◦×1◦, Gregg, 2008) for the period September 1997
Table 2.Adsorption parameters calculated from aerosol character-istics reported by Keene et al. (2007) and Facchini et al. (2008) and the corresponding mean chl-aconcentrations measured in seawa-ter. Combined uncertainties are reported. Dashes indicate that a parameter is not applicable for an aerosol mode.
Parameter Mode-1 Aerosol Mode-2 Aerosol (Eqs. 12 and 15) (Eq. 16)
B1 0.306±0.108 –
γm,1 −2.01±0.26 – δm,2 – 0.056±0.006 kN 40.0±29.3 20.8±20.0
five-year simulations based on Long10 were repeated with Log(chl-a)=Log(mean chl-a)±0.31 based on Gregg and Casey (2004).
4 Results and discussion
Size-resolved number production fluxes atU10 of 9 m s−1 and 80% RH based on Long10 (at [chl-a] =0.0, i.e. no or-ganic mass in the particles) are compared with those based on Mrt03 (for 25◦C), Gong03, and Clk06 in Fig. 2. Mrt03
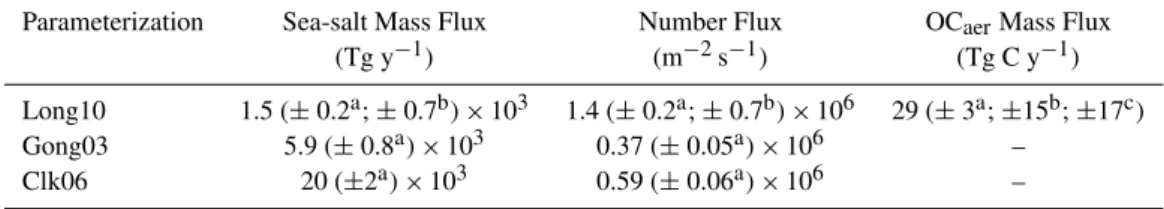
mea-sured size-resolved number concentrations of aerosols pro-duced by bubbling air through synthetic seawater of unre-ported organic composition. Gong03 modified the original parameterization of Monahan et al. (1986) based on produc-tion fluxes inferred from thermal desorpproduc-tion measurements of size-resolved number concentrations of inorganic sea salt over the open ocean (O’Dowd et al., 1997). Clk06 inferred size-resolved production fluxes based on thermal desorption measurements of sea-salt number concentrations measured over a vertical gradient in a coastal surf zone. Note that the thermal desorption approach used in these latter two studies would have removed unknown but probably large fractions of the ambient OMaerprior to characterization. Mrt03, Gong03, and Clk06 extrapolated measured number size distributions as functions ofU10over the ocean based on whitecap cover-age using variants of the approach reported by Monahan and O’Muirchearteigh (1986). Because shapes of the size distri-butions on which the Long10, Mrt03, Gong03, and Clk06 pa-rameterizations are based do not vary as functions ofU10, the corresponding relative variability in predicted size-resolved fluxes at U10 greater and less than 9 m s−1 (not shown) is the same as that depicted in Fig. 2. Global average annual fluxes of number and mass as simulated with CAM based on Long10, Gong03, and Clk06 are summarized in Table 3. Up-per and lower bounds of the CAM results for Long10 are also reported.
In the size range between about 0.4 and 5.0 µm diameter, predicted number production fluxes based on the four func-tions were statistically indistinguishable (Fig. 2), which
im-Fig. 2. Size-resolved number production fluxes based on Long10 compared with those based on Gong03, Clk06, and Mrt03 at 80% RH andU10=9 m s−1. Because fluxes predicted by the other pa-rameterizations are based on measurements of inorganic sea salt de-void of OCaer(see text), fluxes depicted for Long10 correspond to those at 0.0 mg chl-am−3(i.e. also devoid of OCaer). The shaded
area depicts combined measurement-based uncertainty associated with the entrainment of the bubble plume and particle production. Readers are referred to the cited literature for uncertainties asso-ciated with the other parameterizations. Open and closed circles for Gong03 depict predicted fluxes that are within and outside, re-spectively, the ranges of constraining measurement from which the function was derived.
plies that both the underlying measurements and the different approaches employed to scale number fluxes based onU10 (white cap coverage versus air detrainment) yield representa-tive results. We note that Gong03 and Clk06 scale withU103.41 and Long10 scales withU103.74. In addition, the meanU10 in the 5-yr CAM simulations was 8.2 m s−1and relatively few (≪1%) individual values were greater than 20 m s−1. Conse-quently, differences in scaling as functions ofU10would in-troduce minor to negligible divergence in size-resolved pro-duction fluxes based on these functions. The significant di-vergence evident at the upper and lower ends of the size-resolved flux distributions originates primarily from differ-ences in the measured number size distributions rather than the corresponding scaling approaches.
Table 3. Average annual emission fluxes of sea-salt mass, total aerosol number, and OCaerbased on CAM (v3.5.07) simulations using different production parameterizations.
Parameterization Sea-salt Mass Flux Number Flux OCaerMass Flux
(Tg y−1) (m−2s−1) (Tg C y−1)
Long10 1.5 (±0.2a;±0.7b)×103 1.4 (±0.2a;±0.7b)×106 29 (±3a;±15b;±17c)
Gong03 5.9 (±0.8a)×103 0.37 (±0.05a)×106 – Clk06 20 (±2a)×103 0.59 (±0.06a)×106 –
aUncertainty corresponding to interannual variability in the simulated flux (N=5).
bCombined uncertainty for interannual variability and measurements of aerosol characteristics (see text and summary in Table 4).
cCombined uncertainty for interannual variability, measurements of aerosol characteristics, and satellite-based chl-afields (see text and summary in Table 4).
production can have a large influence on estimates of marine aerosol mass flux (Lewis and Schwartz, 2004; Fairall et al., 2009). (2) Production fluxes of aerosols produced by spume drops are poorly constrained by observation (e.g., Monahan and O’Muirchearteaigh, 1986; Andreas et al., 1995; Lewis and Schwartz, 2004; Fairall et al., 2009). Because of their large size, small surface-to-volume ratios and correspond-ing slow rates of chemical evolution, and short atmospheric lifetimes against deposition (hours) relative to smaller par-ticles, spume-produced aerosols tend to have relatively mi-nor influences in terms of biogeochemical processes and cli-matic impacts under many conditions. Although increas-ingly important at higher wind-speeds, theoretical and em-pirical constraints currently preclude reliable characteriza-tion of number and mass produccharacteriza-tion fluxes of these large particles (Fairall et al., 2009). Because our parameteriza-tion does not include contribuparameteriza-tions from spume drops, cor-responding mass fluxes are considered lower limits, which is consistent with the fact that the annual average mass flux based on Long10 (Table 3) is near the lower limit of pub-lished estimates (1.3×10³Tg y−1; e.g., Seinfeld and Pandis, 2006).
Simulated average annual number production fluxes, which are dominated by mode-1 (sub-µm-diameter) aerosols, varied over a factor of 4 (Table 3). However, the lowest num-ber production fluxes correspond to Gong03 for which the lower end of measured size distribution is not constrained by observations (Fig. 2). We infer based on comparisons among the observationally constrained results that number produc-tion fluxes predicted by Gong03 may be underestimated. Av-erage annual number fluxes predicted by Clk06 and Long10 agree within a factor of ∼2.5 (Table 3). Differences are driven by divergence at the lower end of the size distribu-tion (Fig. 2) and may reflect real variability in aerosol pro-duction via coastal breaking waves versus bursting bubbles within a generator or possibly other methodological factors. In this regard, we note that number concentrations of sub-µm diameter aerosols produced artificially by bubbling air through synthetic and natural seawater (Sellegri et al., 2008; Tyree et al., 2008) and by a water jet impinging on natural
seawater (Hultin et al., 2010) yield normalized size distri-butions that are more similar to those reported by Keene et al. (2007). Additional measurements over a broader range of conditions are needed to constrain the current level of uncer-tainty in number production fluxes of marine aerosol evident in Table 3 and Fig. 2 and reported elsewhere (e.g., Andreas, 1995; Lewis and Schwartz, 2004).
Differences between estimates based on Long10, Gantt et al. (2009), and Spracklen et al. (2008) relate in part to the assumed functional relationship between OCaer production and chl-ain seawater as outlined conceptually in Fig. 3. The curve bounded by the light shaded area in Fig. 3 is based on adsorption isotherm parameters shown for bulk aerosol in Table 2. The aggregate value of the ratio of OM to sea-salt, summed over the eight model size-bins and compiled from the model results is plotted as an open square in the fig-ure; the agreement between this value and the global estimate based on bulk data and a global average chl-aconcentration is noteworthy. In Fig. 3, it is evident that OCaer produc-tion fluxes extrapolated linearly from surface chl-aare highly sensitive to chl-a concentrations in seawater from which the OCaer originated. Assuming that the Langmuir functional relationship is representative, linear extrapolations based on measurements in productive marine regions (e.g. Facchini et al., 2008) would yield a relatively low OMaerto chl-a slope resulting in a net underestimate of the globally integrated OMaerflux (Fig. 4; dot-dashed straight line). Similarly, linear extrapolations based on measurements in oligotrophic waters (e.g. Keene et al., 2007) would yield a high OMaer to chl-a slope resulting in a net overestimate of the globally integrated OMaerflux (Fig. 4; dashed straight line). In this regard, we note that the range in OMaer-to-sea-salt mass ratios inferred from both Spracklen et al. (2008) (Fig. 3; vertical bar) and Gantt et al. (2009) (not shown) overlap a linear extrapolation based on measurements in productive waters of the eastern North Atlantic by Facchini et al. (2008) (Fig. 3; dot-dashed straight line). A similar study by Vignati et al. (2010) used a linear extrapolation based on a revision of the OM-to-sea-salt relationship of O’Dowd et al. (2008), which yielded results consistent with Spracklen et al. (2008). The range in OMaer -to-sea-salt mass ratios inferred from Gantt et al. (2009) also overlaps the Langmuir-type approach presented here as de-picted in Fig. 3.
The spatial distribution of OCaerproduction averaged over 5 yr is plotted in Fig. 4, along with the corresponding distri-butions ofU10, chl-aconcentration, and number production flux. Relative spatial variability in mass flux (not shown) is very similar to that in number flux. Results from the global CAM simulations suggest that fluxes of OCaer gen-erally coincide with those for wind-driven particle and mass production though local maxima and minima in OCaer are associated with the distribution of chl-a. Validation of the simulated OCaer fluxes is constrained by both the limited availability of data for size-resolved, marine-derived OCaer (e.g., Turekian et al., 2003) and the fact that OCaerassociated with nascent marine aerosol is not conservative. The OCaer originally present includes compounds that react to form volatile products (Zhou et al., 2008) and aged aerosols in-clude condensed organic reaction products from volatile pre-cursors of marine, natural terrestrial, and anthropogenic ori-gin (Turekian et al., 2003; de Gouw et al.; 2005; Meskhidze and Nenes, 2006; Russell et al., 2007).
Fig. 3. Comparison of Langmuir versus linear extrapolations of the bulk OMaermass fraction of nascent marine aerosol as a
func-tion of chl-ain seawater. The solid line depicts the fit of the mean OMaerdata (Table 1) from low- (X; Keene et al. (2007) and high-productivity (diamond; Facchini et al., 2008) waters to a Langmuir model as described in the text. The gray shaded area depicts uncer-tainty around the fit associated with reported variability in the mea-sured mass ratios of OMaerto sea salt (Table 1). The dark shaded area corresponds to uncertainty in the remotely sensed chl-adata (see text). The dashed and dot-dashed lines depict linear extrapo-lations based on the mean results reported by Keene et al. (2007) and Facchini et al. (2008), respectively. The open square is the bulk OMaermass fraction based on integration of results from the 5-yr CAM simulations using the Long10 parameterization and the solid circle is the corresponding bulk OMaermass fraction calculated di-rectly from the mean data in Table 1. The vertical dotted line de-picts the mean global chl-aconcentration (0.23 µg L−1)based on the SeaWIFS data employed in this study. The vertical bar rep-resents the range in the mass ratios of OMaerto sea salt that
cor-respond to global OCaer(primary + secondary) emission fluxes of 8 Tg C y−1(Spracklen et al., 2008) based on a global inorganic sea-salt emission flux of 103to 104Tg y−1(Table 1) and a global mean chl-aconcentration of 0.22 mg m−3(as inferred from results pre-sented in Spracklen et al., 2008).
Fig. 4.Simulated spatial distributions of(a)U10,(b)surface ocean chl-a,(c)total number production flux of nascent marine aerosol, and
(d)the corresponding OCaerflux averaged over 5 yr.
of spume drops to aerosol mass production, and variability in aerosol production driven by bubble-plume dynamics that vary as functions of temperature (M˚artensson et al., 2003) and surfactants (Sellegri et al., 2006) that control surface ten-sion over the open ocean, surface ocean dynamics (Hultin et al., 2010), and associated turbulent processes involved in bubble plume evolution (Deane and Stokes, 1999).
Major sources of uncertainty that contribute to overall un-certainty in results from the CAM simulations are summa-rized in Table 4. In addition, current limitations in Earth system models preclude explicit evaluation of air entrain-ment and particle production based on all factors that influ-ence energy dissipation by breaking waves. For example, the simplified approach based on regression ofFEnt versus U10as employed here does not capture the full range of vari-ability in the functional relationship among wind velocity, sea state, air entrainment/detrainment, and resulting aerosol production. Extrapolations of aerosol production based on white-cap coverage as a function ofU10suffer from similar limitations. Despite these limitations, the new parameteriza-tion reported herein represents an important advancement in efforts to characterize a major process in Earth’s climate sys-tem based on the underlying physical and biological drivers. Simulated production fluxes of aerosol numbers and associ-ated OCaer fall near the upper limits of published estimates If our estimate is correct, it suggests that primary marine aerosols have greater influences on the physicochemical evo-lution of the troposphere, radiative transfer and climate, and associated feedbacks on the surface ocean than suggested by previous model studies (e.g., Pierce and Adams, 2006).
5 Summary
Table 4.Summary of major sources of uncertainty in parameterization.
Source Uncertainty Citation Note Air Entrainment
per Unit Energy (α)
±25% Various See text
Whitecapping Energy Dissipation Rate (εD)
Unreported (est.±20%) Hanson and Phillips (1999) See text
Air Entrainment Volume (FEnt) ± 40%a This paper See text
Measured Number Production Flux
Mode-1:±21% Mode-2:±84% Overall:±40%
Keene et al. (2007) n=20b
Measured OMaer Mode-1:±12.2%b
Mode-2:±73.3%b
Keene et al. (2007) n=5
Measured OMaer Mode-1:±4.4%b Mode-2:±4.4%b
Facchini et al. (2008) n=9c
Chla 10±31% Gregg and Casey (2004) Log-normal RMSd
Chl-avs. OMsea Unknown;
(Best estimate:r2=0.85)
Zutic and Legovic (1990) N. Adriatic Sea
aEstimated uncertainty corresponds to that atU
10=9m s−1.
bOnly samples with head-space RH = 80%±2%. Values normalized by air-detrainment rate.
cReanalysis of published and unpublished data.
dRoot mean squared (RMS) error.
ocean. Future work stemming from this effort will cou-ple the parameterization presented here with online modules of aerosol microphysics and detailed multiphase chemistry within the CCSM framework.
Appendix A
Final form of the parameterization. Intermediate equations and definitions are omitted for clarity. Constants are replaced by the values used in the simulations. Refer to Sect. 2 for details.
dFN dLogDP
=FEnt·10PN (A1)
FEnt=2×10⁻⁸·U103.74 (A2)
D′P= 3 s
8
8+δN·DP (A3)
For the mode-1 particle flux that accounts for variable OC (see Eqs. (9), (12), and (13) in the text):
P1(LogDP,OMsea)=1.46·(LogD
′
P)3+1.33·(LogD
′
P)2 −1.82·(LogDp′)+8.83 (A4)
δ1(Dp,OMsea)=0.306·DPγ1 (A5)
γ1=−2.01·40.0· [chl-a]
1+40.0· [chl-a] (A6)
For the mode-2 particle flux (see Eqs. (7) and (14) in the text):
P2(LogDP,OMsea)= −1.53·(LogD
′
P)3−8.10×10
−2
·(LogD′P)2−4.26×10⁻¹·(LogD′P)+8.84 (A7)
δ2=0.056·20.8· [chl-a]
Appendix B
Notation
B1 empirical constant for size-resolved mode-1 OM content, unitless.
cN number production flux of mode-N aerosol per unit air detrained, m−3.
DP geometric mean diameter at 80% RH, µm. D′P geometric mean diameter reflecting variable
VOC, µm.
ED total energy dissipated by wave-breaking, J. fN fitting function for mode-N aerosol based on
PN, m−3.
FN size-resolved particle flux for mode-N aerosol, m−2s−1.
FDet bubble plume air detrainment flux, m3m−2s−1. FEnt bubble plume air entrainment flux, m3m−2s−1. FT total particle number flux, m3m−2s−1.
g gravitational constant, m s−2.
KN empirically determined constant for mode-N aerosol based on OMsea, unitless.
kN empirically determined constant for mode-N aerosol based on chl-a, unitless.
OCaer particulate organic carbon mass, g C m−3. OMaer particulate organic matter mass, g m−3. OMsea surface-active organic matter in surface
seawa-ter, g m−3.
RN diameter range for mode-N aerosols at 80% RH, µm.
U10 windspeed at 10-meter height, m s−1.
V0 total volume of air entrained by a breaking wave, m3.
VOM volume of organic matter per particle, µm3. VP total volume per particle at 80% RH, µm3. VSS volume of inorganic sea salt per particle at 0%
RH, µm3.
α ratio ofV0toED, m3J−1.
γ1 Langmuir-based shape parameter for mode-1 aerosol, unitless.
γm,1 saturation value for mode-1 aerosol shape pa-rameter, unitless.
δm,2 saturation value for volume ratio of organic mat-ter to dry sea salt for mode-2 aerosol, unitless. δN volume ratio of organic matter to dry sea salt for
mode-N aerosol, unitless.
εD wind-wave energy dissipation rate, W m−2. ω ratio of deliquesced-to-dry-sea-salt diameter at
80% RH, unitless.
Supplementary material related to this article is available online at:
http://www.atmos-chem-phys.net/11/1203/2011/ acp-11-1203-2011-supplement.pdf.
Acknowledgements. We thank M. C. Facchini for helpful dis-cussions and for providing unpublished data. We also thank C. Fairall and C. Blenkinsopp for constructive comments regarding wind-waves and air entrainment. Staff and scientists at the ORNL Computational Science and Mathematics Division (P. Worley), the Pacific Northwest National Laboratory Atmospheric Science and Global Change Division (S. Ghan, X. Liu), and the Max Planck Institute for Chemistry’s Atmospheric Chemistry Department (A. Kerkweg, P. Jockel, R. Sander) provided valuable assistance. We also acknowledge the contribution of processed SeaWIFS chl-adata by W. Gregg of NASA’s Goddard Space Flight Center. The Marine and Atmospheric Chemistry Research Laboratory at the University of North Carolina at Wilmington also provided analytical facilities and assistance. Financial support was provided by the U.S. Department of Energy’s Office of Science through the Office of Biological and Environmental Research (grant number DE-FG02-07ER64442 to UVA), a Global Change Education Program Graduate Research Environmental Fellowship, and the National Center for Computational Sciences at Oak Ridge National Laboratory (ONRL, contract DE-AC05-00OR22725). Additional support was provided by the National Science Foundation through awards ATM-0343146 and ATM-0638741 to UVA and ATM 0343199 to SUNY.
Edited by: E. Vignati
References
Andreae, M. O. and Rosenfeld, D.: Aerosol-cloud-precipitation interactions. Part 1. The nature and sources of cloud-active aerosols, Earth Sci. Rev., 89, 13–41, 2008.
Andreas, E. L., Edson, J. B., Monahan, E. C., Rouault, M. P., and Smith, S. D.: The spray contribution to net evaporation from the sea: A review of recent progress, Bound.-Lay. Meteorol., 72, 3– 52, 1995.
Blenkinsopp, C. E. and Chaplin, J. R.: Void fraction measurements in breaking waves. Proc. Royal Soc. A, 463(2088), 3151–3170, 2007.
Carlson, C. A., Ducklow, H. W., and Michaels, A. F.: Annual flux of dissolved organic carbon from the euphotic zone in the north-western Sargasso Sea, Nature, 371, 405–408, 1994.
Chameides, W. L. and Stelson, A. W.: Aqueous-phase chemical processes in deliquescent sea salt aerosols: A mechanism that couples the atmospheric cycles of S and sea salt, J. Geophys. Res., 97, 20565–20580, 1992.
Clarke, A. D., Owens, S. R., and Zhou, J.: An ultrafine sea salt flux from breaking waves: Implications for cloud condensation nuclei in the remote marine atmosphere, J. Geophys. Res., 111, D06202, doi:10.1029/2005JD006565, 2006.
Deane, G. B. and Stokes, M. D.: Entrainment processes and bubble size distributions in the surf zone, J. Geophys. Res., 29, 1393– 1403, 1999.
Decesari, S., Facchini, M. C., Mircea, M., Cavalli, F., Emblico, L., Fuzzi, S., Moretti, F., and Tagliavini, E.: Source attribution of water-soluble organic aerosol by nuclear magnetic resonance spectroscopy, Environ. Sci. Technol., 41, 2479–2484, 2007. de Gouw, J. A., Middlebrook, A. M., Warneke, C., Goldan, P.
D., Kuster, W. C., Roberts, J. M., Fehsenfeld, F. C., Worsnop, D. R., Canagaratna, M. R., Pszenny, A. A. P., Keene, W. C., Marchewka, M., Bertman, S. B., and Bates, T. S.: Budget of or-ganic carbon in a polluted atmosphere: Results from the New England Air Quality Study in 2002, J. Geophys. Res., 110, D16305, doi:10.1029/2004JD005623, 2005.
Doval, M. and Hansell, D. A.: Organic carbon and apparent oxy-gen utilization in the western South Pacific and central Indian Oceans, Mar. Chem., 68, 249–264, 2000.
Erickson, D. J., Seuzaret, C., Keene, W. C., and Gong, S.-L.: A gen-eral circulation model calculation of HCl and ClNO2production from sea salt dechlorination: Reactive Chlorine Emissions Inven-tory, J. Geophys. Res., 104, 8347–8372, 1999.
Facchini, M. C., Rinaldi, M., Decesari, S., Carbone, C., Finessi, E., Mircea, M., Fuzzi, S., Ceburnis, D., Flanagan, R., Nilsson, E. D., de Leeuw, G., Martino, M., Woeltjen, J., and O’Dowd, C. D.: Primary submicron marine aerosol dominated by insoluble or-ganic colloids and aggregates, Geophys. Res. Lett., 35, L17814, doi:10.1029/2008GL034210, 2008.
Fairall, C. W., Banner, M. L., Peirson, W. L., Asher, W., and Morison, R. P.: Investigation of the physical scaling of sea spray spume droplet production, J. Geophys. Res., 114, C10001, doi:10.1029/2008JC004918, 2009.
Felizardo, F. C. and Melville, W. K.: Correlations between ambient noise and the ocean surface wave field, J. Phys. Oceanogr., 25, 513–532, 1995.
Fuentes, E., Coe, H., Green, D., de Leeuw, G., and McFiggans, G.: Laboratory-generated primary marine aerosol via bubble-bursting and atomization, Atmos. Meas. Tech., 3, 141–162, doi:10.5194/amt-3-141-2010, 2010.
Gantt, B., Meskhidze, N., and Kamykowski, D.: A new physically-based quantification of marine isoprene and primary organic aerosol emissions, Atmos. Chem. Phys., 9, 4915–4927, doi:10.5194/acp-9-4915-2009, 2009.
Geever, M., O’Dowd, C. D., van Ekeren, S., Flanagan, R., Nilsson, E. D., de Leeuw, G., and Rannik, U.: Submicron sea spray fluxes, Geophys. Res. Lett., 32, L15810, doi:10.1029/2005GL023081, 2005.
Gent, P. R., Yeager, S. G., Neale, R. B., Levis, S., and Bailey, D. A.: Improvements in a half degree atmosphere/land version of the CCSM, Clim. Dynam., 34(6), 819–833, doi:10.1007/s00382-009-0614-8, 2009.
Ghosh, P.: Coalescence of air bubbles at air-water interface, Chem. Eng. Res. Des., 82, 849–854, 2004.
Giribabu, K. and Ghosh, P.: Adsorption of nonionic surfactants at fluid–fluid interfaces: importance in the coalescence of bubbles and drops, Chem. Eng. Sci., 62, 3057–3067, 2007.
Gong, S. L.: A parameterization of sea salt aerosol source function for sub- and super-micron particles, Global Biogeochem. Cy., 17, 1097, doi:10.1029/2003gb002079, 2003.
Gong, S. L., Barrie, L. A., and Lazare, M.: Canadian Aerosol
Module (CAM): A size-segregated simulation of atmospheric aerosol processes for climate and air quality models 2. Global sea-salt aerosol and its budgets, J. Geophys. Res., 107, 4779, doi:10.1029/2001JD002004, 2002.
Gregg, W. W.: Assimilation of SeaWIFS global ocean chlorophyll data into a three-dimensional global ocean model, J. Mar. Sys., 69, 205–225, 2008.
Gregg, W. W. and Casey, N. W.: Global and regional evaluation of the SeaWiFS chlorophyll Data Set, Remotr Sens. Environ., 93, 463–479, 2004.
Hanson, J. L. and Phillips, O. M.: Wind sea growth and dissipation in the open ocean, J. Phys. Oceanogr., 29(8), 1633–1648, 1999. Hoffman, E. J. and Duce, R. A.: Factors influencing the organic
car-bon content of marine aerosols: A laboratory study, J. Geophys. Res., 81, 3667–3670, 1976.
Hoque, A.: Air Bubble Entrainment by Breaking Waves and As-sociated Energy Dissipation, Ph.D. Thesis. Toyohashi University of Technology, 2002.
Hultin, K. A. H., Nilsson, E. D., Krejci, R., M˚artinsson, E. M., Ehn, K., Hagstr¨om, ˚A., and de Leeuw, G.: In situ lab-oratory sea spray production during the MAP 2006 cruise on the North East Atlantic, J. Geophys. Res., 115, D06201, doi:10.1029/2009JD012522, 2010.
James, C. and Lang, S. P.: Truncating criteria for polynomial curve fitting, J. Phys. D: Appl. Phys., 4, 357–363, 1971.
Keene, W. C., Maring, H., Kieber, D. J., Maben, J. R., Pszenny, A. A. P., Dahl, E. E., Izaguirre, M. A., Davis, A. J., Long, M. S., Zhou, X., Smoydzin, L., von Glasow, R., and Sander, R.: Chem-ical and physChem-ical characteristics of nascent aerosols produced by bursting bubbles at a model air-sea interface, J. Geophys. Res., 112, D21202, doi:10.1029/2007JD008464, 2007.
Lamarre, E. and Melville, W. K.: Air entrainment and dissipation in breaking waves, Nature, 351, 469–472, 1991.
Langmann, B., Scannell, C., and O’Dowd, C.: New directions: Or-ganic matter contribution to marine aerosols and cloud conden-sation nuclei, Atmos. Environ., 42, 7821–7822, 2008.
Lewis, R. and Schwartz, S. E.: Sea Salt Aerosol Production: Mech-anisms, Methods, Measurements, and Models – A Critical Re-view, Geophysical monograph 152, 413 pp., American Geophys-ical Union, Washington, DC, 2008.
Loewen, M. R. and Melville, W. K.: An experimental investiga-tion of the collective oscillainvestiga-tions of bubble plumes entrained by breaking waves, J. Acoust. Soc. Am., 95, 1329–1343, 1993. M˚artensson, E. M., Nilsson, E. D., deLeeuw, G., Cohen, L. H., and
Hansson, H.-C.: Laboratory simulations and parameterization of the primary marine aerosol production, J. Geophys. 5 Res., 108, 4297, doi:10.1029/2002JD002263, 2003.
Melville, W. K. and Rapp, R. J.: Momentum Flux in Breaking Waves, Nature, 317, 514–516, 1985.
Meskhidze, N. and Nenes, A.: Phytoplankton and cloudiness in the southern ocean, Science, 314, 1419–1423, 2006.
Modini, R. L., Harris, B., and Ristovski, Z. D.: The organic frac-tion of bubble-generated, accumulafrac-tion mode Sea Spray Aerosol (SSA), Atmos. Chem. Phys., 10, 2867–2877, doi:10.5194/acp-10-2867-2010, 2010.
Monahan, E. C. and O’Muircheartaigh, I. G.: Whitecaps and the passive remote-sensing of the ocean surface, Int. J. Remote Sens., 7, 627–642, 1986.
marine aerosol generation via whitecaps and wave disruption, in: Oceanic Whitecaps, edited by: Monahan, E. and Niocaill, G. M., 167–174, D. Reidel, Norwell, Mass, 1986.
O’Dowd, C. D., Smith, M. H., Consterdine, I. E., and Lowe, J. A.: Marine aerosol, sea-salt, and the marine sulphur cycle: A short review, Atmos. Environ., 31, 73–80, 1997.
O’Dowd, C. D., Facchini, M. C., Cavalli, F., Cebrunis, D., Mircea, M., Decesari, S., Fuzzi, S., Yoon, Y. J., and Putard, J.-P.: Bio-genically driven organic contribution to marine aerosol, Nature, 431, 676–680, 2004.
O’Dowd, C. D., Langmann, B., Varghese, S., Scannell, C., Ce-burnis, D., and Facchini, M. C.: A combined organic-inorganic sea-spray source function, Geophys. Res. Lett., 35, L01801, doi:10.1029/2007GL030331, 2008.
Pierce, J. R. and Adams, P. J.: Global evaluation of CCN formation by direct emission of sea salt and growth of ultrafine sea-salt, J. Geophys. Res., 111, D06203, doi:10.1029/2005JD006186, 2006. Roelofs, G. J.: A GCM study of organic matter in marine aerosol and its potential contribution to cloud drop activation, Atmos. Chem. Phys., 8, 709–719, doi:10.5194/acp-8-709-2008, 2008. Russell, L. M., Mensah, A. A., Fischer, E. V., Sive, B. C., Varner,
R. K., Keene, W. C., Stutz, J., and Pszenny, A. A. P.: Nanopar-ticle growth following photochemicalα- and β-pinene oxida-tion at Appledore Island during Internaoxida-tional Consortium for Research on Transport and Transformation/Chemistry of Halo-gens at the Isles of Shoals 2004, J. Geophys. Res., 112, D10S21, doi:10.1029/2006JD007736, 2007.
Scatchard, G.: Equilibrium thermodynamics and biological chem-istry, Science, 95, 27–32, 1942.
Schkolnik, G., Chand, D., Hoffer, A., Andreae, M., Erlick, C., Swi-etlicki, E., and Rudich, Y.: Constraining the density and com-plex refractive index of elemental and organic carbon in biomass burning aerosol using optical and chemical measurements, EOS Trans. AGU, 87(52), Fall Meeting Suppl., Abstract A43A-0107, 2006.
Seinfeld, J. H. and Pandis, S. N.: Atmospheric Chemistry and Physics: from air pollution to climate change – 2nd ed., John Wiley and Sons, Inc., Hoboken, 2006.
Sellegri, K., O’Dowd, C. D., Yoon, Y. J., Jennings, S. G., and de Leeuw, G.: Surfactants and submicron sea spray generation, J. Geophys. Res., 111, D22215, doi:10.1029/2005JD006658, 2006. Spracklen, D. V., Arnold, S. R., Carslaw, K. S., Sciare, J., and Pio, C.: Globally significant oceanic source of or-ganic carbon aerosol, Geophys. Res. Lett., 35, L12811, doi:10.1029/2008GL033359, 2008.
Stefan, R. L. and Szeri, A. J.: Surfactant scavenging and surface deposition by rising bubbles, J. Coll. Interface Sci., 212, 1–13, 1999.
Stumm, W. and Morgan, J. J.: Aquatic Chemistry, Chemical Equi-libria and Rates in Natural Waters, 3rd ed., 1022 pp., John Wiley & Sons, Inc., New York, 1996.
Thorpe, S. A.: On the cloud of bubbles formed by a breaking wind-wave in deep water, and their role in air-sea gas transfer, Philos. T. Royal Soc. London, 304A, 155–210, 1982.
Toba, Y., Okada, K., and Jones, I. S. F.: The response of wind-wave spectra to changing winds. Part 1: Increasing winds, J. Phys. Oceanogr., 18, 1231–1240, 1988.
Tseng, R.-S., Viechnicki, J. T., Skop, R. A., and Brown, J. W.: Sea-to-air transfer of surface-active organic compounds by bursting bubbles, J. Geophys. Res., 97, 5201–5206, 1992.
Turekian, V., Macko, S. A., and Keene, W. C.: Concentra-tions, isotopic composiConcentra-tions, and sources of size-resolved, par-ticulate organic carbon and oxalate in near-surface marine air at Bermuda during spring, J. Geophys. Res., 108, D4157, doi:10.1029/2002JD002053, 2003.
Turpin, B. J. and Lim, H.: Species contributions to PM2.5 mass concentrations: Revisiting common assumptions for estimating organic mass, Aerosol Sci. Technol., 35, 602–610, 2010. Tyree, C. A., Hellion, V. M., Alexandrova, O. A., and Allen, J. O.:
Foam droplets generated from natural and artificial seawaters, J. Geophys. Res., 112, D12204, doi:10.1029/2006JD007729, 2007. Vignati, E., Facchini, M. C., Rinaldi, M., Scannell, C., Ceburnis, D., Sciare, J., Kanakidou, M., Myriokefalitakis, S., Dentener, F., and O’Dowd, C. D.: Global scale emission and distribution of sea spray aerosol: sea-salt and organic enrichment, Atmos. Environ., 44, 670–677, doi:10.1016/j.atmosenv.2009.11.013, 2009. von Glasow, R. and Crutzen, P. J.: Model study of multiphase DMS
oxidation with a focus on halogens, Atmos. Chem. Phys., 4, 589– 608, doi:10.5194/acp-4-589-2004, 2004.
Zhou, X., Davis, A. J., Kieber, D. J., Keene, W. C., Maben, J. R., Maring, H., Dahl, E. E., Izaguirre, M. A., Sander, R., and Smoydzyn, L.: Photochemical production of hydroxyl radical and hydroperoxides in water extracts of nascent marine aerosols produced by bursting bubbles from Sargasso seawater, Geophys. Res. Lett., 35, L20803, doi:10.1029/2008GL035418, 2008. Zutic, V. and Legovic, T.: Relationship between phytoplankton