Sensitivity Analysis and Validation of Refractive
Index Estimation Method with Ground Based
Atmospheric Polarized Radiance Measurement Data
Kohei Arai
Graduate School of Science and Engineering Saga University
Saga City, Japan
Abstract—Sensitivity analysis and validation of the proposed refractive index estimation method with ground based atmospheric polarized radiance measurement data is conducted. Through the sensitivity analysis, it is found that Degree of Polarization: DP is highly dependent upon surface reflectance followed by imaginary and real part of refractive index and Junge parameter. DP at 550nm is greater than that at 870nm slightly. DP is decreased in accordance with increasing of real part and is increased with increasing of imaginary part while DP is increased with increasing of Junge parameter. It is also found that the peak of DP is appeared not only 90 degree of scattering angle but also at around 150 degree, in particular, when aerosol scattering is dominant. By using the aforementioned characteristics, it may be concluded that it is possible to estimate refractive index with ground based polarized radiance measurements
Keywords—solar irradiance; refractive index; atmospheric polarized radiance
I. INTRODUCTION
The largest uncertainty in estimation of the effects of atmospheric aerosols on climate systems is from uncertainties in the determination of their microphysical properties, including the aerosol complex index of refraction that in turn determines their optical properties. The methods, which allow estimation of refractive indices, have being proposed so far [1]-[3]. Most of the methods use ground based direct, diffuse and aureole measurement data such as AERONET [4] and SKYNET [5]. The methodology for estimation of a complete set of vertically resolved aerosol size distribution and refractive index data, yielding the vertical distribution of aerosol optical properties required for the determination of aerosol-induced radiative flux changes is proposed [6].
The method based on the optical constants determined from the radiative transfer models of the atmosphere is also proposed [7]. Laboratory based refractive indices estimation methods with spectral extinction measurements are proposed [8],[9]. All these existing methods are based on radiance from the sun and the atmosphere. Ground based measuring instruments for solar direct, diffuse and aureole measurements are, in general, heavy and large. The method proposed here is based on the polarized radiance from the sun and the atmosphere that is measured with light and small measuring instrument. The method uses the fact that polarized radiance
depends on aerosol refractive index, size distribution, molecule scattering, gaseous transmission, ozone and water vapor absorptions, etc. in the visible to near infrared wavelength region.
Through optical depth measurements with a variety of relatively transparent wavelength, it is possible to estimate size distribution, molecule scattering, gaseous transmission, ozone and water vapor absorptions, etc. so that refractive index might be estimated. In order to assess the estimation accuracy of refractive index with the proposed method, sensitivity analysis is conducted with a variety of parameters of the atmosphere.
The following section deals with the proposed method then Monte Carlo Ray Tracing: MCRT simulation is introduced followed by some experimental results on the sensitivity analysis.
II. PROPOSED METHOD
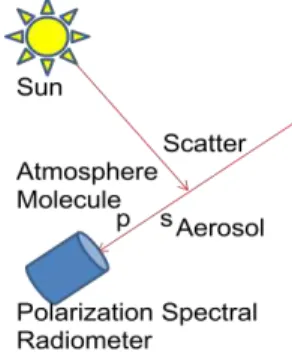
The method proposed here is based on the polarized radiance from the sun and the atmosphere that is measured with light and small measuring instrument. The method uses the fact that polarized radiance depends on aerosol refractive index, size distribution, molecule scattering, gaseous transmission, ozone and water vapor absorptions, etc. in the visible to near infrared wavelength region. Through optical depth measurements, total optical depth at the certain wavelength is known. Molecule scattering is a function of atmospheric pressure and the measured wavelength so that it is possible to estimate if the atmospheric pressure is measured. Ozone and water vapor absorption can be estimated with measured column ozone and water vapor. That is the same thing for gaseous transmission. Using MODTRAN or the other radiative transfer codes, it is estimated through a curve fitting with the measured optical depth at relatively transparent wavelength. Then aerosol optical depth is estimated.
radiances from the atmosphere with the observation angle of perpendicular to the sun as shown in Figure 1.
Fig.1. Observation geometry of the proposed aerosol refractive index estimation with ground based polarized spectral radiance measurements.
III. SENSITIVITY ANALYSIS
Sensitivity on refractive index estimation, S is defined as follows,
S = ∂DP / ∂X (1)
where DP denotes deviation of degree of polarization and X denotes R: Real part of refractive index, I: imaginary part of refractive index and J: Junge parameter. Monte Carlo simulation with 50km by 50km by 50km of cell is used for sensitivity analysis. 100 million of photons are put into the cell with selected solar azimuth and zenith angles from the top of the atmosphere.
Optical depth of molecule and aerosol are given together with surface reflectance. Wavelength is set at 550 and 870nm as an example. p and s polarization of phase functions for
aerosol and molecule are calculated a prior basis. Photon counter with ± 1 degree of aperture is set in the center of the bottom of the simulation cell with the observation angle of perpendicular to the sun. As a default value of real part of refractive index is set at 1.35 as an example, also 0.02 for imaginary part together with 2.6 for the Junge parameter. Real part is varied from 1.25 to 1.45 with 0.025 steps while imaginary part is changed from 0.005 to 0.03 with 0.005 steps together with Junge parameter ranges from 2.6 to 3.6 with 0.2 steps. Meanwhile surface reflectance is changed from 0 to 1 with 0.2 steps.
The irradiance from the atmosphere pointed at perpendicular to the sun is increased in accordance with real part of refractive index. P polarized irradiance is always greater than that of s polarized irradiance. Also the Figure shows the irradiance is increased with increasing of surface reflectance. Meanwhile, the irradiance is decreased in accordance with increasing imaginary part of refractive index. Figure 2 and 3 show irradiance at the wavelength of 870 nm. These trends are same for 550nm that are not shown here, though.
It is true that the p polarized irradiance is always greater than that of the s polarized one. Also the irradiance is decreasing with increasing surface reflectance always. As the matter of fact, high surface reflectance implies that scattering in the atmosphere is likely increased so that the irradiance is increased. It is assumed that the surface is flat and Lambertian so that p polarized irradiance is always greater than that of s polarized one. Also it is true that degree of polarization increases in accordance with imaginary part of refractive index and with Junge parameter while it decreases with increasing of real part of refractive index as is shown in Figure 2.
Fig.2. Trends of degree of polarization: DP with real and imaginary parts of refractive index and Junge parameter.
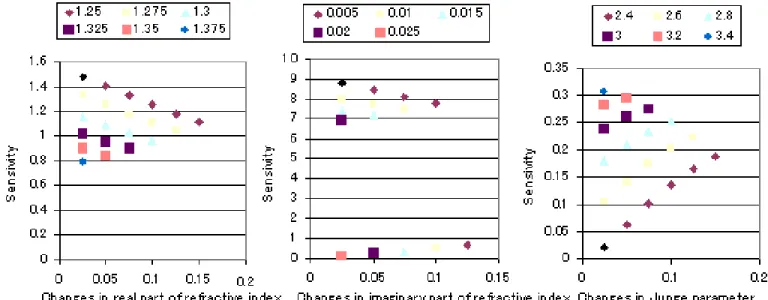
Using these relations, real and imaginary parts of refractive index can be estimated. Sensitivity that is defined
Fig.3. Sensitivity of real and imaginary parts of refractive index and Junge parameter on degree of polarization.
Consequently refractive index can be estimated with ground based polarized irradiance measurement data. This method is applied to the actual data acquired at Saga University at 2:00 GMT on November 26 2003. Measured and estimated parameters are Aerosol optical depth: 0.1191, Molecule optical depth: 0.0152, Surface reflectance: 0.45, Solar zenith angle: 70 degree, Junge parameter: 2.6. Real part of refractive index: 1.35 and Imaginary part of refractive index: 0.02 at wavelength of 870nm. The last three items are estimated based on Skyradpack with skyradiometer, POM-01 manufactured by Prede Co. Ltd. Japan. Major specification and outlook is shown in Table 1 and Figure 4, respectively.
TABLE I. MAJOR SPECIFICATION OF POM-01
Instantaneous Field of
View 0.5 Degree
Minimum Scattering
Angle 3 Degree
Wavelength 315, 400, 500, 675, 870, 940, 1020nm
Wavelength Selection Filter Wheel
Detectors Silicon Photo Diode
Measuring Range 2.5mA, 250uA, 25uA, 250nA, 25nA,2.5nA
Driving System Pulse Motor Drive
Tracking Mode Sun Epemeris Calculation Mode, Sun Sensor Mode
Measuring Period Time, Air-mass
Scan Direction Horizontal direction, Verical Direction
No. of Scattering Angle 50 in Maximum
Sun sensor 4 Elements Si Sensor
PC Interface RS-232C Operable Temperature
Range minus 10Deg.C toplus 45 DegC Power Consumption 200W
Electricity 100V to 240V(2A)
Weight 23Kg
Fig.4. Outlook of POM-01
The estimated results of real and imaginary parts of refractive index based on the proposed method with measured data of p/s polarized irradiance on the ground show 1.3524 for real part while 0.01931 for imaginary part, respectively. Discrepancy between the actual (derived from skyradiometer data) and the estimated refractive index is 0.1745% for real part and 3.4278% for imaginary part of refractive index.
IV. VALIDATION
The proposed method is also validated through field campaigns. DP measured for field campaigns at Roach Lake (Nevada in U.S.A.) and Coyote Lake (California in U.S.A.) which were conducted on December 3 and 10 2008. The detailed conditions are listed in Table 2.
Phase function of DP can be measured with MS-720 of which polarization filter is attached at the optics entrance [10]. Major specification and outlook of MS-720 manufactured by Eiko Co. Ltd. is shown in Table 3 and Figure 5, respectively.
TABLE II. DETAILED CONDITIONS OF TEST SITE
Date and time (UTM)
December 3 2008, 18:38:34
December 10 2008, 18:38:34
Solar azimuth and zenith angles
154.48, 59.84 163.92, 59.61
Location Roach
Lake(38:30:18N,115:41:2 9W)
Coyote
Lake(35:03:53N,116:44:5 0W)
Air-temperature, atmospheric pressure
22.5, 933hPa 22.1, 974hPa
Junge parameter(370/8 70, 500/870)
2.73, 3.15 5.89, 7.21
Ozone(DU), Water vapor(g/cm^2)
284.7, 0.24 271.6, 0.46
Fig.5. Outlook of MS-720
TABLE III. MAJOR SPECIFICATION OF MS-720
Wavelength 350 to 1050nm No. Channels 256 Ch
Wavelength Interval 3.3nm(1nm for 700 channels in PC) Wavelength Resolution less than 0.3nm
Half Power Width 10nm
Operable Temperature Range minus 10 to plus 40DegC Aparture 10, 25, 45, 180Degree Strey Light less than 0.15%
Measureing Time Period 0.005 to 5 sec
No.of Storable Spectral Data 900 of 256 channel data PC Interface USB or RS232C
Size 100x160x60
Weight 800g
Electric Poer 1.5V x 4
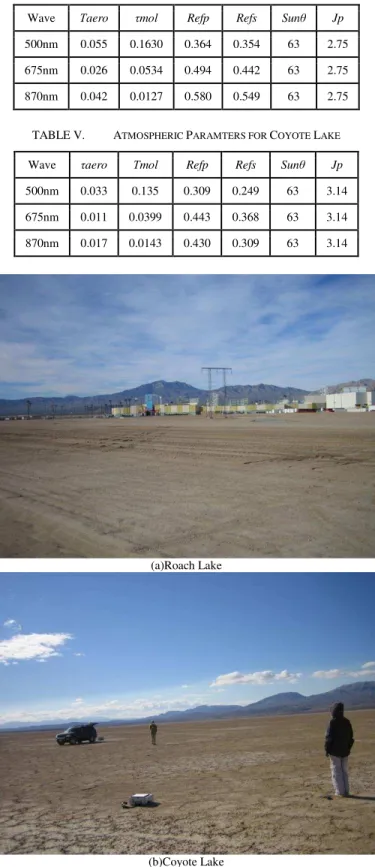
Figure 6 shows how Roach Lake and Coyote Lake looks like. These field campaigns are conducted under the not so bad weather condition with clear sky (partially clouded conditions as shown in Figure 7 of Terra/ASTER/VNIR images). As shown in Table 3, 4, aerosol particle size of Roach Lake is greater than that of Coyote Lake. Also aerosol optical depth of Roach Lake is greater than that of Coyote Lake.
TABLE IV. ATMOSPHERIC PARAMETERS FOR ROACH LAKE
Wave Τaero τmol Refp Refs Sunθ Jp
500nm 0.055 0.1630 0.364 0.354 63 2.75
675nm 0.026 0.0534 0.494 0.442 63 2.75
870nm 0.042 0.0127 0.580 0.549 63 2.75
TABLE V. ATMOSPHERIC PARAMTERS FOR COYOTE LAKE
Wave τaero Τmol Refp Refs Sunθ Jp
500nm 0.033 0.135 0.309 0.249 63 3.14
675nm 0.011 0.0399 0.443 0.368 63 3.14
870nm 0.017 0.0143 0.430 0.309 63 3.14
(a)Roach Lake
(b)Coyote Lake
(a)Roach Lake
(b)Coyote Lake
Fig.7. Terra/ASTER/VNIR images for the test site
Estimated phase functions of DP with the measured p and s polarized irradiance at the test sites of Roach Lake and Coyote Lake are shown in Figure 8.
Comparison of Junge parameter and refractive index derived from skyradiometer data and DP data are also made. As shown in Table 5, both Skyradiometer derived and the proposed DP measured atmospheric irradiance data derived Junge parameter, real part and imaginary parts of aerosol refractive indices are almost same. Therefore, the proposed method does work as same as skyradiometer based method for aerosol parameter estimations.
(a) Roach Lake campaign
(b) Coyote Lake campaign
Fig.8. Estimated phase functions of DP with the measured p and s polarized irradiance at the test sites of Roach Lake and Coyote Lake
TABLE VI. COMPARISON OF JUNGE PARAMETER AND REFRACTIVE INDEX DERIVED FROM SKYRADIOMETER DATA AND DP DATA
V. CONCLUSION
DP is increased with increasing of Junge parameter. It is also found that the peak of DP is appeared not only 90 degree of scattering angle but also at around 150 degree, in particular, when aerosol scattering is dominant.
By using the aforementioned characteristics, it may be concluded that it is possible to estimate refractive index with ground based polarized radiance measurements
ACKNOWLEDGMENT
The author would like to thank Ms. Yui Nishimura for her contributions for conducting experiments.
REFERENCES
[1] Shaw, G.E., Error analysis of multi-wavelength sunphotometry. Pure Appl. Geophys., 114, 1, 1976.
[2] Hoppel, W. A., J. W. Fitzgerald, G. M. Frick, R. E. Larson, and E. J. Mack, Aerosol size distributions and optical properties found in the marine boundary layer over the Atlantic Ocean, J. Geophys. Res., 95, 3659-3686, 1990.
[3] Holben, B. N., et al., AERONET- A federated instrument network and data achieve for aerosol characterization, Remote Sens., 12, 1147-1163, 1991.
[4] Holben, B.N., and Coauthors, AERONET-A federated instrument network and data archive for aerosol characterization. Remote Sens. Environ., 66, 1-16. 1998.
[5] Aoki, K., T. Takamura, and T. Nakajima, Aerosol optical properties measured by SKYNET sky radiometer validation network. Proc. of the 2nd EarthCARE Workshop, 133-134, 2005.
[6] Redemann, R. P. Turco, K. N. Liou, P. B. Russell, R. W. Bergstrom, B. Schmid, J. M. Livingston, P. V. Hobbs, W. S. Hartley, S. Ismail, R. A.
Ferrare, E. V. Browell, Retrieving the vertical structure of the effective aerosol complex index of refraction from a combination of aerosol in situ and remote sensing measurements during TARFOX, J. Geophys. Res., 105, D8, 9949–9970, 2000.
[7] M.L.Clapp, and R.E.Miller, Complex Refractive Indices of Crystalline Hydrazine from Aerosol Extinction Spectra, Icarus, 23, 2, 396-403(8), 1996.
[8] R. Eiden, Determination of the complex index of refraction of spherical aerosol particles, Appl. Opt. 10, 749-757, 1971.
[9] G. E. Thomas, S. F. Bass, R. G. Grainger, and A. Lambert, Retrieval of aerosol refractive index from extinction spectra with a damped harmonic-oscillator band model, Appl. Opt. 44, 1332-1341, 2005. [10] Kohei Arai, Aerosol refractive index retrievals with atmospheric
polarization measuring data, Proceedings of the SPIE, 7461-06, 1-9, 2009
AUTHORS PROFILE
Kohei Arai, He received BS, MS and PhD degrees in 1972, 1974 and 1982, respectively. He was with The Institute for Industrial Science, and Technology of the University of Tokyo from 1974 to 1978 also was with National Space Development Agency of Japan (current JAXA) from 1979 to 1990. During from 1985 to 1987, he was with Canada Centre for Remote Sensing as a Post Doctoral Fellow of National Science and Engineering Research Council of Canada.