www.the-cryosphere.net/7/1513/2013/ doi:10.5194/tc-7-1513-2013
© Author(s) 2013. CC Attribution 3.0 License.
The Cryosphere
Meteorological drivers of ablation processes on a cold glacier in the
semi-arid Andes of Chile
S. MacDonell1, C. Kinnard1, T. Mölg2, L. Nicholson3, and J. Abermann1 1Centro de Estudios Avanzados en Zonas Áridas, La Serena, Chile
2Chair of Climatology, Technische Universität Berlin, Berlin, Germany
3Centre for Climate and Cryosphere, University of Innsbruck, Innsbruck, Austria
Correspondence to:S. MacDonell ([email protected])
Received: 27 March 2013 – Published in The Cryosphere Discuss.: 29 April 2013 Revised: 31 July 2013 – Accepted: 7 August 2013 – Published: 25 September 2013
Abstract.Meteorological and surface change measurements
collected during a 2.5 yr period are used to calculate sur-face mass and energy balances at 5324 m a.s.l. on Gua-naco Glacier, a cold-based glacier in the semi-arid Andes of Chile. Meteorological conditions are marked by extremely low vapour pressures (annual mean of 1.1 hPa), strong winds (annual mean of 10 m s−1), shortwave radiation receipt per-sistently close to the theoretical site maximum during cloud-free days (mean annual 295 W m−2; summer hourly max-imum 1354 W m−2) and low precipitation rates (mean an-nual 45 mm w.e.). Snowfall occurs sporadically throughout the year and is related to frontal events in the winter and convective storms during the summer months. Net short-wave radiation provides the greatest source of energy to the glacier surface, and net longwave radiation dominates en-ergy losses. The turbulent latent heat flux is always nega-tive, which means that the surface is always losing mass via sublimation, which is the main form of ablation at the site. Sublimation rates are most strongly correlated with net shortwave radiation, incoming shortwave radiation, albedo and vapour pressure. Low glacier surface temperatures re-strict melting for much of the period, however episodic melt-ing occurs durmelt-ing the austral summer, when warm, humid, calm and high pressure conditions restrict sublimation and make more energy available for melting. Low accumula-tion (131 mm w.e. over the period) and relatively high abla-tion (1435 mm w.e.) means that mass change over the period was negative (−1304 mm w.e.), which continued the negative trend recorded in the region over the last few decades.
1 Introduction
In the semi-arid Andes of Chile (26–32◦S), snow- and ice melt is thought to be the primary contributor to streamflow, and generally acts to alleviate drought problems in other-wise dry spring and summer seasons (Favier et al., 2009). Snowmelt is thought to be the dominant contributor to the watershed, however conclusive source comparisons are cur-rently lacking, largely due to the difficulty of accurately mea-suring and modelling ablation processes in this area (Gas-coin et al., 2012). Past studies in the region focusing on cryospheric contributions to streamflow have taken a water-shed approach to the problem, and have used black-box ap-proaches to give first estimations of the relative contributions from snowpacks and cold-based glaciers (Favier et al., 2009; Gascoin et al., 2011). These studies suggest that snow- and glacier melt contribute to the bulk of the runoff, but as the methods used in these studies do not capture the physical processes of ablation at a sufficiently high temporal or spa-tial resolution, it remains difficult to link ablation processes and melt water production with atmospheric conditions.
(e.g. Hoffman et al., 2008; Mölg et al., 2008), which can con-tribute to runoff, and sublimation, which does not.
To date there have been no published energy balance stud-ies on glaciers in the semi-arid Andes of Chile and so here we focus on understanding ablation processes on glacier sur-faces, using energy balance modelling and on-site measure-ments to identify the triggers for melt in this extremely dry environment. In order to do this, we focus on understand-ing the connections between meteorological conditions and the surface energy balance on a penitente-free surface on the Guanaco Glacier, in the upper Huasco Valley in the semi-arid Andes of Chile.
2 Site description
Glaciers exist in south-facing, lee slope locations above 4500 m a.s.l. (Nicholson et al., 2010), and cover up to 11 % of the land surface (Gascoin et al., 2011) of the upper Huasco catchments (29◦S, 70◦W,>4000 m above sea level (a.s.l.); Fig. 1). Glaciers are restricted in size due to low precipita-tion rates, and high ablaprecipita-tion rates caused by high levels of shortwave radiation receipt and low humidity (Ginot et al., 2002; Kull et al., 2002; Nicholson et al., 2010; Gascoin et al., 2012).
Guanaco Glacier (Fig. 1) is a relatively large glacier for the region (1.8 km2) that straddles the Chile-Argentina di-vide (29.3◦S, 70.0◦W, 4990–5350 m a.s.l.) (Nicholson et al., 2010). Between 1955/1956 and 2007 the glacier shrank by 0.33 km2, which equates to 15±4 %, and measurements of
the glacier mass balance since 2003/04 have been consis-tently negative, which may be at least partially due to low precipitation rates (Rabatel et al., 2011). The glacier is planar in its highest reaches, but is predominantly terraced (<1 m in
height), and penitentes can be found in the south-western re-gion of the glacier near the discharge outlet. This study con-siders conditions at a point on a planar surface in the upper-most section of the glacier (star in Fig. 1). Here wind speeds are relatively strong throughout the year (average 8.5 m s−1
during the study period), and hourly mean temperatures vary between−25◦C in winter to 5◦C in summer. Relatively high wind speeds coupled with low snow retention experienced on the upper section of the glacier (Gascoin et al., 2012) are un-favourable for the development of penitentes (Corripio and Purves, 2005). Sublimation is expected to dominate the ab-lation regime, because of the aridity of the atmosphere, high wind speeds and low air temperatures (e.g. Bintanja and van den Broeke, 1995; Wagnon et al., 2003; Mölg and Hardy, 2004; Hoffman et al., 2008), however, melting has been ob-served periodically at the surface during the summer months.
Fig. 1.Ikonos image of the upper Huasco Valley (2005), showing the location of Guanaco Glacier and its automatic weather station (star). The insets show the location of the Huasco Valley in Chile, and an oblique photograph of the Guanaco Glacier taken from its southern-eastern side, looking up the glacier.
3 Methods
3.1 Meteorological measurements
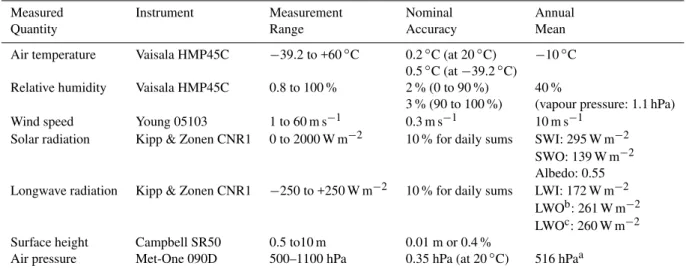
Table 1.Details of the instruments and the annual mean conditions at this site (calculated using data between 1 November 2008–31 October 2010). All measurements were at G-AWS on the glacier surface except for air pressure, which is from a station 3 km away at an elevation of 4927 m a.s.l.
Measured Instrument Measurement Nominal Annual
Quantity Range Accuracy Mean
Air temperature Vaisala HMP45C −39.2 to +60◦C 0.2◦C (at 20◦C) −10◦C
0.5◦C (at−39.2◦C)
Relative humidity Vaisala HMP45C 0.8 to 100 % 2 % (0 to 90 %) 40 %
3 % (90 to 100 %) (vapour pressure: 1.1 hPa)
Wind speed Young 05103 1 to 60 m s−1 0.3 m s−1 10 m s−1
Solar radiation Kipp & Zonen CNR1 0 to 2000 W m−2 10 % for daily sums SWI: 295 W m−2
SWO: 139 W m−2
Albedo: 0.55 Longwave radiation Kipp & Zonen CNR1 −250 to +250 W m−2 10 % for daily sums LWI: 172 W m−2
LWOb: 261 W m−2
LWOc: 260 W m−2
Surface height Campbell SR50 0.5 to10 m 0.01 m or 0.4 %
Air pressure Met-One 090D 500–1100 hPa 0.35 hPa (at 20◦C) 516 hPaa
aValues are elevation corrected from a land-based station. This represents the mean value at G-AWS. bUncorrected values.
cValues corrected for window heating offset.
three “ablation” seasons (austral summer), and two “accumu-lation” seasons (austral winter).
Careful quality control of data from stations in harsh envi-ronments is mandatory before data use (e.g. van den Broeke et al., 2004). The largest errors were expected to be due to riming and solar heating of the instruments. However com-parison of incoming and outgoing shortwave radiation indi-cated that the measurements were not adversely affected by snow cover or riming of the upper sensor, as expected for high-altitude, dry locations (Mölg et al., 2009), and so no corrections were made. Due to power constraints, none of the sensors on the G-AWS are artificially ventilated, which means that the data may be susceptible to errors due to solar heating during periods of high solar radiation and low wind speeds (Georges and Kaser, 2002). However, as the mean wind speed over the period is 9.2 m s−1, and only 3.5 % of the hourly values have wind speeds of<2 m s−1, problems
due to sensor heating are likely to be minimal. Following this rationale, air temperature measurements were not corrected for artificial heating. However, analysis of the outgoing long-wave radiation measurements showed that there were sev-eral hours when measured glacier surface temperature rose above 0◦C, pointing to a significant window heating offset effect (Obleitner and de Wolde, 1999). The manufacturer re-ports a maximum window heating offset of 25 W m−2 per
1000 W m−2of shortwave radiation hitting the pyrgeometer
(Kipp & Zonen, 2002). However field performance testing by Michel et al. (2008) showed that sensor performance was bet-ter than stated, and recommended subtracting 15 W m−2per 1000 W m−2of shortwave radiation. Corrections were made to both incoming and outgoing longwave radiation
measure-ments, respectively. The effect of correcting surface temper-ature on the energy balance is discussed in Sect. 4.3.
Relative humidity and air temperature measurements were used to calculate vapour pressure. Water and ice satura-tion vapour pressure was calculated using the Magnus Teten equation over ice (Murray, 1967) for air temperatures less than 0◦C, and the Sonntag equation over water (Sonntag, 1990) for temperatures greater than 0◦C. Finally, the surface change measurements were smoothed using a spline function robust to outliers to remove noise from the dataset. From the smoothed surface change measurements, the solid precipita-tion in the mass balance model were calculated using a fresh snow density of 60 kg m−3(Cuffey and Paterson, 2010).
3.2 Mass balance modelling
The specific mass balance (b) of a glacier refers to the
differ-ence between accumulation (c) and ablation (a) per unit time
and area and can be computed at local or glacier scales. The model used in this study calculates the mass balance accord-ing to Mölg et al. (2009):
b=csp+QM
LM +
QL
LS +cen, (1)
wherecsp is the sum of solid precipitation; QM is the latent
energy flux of melting; QL is the turbulent latent heat flux;
LM andLS are the latent heat of melting and sublimation,
respectively; and cen is englacial accumulation by
refreez-ing of meltwater in snow or at the interface between ice and snow. The input for thecspis calculated from surface change
measurements,LM andLS are known values, and QM, QL
Sign convention for mass and energy transfer is positive for surface gains and negative for surface losses. The energy bal-ance at the glacier surface is obtained in the model using
R+QS+QL+QP+QG=F, (2)
whereRis the net radiation; QS is the turbulent sensible heat
flux; QP is the heat flux supplied by precipitation; and QG is the subsurface heat flux (Mölg et al., 2008). The QG can be further separated into the conductive heat flux in the sub-surface (QC), and the energy flux from shortwave radiation penetrating through the subsurface (QPS) (Bintanja and van den Broeke, 1995; Mölg et al., 2009).F is the resultant
en-ergy flux at the surface. If the surface temperature is at the melting point (0◦C), andF is positive on the right-hand side of Eq. (2), thenF represents the energy available for melt, or
QM. In this study, QP is ignored because all of the precipi-tation falls as snow and precipiprecipi-tation intensity is low, which means that heat addition due to precipitation is likely to be negligible. The energy balance model used in this study has been described in detail in Mölg et al. (2008, 2009), but the specific application of the model will be outlined here. In this study, the model is run and validated for a point on the glacier surface at an hourly interval. We note that this study only calculates ablation processes operating at the ice surface, not subsurface melt within ice explicitly, and so the amount of potential runoff from the site is likely to be underestimated (Hoffman et al., 2008).
The net radiation is calculated as four separate components directly from measurements. Outgoing longwave radiation is used to calculate surface temperature using the Stefan– Boltzman law, assuming surface emissivity of 1.
The turbulent sensible and latent heat fluxes are calculated using the ‘bulk’ method outlined in Mölg and Hardy (2004), in which measurements of air and surface temperature, rel-ative humidity, and wind speed are used to estimate condi-tions at the glacier surface according to neutral logarithmic gradient profiles, along with surface roughness lengths for momentum (z0 m) and heat/vapour (z0 h). A correction term
accounts for the stability of the boundary layer based on the Richardson number. The values ofz0 mandz0 hvary
accord-ing to surface type, as outlined in Mölg et al. (2009). We use values ofz0 m=2.0 mm and z0 h=0.20 mm for an ice surface; andz0 m=z0 h=0.1 mm for a fresh snow surface, which increases linearly toz0 m=z0 h=4 mm for aged snow (Mölg et al., 2009). The values ofz0 mandz0 hfor an ice
sur-face are from unpublished short-term eddy covariance mea-surements taken 20 m from the G-AWS during March 2010, and are in the range of roughness lengths expected in en-vironments where sublimation dominates (e.g. Cullen et al., 2007; Hoffman et al., 2008; MacDonell et al., 2012). As no penitentes have been observed at the G-AWS location, no values for penitentes were included.
Within the model, the englacial temperature profile is cal-culated using the thermodynamic equation, and includes en-ergy release from QPS and englacial refreezing in the
snow-pack (Mölg et al., 2008, 2009). The calculation of QPS uses coefficients from Bintanja and van den Broeke (1995) for the attenuation with depth, and following the energy con-servation requirement, the flux at the surface is negative. The subsurface model in this study uses 14 vertical layers with boundaries at: 0.0, 0.09, 0.18, 0.3, 0.4, 0.5, 0.6, 0.8, 1.0, 3.0, 6.0, 9.0, 12.0, and 15.0 m depth. The temperature at 15.0 m depth is fixed at−6.5◦C, which is a stable temper-ature taken from five long-line manual tempertemper-ature measure-ments collected at Guanaco Glacier between November 2008 and April 2011. QC is then calculated from the temperature profile.
3.3 Mass balance model evaluation
The mass balance results were validated by comparing the modelled hourly values of surface height change with mea-surements made by the ultrasonic surface height sensor (SR50) at the G-AWS using the Nash–Sutcliffe similarity measure (Nash and Sutcliffe, 1970) and root mean square er-ror calculation (RMSE). Additionally, the results, and partic-ularly the partitioning of ablation between melting and sub-limation, were qualitatively compared with lysimeter mea-surements.
The lysimeters consisted of an upper 10 L container with holes drilled into the floor of the container placed within a 20 L lower container of the same surface dimensions. The upper container was filled with snow, and the lysimeter was dug into the surface, so that the surface of the container was as flush with the glacier surface as practicable. The contain-ers were weighed before and after snow was included, and then twice daily where possible. When melt occurred, the water was removed from the lower container after weighing. Lysimeter measurements were made on the surface of Gua-naco Glacier four times during this study period, however only two of these datasets will be used in this study, as the others have significant errors due to precipitation events dur-ing the course of measurement. The two viable measurement periods were between 9–21 November 2008 and 13–19 April 2009. The comparison made with these measurements is only qualitative because there are not enough measurement points to enable a statistical comparison. Accuracy of this method is estimated to be±10 % (Winkler et al., 2009).
3.4 Meteorological forcing of ablation
The meteorological controls on sublimation were investi-gated by correlating the daily modelled sublimation with daily averages of the main meteorological variables recorded at the AWS. The Pearson correlation coefficient (r) was
relationship with sublimation. As several variables have dis-tributions that deviate from normality and also exhibit tem-poral autocorrelation, the statistical significance for correla-tion was estimated from a Monte Carlo phase permutacorrela-tion test. The sublimation time series was scrambled one thou-sand times in frequency space, by first applying the Fourier transform to the data, scrambling the phases, and then ap-plying the inverse transformation to obtain a surrogate time series with similar statistical properties (Davison and Hink-ley, 1997). Since the Fourier transform requires normal data, a square root transformation was first used to normalize the raw sublimation data. The null distribution (r=0) was ob-tained by correlating the surrogate series with each meteoro-logical variable. Since the correlation coefficient measures the strength of linear relationships, bivariate scatter plots were inspected to verify that no significant deviation from linearity occurred.
Since days with melt constitute rare events that are poorly suited to correlation analysis, the meteorological control on melting was examined by comparing the mean diurnal cy-cle of the energy balance and meteorological drivers of melt days to that for summer days without melting, and the dif-ferences were assessed using a two-tailed Monte Carlo per-mutation test (Davison and Hinkley, 1997). As input to this test, the mean diurnal cycle of the energy balance, modelled surface/subsurface temperatures and associated meteorolog-ical variables were calculated for all days with modelled melt (n=53 days) and were compared with that for sum-mer days without melt (n=310 days). Summer was defined to include all months during which melt occurred, i.e. De-cember to March. The daily cycle was calculated between 20:00 h the previous day to 20:00 h of the current day in or-der to examine preconditioning effects during the night prior to melting. Summer days (n=363) were sampled randomly without replacement (n=53) and the difference between the mean diurnal cycle for sampled days and that of the remain-ing days (n=310) was calculated. The procedure was re-peated 10 000 times and the significance level (p <0.05) was
estimated from the 2.5 % and 97.5 % percentiles of the null distribution at each hour of the diurnal cycle.
4 Results
4.1 Meteorological conditions
Figure 2 shows the daily average meteorological conditions experienced at the Guanaco AWS site. General conditions are dictated by the annual cycle of shortwave radiation re-ceipt. SWI shows a marked seasonal cycle (Fig. 2) that is usually in line with the theoretical receipt at the surface for clear-sky conditions (MacDonell et al., 2013). Daily de-viations are caused by cloud cover, which is episodic and largely restricted to convective storm events in the summer, and frontal precipitation events during the winter (Kull et
0 500
SWI (W m
−2
)
0 0.5 1
α
100 200 300
LWI (W m
−2
)
−30−20 −100 10
Ta (
oC)
0 50 100
RH (%)
0 20 40
U (m s
−1
)
500 520 540
Pa (hPa)
Nov08 Feb09 May09 Aug09 Nov09 Feb10 May10 Aug10 Nov10 Feb110 0.2
0.4
Snowfall (m)
Month
Fig. 2.Average daily incoming shortwave radiation (SWI), albedo (α), incoming longwave radiation (LWI), air temperature (Ta),
rela-tive humidity (RH), wind speed (U), air pressure (Pa) and snowfall measured at the Guanaco AWS from 1 November 2008 to 30 April 2011.
Nov08 Feb09 May09 Aug09 Nov09 Feb10 May10 Aug10 Nov10 Feb11 −160
−140 −120 −100 −80 −60 −40 −20 0 20
Surface change (cm)
Date
Measured Modelled
Fig. 3. Comparison of measured and modelled surface height change between 1 November 2008 and 30 April 2011. The mass balance at G-AWS was negative over the period, and the measured surface change was−1.5 m. The root mean square error (RMSE) of
the model is 4.1 cm (which corresponds to a normalized RMSE of 3 %), and a Nash–Sutcliffe statistic of 0.99.
4.2 Mass balance model evaluation and results
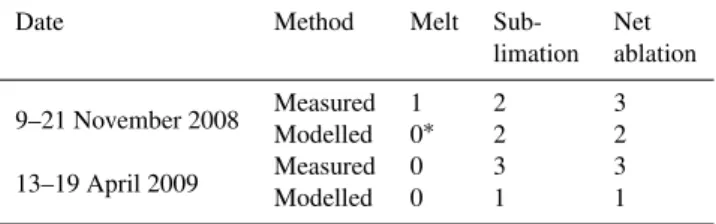
The comparison of modelled and measured surface lower-ing results showed that the model satisfactorily reproduced the net surface height change at this site (Fig. 3). Between 1 November 2008 to 30 April 2011, net modelled sur-face change was−1.45 m, compared with measured surface change of−1.50 m. The RMSE of the modelled result was 4.1 mm and the Nash–Sutcliffe measure was 99 %, indicat-ing that model performance was very good. As most ablation events following snowfalls are relatively well reproduced, there are no detectable losses caused by wind erosion of the snowpack. This is inline with Gascoin et al. (2012) who show that glaciers in the region represent preferential snow depo-sition areas, and that glaciers do not lose much mass by wind transportation. The model underestimated ablation compared to the lysimeter measurements during the two lysimeter mea-surement periods (Table 2); however, the results are within the margin of error of the measurement technique.
The seasonal signal seen in the meteorological data (Fig. 2) is translated into seasonal fluctuations in the energy balance terms (Fig. 4). Net shortwave radiation provides the greatest energy input to the surface throughout the year, al-though it is significantly higher in the summer than the win-ter, largely due to higher SWI. Albedo does not follow a strict seasonal cycle, as variations are generally associated with episodic precipitation events (Fig. 2) and the presence of clouds (Abermann et al., 2013). Throughout the study period, net longwave radiation was the largest energy loss from the surface, because atmospheric longwave emissions are con-sistently very low (Fig. 2; MacDonell et al., 2013). The tur-bulent latent heat flux was always negative (Fig. 4) indicating that the surface was continually losing mass via sublimation. At a seasonal scale the latent heat flux followed the pattern
Table 2.Comparison between lysimeter and modelled ablation re-sults (mm w.e. day−1).
Date Method Melt Sub- Net
limation ablation
9–21 November 2008 MeasuredModelled 10∗ 22 32
13–19 April 2009 MeasuredModelled 00 31 31
∗Since measured LWO during 9–21 November 2008 did not indicate melting, no
meltwater flux could be modelled.
of energy supply from SWI. The subsurface heat flux was on average of smaller magnitude than the other fluxes, and fluc-tuated between positive and negative values throughout the study period, which basically reflects the winter and summer season, respectively. Sublimation was the main cause of ab-lation, and it accounted for 81 % of total mass ablation over the study period (Fig. 5; Table 3). The model results indi-cate that generation of meltwater runoff at the site of G-AWS is restricted to the high summer period spanning December– March.
4.3 Model sensitivity
The mass balance model results are subject to some level of uncertainty, given errors in the measurement of meteo-rological variables, and the selection of model parameters. The model uncertainty was assessed using a single parame-ter sensitivity study whereby the model was re-run using the input data and parameters varied one at a time. Model iter-ations included using uncorrected longwave radiation data; modified input meteorological data spanning the precision of the respective sensors (Table 1); and modified model param-eters spanning their plausible ranges (Table 4). Sublimation, melt and net ablation results were compared with the original model to assess uncertainties on mass change, and modelled surface lowering was compared with measurements to calcu-late the RMSE and bias on modelled results.
Table 3.Sum of mass fluxes per season per year (mm w.e.). All single terms are shown as absolute values, but the mass balance result (last line) considers the sign convention. NB: Summer refers to November–April, winter refers to May–October.
Variable Summer Winter Summer Winter Summer All
08/09 2009 09/10 2010 10/11
Snowfall 19 21 28 16 27 112
Deposition 4 4 3 5 3 19
Refreezing <1 0 <1 0 <1 <1
Accumulation 23 25 31 21 30 131
Melt 42 0 141 0 88 271
Sublimation 225 192 339 186 223 1164
Ablation 267 192 480 186 311 1435
Mass balance −244 −167 −449 −165 −281 −1304
Nov08 Feb09 May09 Aug09 Nov09 Feb10 May10 Aug10 Nov10 Feb11 −140
−120 −100 −80 −60 −40 −20 0 20 40
Time (month)
Mass (mm w.e.)
Sublimation Melt Accumulation
Fig. 4. Monthly totals of melt, sublimation and accumulation modelled at the G-AWS site for the period 9 October 2008– 30 April 2011. At the G-AWS, 1164 mm w.e. of sublimation and 271 mm w.e. of melt were calculated.
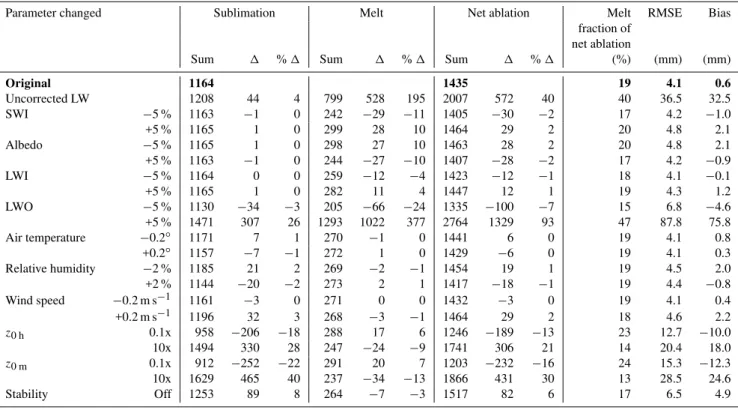
All measured meteorological variables were varied ac-cording to their reported accuracy, and from this analysis, modifying incoming shortwave radiation, albedo, incoming longwave radiation, air temperature, relative humidity, or wind speed does not change the RMSE by more than 0.7 mm compared with the standard model run (Table 4). Only in-creasing the outgoing longwave radiation by 5 % causes a marked change to the RMSE (RMSE = 87.8 mm). Increasing the outgoing longwave radiation by 5 % causes an increase of sublimation of 26 %, but more significantly, it causes an increase in total melt of 377 % compared with the original model run due to the increase in surface temperature calcu-lated from outgoing longwave measurements. These results further stress the importance of using appropriate parameter-izations of surface temperature on cold glacier surfaces.
Errors can also be caused by the selection of fixed param-eters within the model, especially in the calculation of the turbulent heat fluxes. As the turbulent heat fluxes,
specifi-Nov08 Feb08 May09 Aug09 Nov09 Feb10 May10 Aug10 Nov10 Feb11 −300
−200 −100 0 100 200 300
Time (month)
Energy flux density (W m
−2
)
SW* LW* QS QE QG QM
Fig. 5.Monthly averages of the modelled heat fluxes at the Guanaco Glacier surface for the period 9 October 2008–30 April 2011. (Note: SW∗ is net shortwave radiation, LW∗ is net longwave radiation,
QS is the sensible heat flux, QL is the latent heat flux, QG is the subsurface heat flux, and QM is the energy consumed by melt).
Table 4.Sensitivity analysis undertaken for several model variables. The uncorrected longwave radiation is tested; the other variations to the meteorological input data (i.e. shortwave radiation, longwave radiation, air temperature, relative humidity, wind speed, albedo) are based on the instrument precision; and the roughness length change is based on standard sensitivity tests run in other glacier energy balance studies (e.g. Giesen et al., 2008). The RMSE and bias results compare the respective model result with measurements of surface lowering.
Parameter changed Sublimation Melt Net ablation Melt RMSE Bias
fraction of net ablation
Sum 1 %1 Sum 1 %1 Sum 1 %1 (%) (mm) (mm)
Original 1164 1435 19 4.1 0.6
Uncorrected LW 1208 44 4 799 528 195 2007 572 40 40 36.5 32.5
SWI −5 % 1163 −1 0 242 −29 −11 1405 −30 −2 17 4.2 −1.0
+5 % 1165 1 0 299 28 10 1464 29 2 20 4.8 2.1
Albedo −5 % 1165 1 0 298 27 10 1463 28 2 20 4.8 2.1
+5 % 1163 −1 0 244 −27 −10 1407 −28 −2 17 4.2 −0.9
LWI −5 % 1164 0 0 259 −12 −4 1423 −12 −1 18 4.1 −0.1
+5 % 1165 1 0 282 11 4 1447 12 1 19 4.3 1.2
LWO −5 % 1130 −34 −3 205 −66 −24 1335 −100 −7 15 6.8 −4.6
+5 % 1471 307 26 1293 1022 377 2764 1329 93 47 87.8 75.8
Air temperature −0.2◦ 1171 7 1 270 −1 0 1441 6 0 19 4.1 0.8
+0.2◦ 1157 −7 −1 272 1 0 1429 −6 0 19 4.1 0.3
Relative humidity −2 % 1185 21 2 269 −2 −1 1454 19 1 19 4.5 2.0
+2 % 1144 −20 −2 273 2 1 1417 −18 −1 19 4.4 −0.8
Wind speed −0.2 m s−1 1161 −3 0 271 0 0 1432 −3 0 19 4.1 0.4
+0.2 m s−1 1196 32 3 268 −3 −1 1464 29 2 18 4.6 2.2
z0 h 0.1x 958 −206 −18 288 17 6 1246 −189 −13 23 12.7 −10.0
10x 1494 330 28 247 −24 −9 1741 306 21 14 20.4 18.0
z0 m 0.1x 912 −252 −22 291 20 7 1203 −232 −16 24 15.3 −12.3
10x 1629 465 40 237 −34 −13 1866 431 30 13 28.5 24.6
Stability Off 1253 89 8 264 −7 −3 1517 82 6 17 6.5 4.9
The specification of roughness lengths can be problematic, as they can be highly variable over space and time (Brock et al., 2006). As roughness lengths are difficult to measure, values are often taken from published literature (e.g. Mölg and Hardy, 2004), or are used as tuning parameters to fit the measured ablation results (e.g. Hoffman et al., 2008). In this study, the roughness lengths were selected from short-term unpublished eddy covariance measurements in the case of ice surfaces, and from published literature in the case of snow surfaces (Mölg et al., 2009). To determine the range of error involved with modifying the roughness lengths, the values for the roughness length of momentum, and the roughness length of heat/vapour were altered by an order of magnitude (each separately) (Table 4). Decreasing the roughness length of momentum by an order of magnitude produced decreases of sublimation and net ablation values larger than 15 % com-pared to the original model results. Comparatively, increas-ing the roughness length of momentum caused an increase of 40 % of sublimation, but decreased melt by 13 %. Increas-ing or decreasIncreas-ing the roughness length of heat/vapour caused less than a 10 % change in melt, but larger changes in subli-mation totals. Decreasing (increasing) the roughness length of heat/vapour by an order of magnitude caused an 18 % de-crease (28 % inde-crease) in sublimation. These results suggest that the selection of roughness lengths in this environment
needs to be undertaken in a well-considered manner. How-ever, none of the variations in meteorological input variables or model parameters change the general ablation characteris-tics.
5 Discussion
5.1 Comparison of ablation results with other studies
The fraction of net ablation caused by melt is much smaller than that generally calculated for temperate and maritime glaciers (Table 3; Fig. 5; e.g. Giesen et al., 2008; Gillet and Cullen, 2011). However, they are within the range of rates and ratios recorded in arid high-altitude or polar environ-ments (e.g. Kull et al., 2002; Mölg et al., 2008; Hoffman et al., 2008).
As was previously found for other glaciers in the semi-arid Andes of Chile (Kull et al., 2002), sublimation is the dominant ablation process on the upper Guanaco Glacier (Ta-ble 3). At Guanaco Glacier, average daily sublimation rates calculated across the study period (mean 1.3 mm w.e. d−1)
insignificant and that sublimation was the dominant form of ablation. Sublimation accounted for losses of 46 % of the total estimated precipitation at the summit for the period 1962–1999 at a rate of 0.9 mm w.e. d−1(Ginot et al., 2006).
Rates were also measured and modelled for a six-day pe-riod during February 1999, and values ranged between 1.3– 1.9 mm w.e. d−1(Ginot et al., 2001; Kull and Grosjean, 2000;
Kull et al., 2002). As rates in February are likely to be among the highest occurring throughout the year, it is likely that the mean annual sublimation rate lies between 0.9–1.3 mm w.e. This means that the rate experienced at Guanaco Glacier throughout the year is at the upper limit lower of that cal-culated for the upper Tapado Glacier.
Comparisons of sublimation and melt rates can also be made with high-altitude glaciers from tropical regions (e.g. Wagnon et al., 1999a, b; Sicart et al., 2005; Mölg et al., 2008, 2009). The striking difference between the energy balance regimes on these glaciers with Guanaco Glacier is the seasonality of signal. In the tropics, tradi-tional winter-summer patterns are replaced with dry-wet sea-son regimes. This means that ablation behaviour is often dic-tated more by albedo changes driven by precipitation and hu-midity changes, than by the annual progression of incoming shortwave radiation, as experienced in sub-tropical regions (e.g. Wagnon et al., 1999a). As on Guanaco Glacier, all stud-ied glaciers in the tropics experience sublimation, and often record intermittent melt. However, the tropical glaciers usu-ally experience a higher melt fraction than that calculated for Guanaco Glacier (e.g. Mölg et al., 2008, 2009), and sublima-tion is less important during the wet season (e.g. Wagnon et al., 1999a, b; Winkler et al., 2009), whereas the importance of sublimation is relatively constant throughout the year at Guanaco Glacier, even though the rate may change (Fig. 5).
Continuous sublimation rates, and episodic surface melt-ing has also been described on glaciers in the McMurdo Dry Valleys, Antarctica (e.g. Lewis et al., 1998; Hoffman et al., 2008; MacDonell et al., 2012). Surface energy balance stud-ies have all shown the dominance of sublimation on ice sur-faces in this region, and have intimated that not only is melt restricted to approximately two months in the austral sum-mer, but within this period, melting is episodic and spatially constrained (Lewis et al., 1998; Hoffman et al., 2008). Melt at the surface is often restricted to areas where albedo is low-ered due to the incorporation of sediment (e.g. MacDonell et al., 2012), or to where wind speeds are reduced by topo-graphic features (e.g. Johnston et al., 2005). Conditions con-ducive to sublimation are the main limiting factors of surface melt in this environment (Hoffman et al., 2008), and the only time when significant melt events on glacier surfaces have been recorded is during prolonged “high” temperature events (e.g. Doran et al., 2008).
5.2 Meteorological conditions driving sublimation processes
Results from the correlation analysis (Table 5) between raw daily sublimation and meteorological variables, i.e. before removing the seasonal cycle, highlights the seasonal nature of the sublimation-driven ablation on upper Guanaco glacier. The daily sublimation rate is most strongly correlated with net shortwave radiation (r=0.75), which is mainly driven
by the seasonal cycle of incoming shortwave radiation (r= 0.61) and partly by the varying albedo (r= −0.57). The
albedo shows only a weak seasonal signal, as snow depo-sition at the AWS is irregular and episodic throughout the year (Fig. 2). A decreasing albedo augments the absorp-tion of solar radiaabsorp-tion at the surface, and it also implies an increased roughness length due to snow aging and ice ex-position, which further promotes sublimation. Hence on a seasonal basis, sublimation increases during summer under strong incoming solar radiation and tends to decrease during episodic albedo rises throughout the year.
The correlation using detrended data reveals sub-seasonal meteorological forcing of sublimation. Day-to-day changes (i.e. detrended series) in vapour pressure (r= −0.57) and
wind speed (r=0.39) are significantly correlated with
sub-limation. Hence, as expected, drier and windier weather en-hance sublimation. As at the seasonal scale, sublimation is positively correlated with the net solar radiation (r=0.56)
and inversely correlated with albedo (r= −0.57), while a
weaker correlation is found with the incoming solar radiation (r=0.40). This means than at sub-seasonal timescale,
day-to-day variations in incoming solar radiation are not the main driver of sublimation. Instead, day-to-day changes in surface albedo appear to be more important in driving sublimation at the event scale. The coefficient of variation (CV) for the de-trended albedo (CV = 13.6) is much greater than that of the detrended incoming shortwave radiation (CV = 2.5), which means that at a sub-seasonal scale the albedo is more im-portant for driving the net solar radiation than are variations in incoming solar radiation. The episodic albedo rises, when associated with a snowfall, also imply a decrease in rough-ness length and hence of sublimation. The negative corre-lation found with incoming longwave radiation (r= −0.35)
and cloud cover (r= −0.33) reflect, to a lesser extent, the
fact that overcast weather enhances incoming longwave ra-diation (MacDonell et al., 2013) and occurs with higher rel-ative humidity, thus increasing vapour pressure and decreas-ing sublimation. As clouds have been found to significantly augment the albedo at this site (Abermann et al., 2013), and elsewhere (e.g. Jonsell et al., 2003), the negative correlation between albedo and sublimation must partly reflect the effect of clouds, and the lower correlation between sublimation and snowfall (r= −0.22) tends to confirm this. A negative
cor-relation with the east–west component of the wind (u-wind, r=0.33) implies that sublimation is somewhat enhanced
Table 5. Correlation coefficient (r) between daily sublimation (mm w.e. day−1) and principal meteorological variables recorded at
the AWS.rdetrended is the correlation coefficient using detrended
data, i.e. after removing the seasonal cycle for each variable ex-cept the cloud cover and snowfall, which are bounded by zero. The 5 % significance level determined from the permutation test is in-dicated in parenthesis and significant correlations are inin-dicated in bold. Variables are ordered from the largest to smallestrdetrended
absolute value.
Variable r rdetrended
Vapour pressure −0.32(−0.23) −0.57(−0.14)
Albedo −0.57(−0.22) −0.57(−0.1)
SW∗ 0.75(0.24) 0.56(0.12)
SWI 0.61(0.24) 0.4(0.1)
Wind speed 0.17(0.16) 0.39(0.09) LWI −0.36(−0.14) −0.35(−0.11)
Cloud cover −0.48(−0.15) −0.32(−0.13)
Snowfall −0.29(−0.09) −0.22(−0.08)
Air temperature 0.26(0.23) 0.16(0.1)
summary, the correlation analysis shows that on a seasonal scale, sublimation is driven by the energy available at the surface, which is dominated by the seasonal cycle in incom-ing solar radiation and by more episodic changes in albedo. At the event scale, i.e., after removing the seasonal cycle in the data, variations in the net solar radiation, predominantly driven by episodic albedo variations, as well as air humid-ity variabilhumid-ity, mainly drive the sublimation rates. Dry, windy and clear weather conditions are the most favourable for high sublimation rates.
5.3 Meteorological processes controlling surface melting
Surface melting is rare on upper Guanaco glacier, and as such, modelled melt follows an extreme value distribution that is poorly suited to linear correlation analysis as was used for sublimation. Moreover, because Guanaco is a cold glacier, the triggering of surface melting may also depend on preconditioning. The AWS on the high and exposed upper Guanaco glacier probably samples amongst the most extreme meteorological conditions found in the area, which makes it interesting to understand when, and how, melting occurs here.
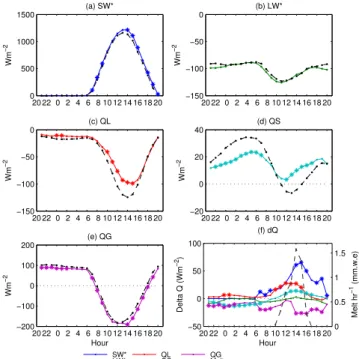
The mean diurnal energy balance cycle for days with mod-elled melt shows increased daytime contribution of net solar radiation (SW∗, Fig. 6a) while the net longwave radiation diurnal cycle remains essentially unchanged (Fig. 6b). How-ever, daytime differences in SW∗ are only significant from 13:00 onward, i.e. shortly after solar noon. Closer inspec-tion revealed that higher afternoon incoming solar radiainspec-tion (SWI) is responsible for the higher SW∗, while the albedo does not show clear differences. Differences in SW∗appear to be driven by a slightly decreased incidence of afternoon
20 22 0 2 4 6 8 10 12 14 16 18 20 0
500 1000 1500
Wm
−2
(a) SW*
20 22 0 2 4 6 8 10 12 14 16 18 20 −150
−100 −50 0
Wm
−2
(b) LW*
20 22 0 2 4 6 8 10 12 14 16 18 20 −150
−100 −50 0
Wm
−2
(c) QL
20 22 0 2 4 6 8 10 12 14 16 18 20 −20
0 20 40
Wm
−2
(d) QS
20 22 0 2 4 6 8 10 12 14 16 18 20 −200
−100 0 100 200
Wm
−2
Hour (e) QG
20 22 0 2 4 6 8 10 12 14 16 18 20 −50
0 50 100
Delta Q (Wm
−2
)
Hour
0 0.5 1 1.5
Melt hr
−1
(mm.w.e)
(f) dQ
SW*
LW* QLQS QGMelt
Fig. 6. Mean diurnal cycle of the surface energy fluxes (Q) on
the upper Guanaco glacier during summer for days with melting (coloured lines) and days without melting (black lines).(a) Net shortwave radiation flux;(b) net longwave radiation flux;(c) tur-bulent latent heat flux;(d)sensible heat flux;(e)total ground heat flux;(f)difference between melt and non-melt days (colour lines, left axis), and mean hourly melting rate (black dotted line, right axis).
convective clouds, typical of summer in this area, and as measured by an effective cloud cover index (neff, MacDonell
et al., 2013). A correlation ofr= −0.98 between the SWI
difference and the cloud cover index difference between melt and non-melt days corroborates this conclusion. However the low cloud cover for both melt and non-melt days (neff<
0.15) reflect the predominant clear skies during summer and
net solar radiation (SW∗), decreased QL loss (reduced subli-mation), and a slight increase in the sensible heat flux (QS). On the other hand, a slight decrease in QG and QS is ob-served on nights prior to melting days. The higher energy input during melting days is used to melt the surface with a mean maximum rate of 1.6 mm h−1 (Fig. 6f, right axis).
The mean modelled subsurface temperature profile (Fig. 7) shows that nighttime cooling is less pronounced during melt days than during non-melt days. During melt days the glacier surface layers heat up rapidly, quickly removing the night-time cold wave and allowing the surface to reach the melting point typically at midday. The difference in subsurface tem-peratures shows an upward warming trend during melt days (Fig. 7c), which indicates a smoother near-surface tempera-ture gradient and reduced upward heat conduction (QC) at night, and a steeper gradient and increased downward heat conduction during daytime (Fig. 6e). Increased penetration of solar radiation during the day (QPS, not shown), due to the higher SW∗on melt days, also explains part of the more negative glacier heat flux (QG) between 12:00 and 16:00 (Fig. 6e). Calculating melt rates can also be challenging due to the prevalence of melt below the surface caused by radia-tive heating (Brandt and Warren, 1993; Hoffman et al., 2008). Unless absorbed shortwave radiation is removed quickly via conduction into the ice body, the subsurface ice may begin to melt, even if the surface temperature is below freezing. The modelled subsurface temperature occasionally reached the melting point within the first metre, which suggests that subsurface melting may occur at the site, and so that total runoff from the AWS site may be underestimated.
The surface energy balance represents the direct link be-tween the weather and the glacier mass-balance. Prevailing meteorological conditions recorded at the AWS during days with melting show on average about 4◦C higher tempera-tures (Fig. 8a), with air temperatempera-tures reaching above 0◦C from 11:00 h to 17:00 h. This allows for a positive sensible heat flux to the glacier surface during this time, as the surface is near or at 0◦C. The vapour pressure (Fig. 8b) is also notice-ably higher, while the wind speed is much reduced (Fig. 8d) during days with melting, which explains the reduced subli-mation rates (or for hours when the surface melts, reduced evaporation) and the excess energy available for warming and melting the surface. These warmer, more humid and calm weather conditions occur under high-pressure systems (Fig. 8c). The wind direction, (Fig. 8e) shows a slight deflec-tion south of the predominant northwest flow in the morning, but overall there is not a strong directional discrepancy of air flow between days with and without melting.
In conclusion, the prevailing cold, dry and windy weather conditions on the upper Guanaco glacier promote large sub-limation losses which dominate ablation. The high solar ra-diation, low vapour pressure and the strong winds, which in-crease turbulence and drive upward moisture transport, both favour sublimation. The frequently exposed ice surface, by augmenting the aerodynamic roughness, also further
pro-22 0 2 4 6 8 10 12 14 16 18 20 0
0.5
1
Depth (m)
(a) Melt
22 0 2 4 6 8 10 12 14 16 18 20 0
0.5
1
Depth (m)
(b) No−melt
22 0 2 4 6 8 10 12 14 16 18 20 0
0.5
1
Depth (m)
Hour (c) melt−nomelt
258.5 259 259.5 260 260.5 261 261.5 262 262.5 263 263.5 264 264.5 265 265.5 266 266.5 267 267.5 268 268.5 269 269.5 270 270.5 271 271.5 272 272.5 T(ºK)
0 0.5 1 1.5 2 2.5 3 dT(ºK)
Fig. 7.Mean diurnal cycles of surface and subsurface temperatures for(a)days with melting;(b) summer days without melting;(c) melt minus non-melt days.
motes sublimation losses. High-pressure systems in summer bring occasional breaks to these extreme conditions, allow-ing the glacier surface to warm and melt for a few hours in the afternoon. The clear weather associated with the higher air pressure increases the incoming solar radiation, which is the main energy source for warming the glacier surface in the morning and melting in the afternoon. However, the low wind speed and higher vapour pressure, by reducing subli-mation, is also instrumental in making more energy available for surface melting, as is the day time air temperature above 0◦C, which drive a positive sensible heat flux to the melting surface.
6 Conclusions
20 22 0 2 4 6 8 10 12 14 16 18 20 −10
−5 0 5
ºC
(a) Air temperature
20 22 0 2 4 6 8 10 12 14 16 18 20 0
1 2 3
hPa
(b) Vapor pressure
20 22 0 2 4 6 8 10 12 14 16 18 20 516
518 520 522 524
hPa
(c) Air pressure
20 22 0 2 4 6 8 10 12 14 16 18 20 0
2 4 6 8 10
ms
−1
(d) Wind speed
20 22 0 2 4 6 8 10 12 14 16 18 20 180
240 300 360
Degrees
(e) Wind direction
Hour
20 22 0 2 4 6 8 10 12 14 16 18 20 0
0.05 0.1 0.15 0.2
Neff
(f) Effective cloud cover index
Hour
Fig. 8.Mean diurnal cycle in meteorological conditions for days with melt (grey line) and days without melt (black lines). Wind di-rection is calculated from the meanu, vorthogonal components.
Hours during which melt days are statistically different than non-melt days (p <0.05) are indicated by an asterisk. The same
permu-tation test used for energy fluxes was used.
closely resembles those reported in the McMurdo Dry Val-leys, Antarctica (e.g. Hoffman et al., 2008; MacDonell et al., 2012), and in high-altitude tropical regions (e.g. Mölg et al., 2008; Winkler et al., 2009).
The studied site on the Guanaco Glacier has a net loss be-tween 1 November 2008 and 30 April 2011, which follows the trend outlined in Rabatel et al. (2011). Modelled ablation is dominated by sublimation, however episodic melting oc-curs. Sublimation is most strongly related to net shortwave radiation, incoming shortwave radiation, albedo and vapour pressure. Sublimation represents a dominant control on melt-ing. That is, melt only occurs when energy used by subli-mation (i.e. the turbulent latent heat flux) is relatively small, which is when relative humidity is relatively high and the wind speed is low. Melt days are restricted to the summer, and to relatively warm, humid, calm conditions with high air pressure relative to non-melt days.
Sensitivity analyses show that ablation is sensitive to changes in surface temperature and roughness lengths, which suggests that these properties need to be well constrained for successful energy balance modelling on glaciers in this area. Modelled ablation is sensitive to the surface tempera-ture used in the calculation as the measured temperatempera-ture is often close to, but not at the melting point. This has impor-tant implications both for parameterizing surface
tempera-ture, using measurements and for understanding possible fu-ture changes in the surface energy balance at this site.
Accurately determining roughness lengths is especially important when considering distributed modelling of energy balance processes over glaciers in this region as surfaces are generally heterogeneous, with penitente coverage vary-ing both in space and time. As penitentes form in the lower reaches of the Guanaco Glacier, the energy balance calcu-lated here is unlikely to be representative of the glacier as a whole, but is likely to well-represent the upper reaches where penitentes are not found, and melt is rarely observed.
This study is a first step in understanding glacier contribu-tion to streamflow in the semi-arid Andes of Chile. Further distributed modelling is needed to assess glacier contribu-tion to runoff for whole catchments, which requires accurate modelling of planar and penitente-covered surfaces. How-ever, in order to achieve this aim, an understanding of the effect of penitentes on surface roughness is required. Addi-tionally, as glaciers represent only one source of water to the catchment, more detailed models of snow processes such as that by Gascoin et al. (2012) are also recommended.
Acknowledgements. S. MacDonell was supported by FONDECYT Postdoctoral grant No. 3110053. We also thank the Barrick Gold Corporation for logistical support of this study as part of a glacier monitoring project in the semi-arid Andes, and the glaciology group at CEAZA for help in the field and the AWS installation. We are grateful for helpful comments from J. Corripio, the two anonymous reviewers and the handling editor V. Radi´c.
Edited by: V. Radic
References
Abermann, J., Kinnard, C., and MacDonell, S. Albedo variations of glacier surfaces in the Chilean Dry Andes, submitted, 2013. Bintanja, R.:. On the glaciological, meteorological, and
climatolog-ical significance of Antarctic blue ice areas, Rev. Geophys., 37, 337–359, 1999.
Bintanja, R. and van den Broeke, M. R.: The surface energy balance of Antarctic snow and blue ice, J. Appl. Meteorol., 34, 902–926, 1995.
Brandt, R. E. and Warren, S. G.: Solar heating rates and temperature profiles in Antarctic snow and ice, J. Glaciol., 39, 99–110, 1993. Brock, B. W., Willis, I. C., and Sharp, M. J.: Measurement and pa-rameterization of surface roughness variations at Haut Glacier d’Arolla, Switzerland, J. Glaciol., 52, 281–297, 2006.
Corripio, J. G. and Purves, R. S.: Surface energy balance of high altitude glaciers in the central Andes: The effect of snow peni-tentes, in Climate and Hydrology in Mountain Areas, edited by: de Jong, C., Collins, D., and Ranzi, R., John Wiley, London, 15– 27, 2005.
Cullen, N. J., Mölg, T., Kaser, G., Steffen, K., and Hardy, D.: Energy-balance model validation on the top of Kilimanjaro, Tan-zania, using eddy covariance data, Ann. Glaciol. 46, 227–233, 2007.
Davison, A. and Hinkley, D.: Bootstrap methods and their applica-tion, Cambridge University Press, Cambridge, 1997.
Doran, P. T., McKay, C. P., Fountain, A. G., Nylen, T., McKnight, D. M., Jaros, C., and Barrett, J. E.: Hydrologic response to ex-treme warm and cold summers in the McMurdo Dry Valleys, East Antarctica, Antarct. Sci., 20, 499–509, 2008.
Favier, V., Falvey, M., Rabatel, A., Praderio, E., and López, D.: Interpreting discrepancies between discharge and precipitation in high-altitude area of Chile’s Norte Chico region (26–32◦S),
Water Resour. Res., 45, W02424, doi:10.1029/2008WR006802, 2009.
Gascoin, S., Kinnard, C., Ponce, R., Lhermitte, S., MacDonell, S., and Rabatel, A.: Glacier contribution to streamflow in two head-waters of the Huasco River, Dry Andes of Chile, The Cryosphere, 5, 1099–1113, doi:10.5194/tc-5-1099-2011, 2011.
Gascoin, S., Lhermitte, S., Kinnard, C., Borstel, K., and Liston, G. E.: Wind effects on snow cover in Pascua-Lama, Dry Andes of Chile, Adv. Water Resour., 55, 25–39, doi:10.1016/j.advwatres.2012.11.013, 2012.
Georges, C. and Kaser, G.: Ventilated and unventilated air temperature measurements for glacier-climate studies on a tropical high mountain site, J. Geophys. Res., 107, 4775,doi:10.1029/2002JD002503, 2002.
Giesen, R. H., van den Broeke, M. R., Oerlemans, J., and An-dreassen, L. M.: Surface energy balance in the ablation zone of Midtdalsbreen, a glacier in southern Norway: Interannual vari-ability and the effect of clouds, J. Geophys. Res., 113, D21111, doi:10.1029/2008JD010390, 2008.
Gillet, S. and Cullen, N.: Atmospheric controls on summer ablation over Brewster Glacier, New Zealand, Int. J. Climatol., 31, 2033– 2048, 2011.
Ginot, P., Kull, C., Schwikowski, M., Schotterer, U., and Gäeggeler, H. W.: Effects of postdepositional processes on snow composi-tion of a subtropical glacier (Cerro Tapado, Chilean Andes), J. Geophys. Res., 106, 32375–32386, 2001.
Ginot, P., Schwikowski, M., Schotterer, U., Stichler, W., Gaggeler, H. W., Francou, B., Gallaire, R., and Pouyaud, B.: Potential for climate variability reconstruction from Andean glaciochemical records, Ann. Glaciol., 35, 443–450, 2002.
Ginot, P., Kull, C., Schotterer, U., Schwikowski, M., and Gäggeler, H. W.: Glacier mass balance reconstruction by sublimation in-duced enrichment of chemical species on Cerro Tapado (Chilean Andes), Clim. Past, 2, 21–30, doi:10.5194/cp-2-21-2006, 2006. Hoffman, M. J., Fountain, A. G., and Liston, G. E.:
Sur-face energy balance and melt thresholds over 11 years at Taylor Glacier, Antarctica, J. Geophys. Res., 113, F04014, doi:10.1029/2008JF001029, 2008.
Johnston, R. R., Fountain, A. G., and Nylen, T. H.: The origin of channels on lower Taylor Glacier, McMurdo Dry Valleys, Antarctica, and their implication for water runoff, Ann. Glaciol., 40, 1–7, 2005.
Jonsell, U., Hock, R., and Holmgren, B.: Spatial and temporal vari-ations in albedo on Storglaciaren, Sweden, J. Glaciol., 49, 59–68, 2003.
Kipp & Zonen: CNR1 net radiometer instruction manual version 0706, Kipp & Zonen, Delft, The Netherlands, 2002.
Kull, C. and Grosjean, M.: Late Pleistocene climate conditions in the north Chilean Andes drawn from a climate-glacier model, J. Glaciol., 46, 622–632, 2000.
Kull, C., Grosjean, M., and Veit, H.: Modeling modern and late Pleistocene Glacio-climatological conditions in the north Chilean Andes (29–30◦S), Clim. Change, 52, 359–381, 2002.
Lewis, K. J., Fountain, A. G., and Dana, G. L.: Surface energy bal-ance and meltwater production for a Dry Valley glacier, Taylor Valley, Antarctica, Ann. Glaciol., 27, 603–609, 1998.
MacDonell, S., Nicholson, L., and Kinnard, C.: Parameterisation of incoming longwave radiation over glacier surfaces in the semi-arid Andes of Chile, Theor. Appl. Climatol., 111, 513–528, 2013. MacDonell, S. A., Fitzsimons, S. J., and Mölg, T.: Seasonal sed-iment fluxes forcing supraglacial melting on the Wright Lower Glacier, McMurdo Dry Valleys, Antarctica, Hydrol. Process., doi:10.1002/hyp.9444, 2012.
Michel, D., Philipona, R., Ruckstuhl, C., Vogt, R., and Vuilleumier, L.: Performance and uncertainty of CNR1 Net Radiometers dur-ing a one-year field campaign, J. Atmos. Ocean. Technol., 25, 442–451, 2008.
Mölg, T. and Hardy D. R.: Ablation and associated energy balance of a horizontal glacier surface on Kilimanjaro, J. Geophys. Res. 109, D16104, doi:10.1029/2003JD004338, 2004.
Mölg, T., Cullen, N., Hardy, D. R., Kaser, G., and Klok, L.: Mass balance of a slope glacier on Kilimanjaro and its sensitivity to climate, Int. J. Climatol., 28, 881–892, 2008.
Mölg, T., Cullen, N. J., Hardy, D. R., Winkler, M., and Kaser, G.: Quantifying climate change in the tropical midtroposphere over East Africa from glacier shrinkage on Kilimanjaro, J. Climate, 22, 4162–4181, 2009.
Murray, F. W.: On the computation of saturation vapor pressure, J. Appl. Meteorol., 6, 203–204, 1967.
Nash, J. E. and Sutcliffe, J. V.: River flow forecasting through con-ceptual models. Part I – A discussion of principles, J. Hydrol., 10, 282–290, 1970.
Nicholson, L., Marín, J., Lopez, D., Rabatel, A., Bown, F., and Rivera, A.: Glacier inventory of the upper Huasco valley, Norte Chico, Chile: glacier characteristics, glacier change and compar-ison with central Chile, Ann. Glaciol., 50, 111–118, 2010. Obleitner, F. and De Wolde, J.: On intercomparison of instruments
used within the Vatnajökull glacio-meteorological experiment, Bound.-Lay. Meteorol., 92, 25–35, 1999.
Rabatel, A., Castebrunet, H., Favier, V., Nicholson, L., and Kin-nard, C.: Glacier changes in the Pascua-Lama region, Chilean Andes (29◦S): recent mass balance and 50 yr surface area
vari-ations, The Cryosphere, 5, 1029–1041, doi:10.5194/tc-5-1029-2011, 2011.
Sicart, J. E., Wagnon, P., and Ribstein, P.: Atmospheric controls of the heat balance of Zongo Glacier (16◦S, Bolivia), J. Geophys.
Res., 110, D12106, doi:10.1029/2004JD005732, 2005.
Sonntag, D.: Important new values of the physical constants of 1986, vapor pressure formulations based on the ITC-90, and psy-chrometer formulae, Z. Meteorol., 40, 340–344, 1990.
Wagnon, P., Ribstein, P., Francou, B., and Pouyaud, B.: Annual cy-cle of energy balance of Zongo Glacier, Cordillera Real, Bolivia, J. Geophys. Res., 104, 3907–3923, 1999a.
Wagnon, P., Ribstein, P., Kaser, G., and Berton, P.: Energy bal-ance and runoff seasonality of a Bolivian glacier, Global Planet. Change, 22, 49–58, 1999b.
Wagnon, P., Sicart, J.-E., Berthier, E., and Chazarin, J.-P.: Winter-time high-altitude surface energy balance of a Bolivian glacier, Illimani, 6340 m above sea level, J. Geophys. Res., 108, 4177, doi:10.1029/2002JD002088, 2003.