Article
Printed in Brazil - ©2017 Sociedade Brasileira de Química 0103 - 5053 $6.00+0.00
*e-mail: [email protected]
Allergenic Fragrances Analysis in Brazilian Perfumes by Headspace Solid Phase
Microextraction and Gas Chromatography-Mass Detector (HS-SPME-GC-MS)
Clêrton L. Gomes,a,b Ari C. A. de Lima,c Pablo G. A. Barbosa,a Rouse S. Costa,a
Diego Q. Melod and Ronaldo F. Nascimento*,a
aDepartamento de Química Analítica e Físico-Química, bloco 940, Centro de Ciências,
Universidade Federal do Ceará, Campus do Pici, 60440-900 Fortaleza-CE, Brazil
bInstituto Federal de Educação, Ciência e Tecnologia do Ceará, Campus Aracati,
62800-000 Aracati-CE, Brazil
cDepartamento de Engenharia Hidráulica e Ambiental, Bloco 713, Centro de Tecnologia,
Universidade Federal do Ceará, Campus do Pici, 60440-900 Fortaleza-CE, Brazil
dInstituto Federal de Educação, Ciência e Tecnologia do Sertão Pernambucano,
Campus Petrolina, 56314-520 Petrolina-PE, Brazil
Perfumes are products mainly consisting of ethyl alcohol, water and fragrance. These fragrances are responsible for characterizing the pleasant and unique odor of each perfume. Among the fragrances, we highlight a group of fragrances which can cause contact allergy, leading to dermatitis. Brazilian and the European law state that when these concentrations of allergenic fragrances exceed the limit of 0.01% for non-rinse products and 0.001% for products with rinsing, the manufacturer is obliged to discriminate on its label their presence. This work aims to quantify allergic fragrances in original and Brazilian perfume using solid-phase microextraction and analyze by gas chromatography-mass detector.
Keywords: solid-phase microextraction, allergic fragrances, perfumes
Introduction
Perfumes are products of great importance in the cosmetic industry. Their essential fragrance composition is formed by ethanol and water, in which each product has a unique formulation which allows unique characteristics.1
Fragrances are volatile organic compounds and semi-volatile compounds which have pleasant scent characteristics. For this reason, they are used in perfumes or scented products of different purposes.2 Some of these
fragrances when used by some individuals may manifest allergic reaction when they come into direct contact with skin.3 Clinical studies on this allergic reaction were carried
out first in European Union and then Brazil to adopt more stringent legislation regarding these types of compounds.4,5
Some perfume components at high concentrations can cause allergic reactions. Among these compounds, stands out a group of allergic fragrances that, according to Resolution No. 3/2012 of the National Health Surveillance
Agency (ANVISA, Brazil),5 when found in excess
0.001% (m/m) and 0.01% (m/m) concentrations in products without and with rinsing, respectively, the dermocosmetic product should discriminate in its label their presence.
The gas chromatography mass spectrometry (GC-MS) is the most widely used technique in the analysis of fragrances.6,7 Other techniques have also been recently
used such as two-dimensional gas chromatography coupled with flame ionization detector,8,9 electronic nose10 and
electrospray ionization coupled to mass spectrometer.2,11
The literature reports some works on analysis of allergic fragrances in various matrices such as baby bathwater,4
fragrances,8,9 cosmetics,12-14 shampoo,15 toys,16 water types
(pool and sewage),17 indoor air18 and fragrance oils.19
Due to the lack of studies in Brazil on products that can cause allergy and in order to assist the current health legislation, given the large market for skin cosmetics, we sought to investigate and quantify these compounds in perfume samples.
fragrances in Brazilian perfumes with minimal amounts of samples, using solid phase microextraction (SPME) and GC-MS.
Experimental
Materials
In this study were investigated the standards of allergenic fragrances: 3,7-dimethyl-1,6-octadien-3-ol (linalool, 97.2%); 3,7-dimethyloct-6-en-1-ol (citronellol, 96.6%); 2-methoxy-4-prop-2-enyl phenol (eugenol, 99.6%); 2H-1-benzopyran-2-one (coumarin, 100%); 3,7,11-trimethyldodeca-2,6,10-trien-1-ol (farnesol, 98%); 3,7-dimethylocta-2,6-dienal (citral, 95.4%); 4-methoxybenzene ethanol (anisyl alcohol, 99.8%); 2-methoxy-4-(1-propenyl) phenol (isoeugenol, 100%); 2-(phenylmethylene)-heptanal (amylcinnamaldehyde, 98.3%); 3-phenyl phenylmethyl ester-2-propenoic acid (benzyl cinnamate, 100%); 3-methyl-4-(2,6,6-trimethyl-2-cyclohexen-1-yl)-3-buten-2-one (α-isomethylionone, 100%); 3,7-dimethyl-2,6-octadien-1-ol (geraniol, 95.0%); 2-(phenylmethylene)-1-heptanol (amylcinnamic alcohol, 96.0%); 3-(4-tert-butylphenyl)-2-methylpropanal (lilial®, 100%); 4-(4-hydroxy-4-methylpentyl) cyclohex-3-ene-1-carbaldehyde (lyral®, 100%); 2-hydroxyphenyl-methyl ester benzoic acid (benzyl salicylate, 100%); 2-octynoic acid methyl ester (methyl 2-octynoate, 100%); 7-hydroxy-3,7-dimethyloctanal (hydroxycitronellal, 99.8%); 3-phenyl-2-propenal (cinnamaldehyde, 98.4%); 2-(phenylmethylene) octanal (hexylcinnamic aldehyde, 100%); and 3-phenyl-2-propen-1-ol (cinnamic alcohol, 94.8%) for 1000 mg L-1
concentration (Acunstandart, USA). SPME manual holders, 65 µm polydimethylsiloxane/divinylbenzene (PDMS/DVB) fibers and vial 40 mL supplied by Supelco (Bellefonte, PA, USA), methanol grade HPLC (Merck, Brazil), NaCl PA (Vetec, Brazil) and ultrapure water obtained from a Milli-Q water purification system (Millipore, Billerica, MA, USA) were also used.
Samples
A total number of 25 fragrances were acquired: 10 dealer perfumes of authorized Brazilian brand A (PA), 5 perfumes of authorized brand B (PB) and 10 similar perfumes of brand A (PSA) found in informal trade as shown in Table 1.
Gas chromatography-mass spectrometry (GC-MS)
The determination of the allergenic fragrance was performed on a gas chromatograph coupled with a mass
detector type quadrupole GC-MS-QP2010 Plus model (Shimadzu, Japan) equipped with a DB5 column (Agilent, USA) (30 m length, 0.25 mm internal diameter and 0.25 µm film thickness, 5% phenyl and 95% polydimethylsiloxane). Helium (99.99%) was used as the carrier gas at constant flow of 1 mL min-1.
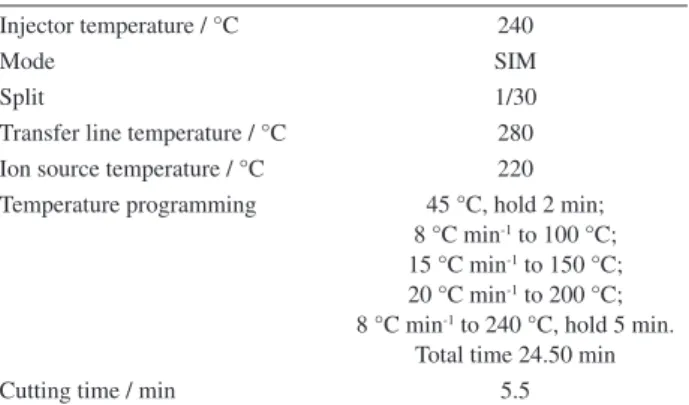
The mass spectrometer conditions were set as follows: ionization mode: electron ionization (EI), 70 eV; ion source temperature 220 °C and transfer line temperature 280 °C. Quantitative analysis was performed in the selected ion monitoring (SIM) mode based on the use of one quantitative fragment and two or three qualitatives fragments. Tables 2 and 3 show the temperature program and the conditions of GC-MS and analyzed fragments. Table 3 shows the retention times of allergic fragrances and their quantitative and qualitative fragments used in SIM method.
Analysis of allergic fragrance perfume by HS-SPME-GC-MS
Previously, a multi-element stock solution in methanol of 10,000 µg L-1 allergenic fragrances was prepared. The
Table 1. Perfume sample: brand A, brand B and similar brand A
Perfume Type Brand
PA 1-10 original A
PB 1-5 original B
PSA 1-10 similar A
Table 2. Chromatographic conditions
Injector temperature / °C 240
Mode SIM
Split 1/30
Transfer line temperature / °C 280
Ion source temperature / °C 220
Temperature programming 45 °C, hold 2 min; 8 °C min-1 to 100 °C; 15 °C min-1 to 150 °C; 20 °C min-1 to 200 °C; 8 °C min-1 to 240 °C, hold 5 min.
Total time 24.50 min
Cutting time / min 5.5
Table 3. SIM mode: time and fragments
time / min Fragments
5.50-9.42 68; 67; 93; 79; 108 and 77
9.42-10.83 71; 43 and 41
10.83-18.97 41; 95; 67; 69; 44; 68; 84; 131; 103; 132; 59; 43; 71; 92; 91; 78; 164; 149; 118; 146; 89; 77; 135; 107; 150;
189; 147; 115; 129; 117; 104; 79; 93; 133; 105; 65; 138; 109 and 94
following dilutions of the multi-element stock solution, 1-50 µg L-1, were prepared in milli-Q solvent water. The
extraction of the compounds was carried out using 10 mL of solution by adding 2 g NaCl and transferred to a 40 mL vial. The sealed vial was stirred 5 min at 100 °C. After this period, the fiber was exposed in a headspace (HS) for 20 min. Shortly after the analytes extraction, the fiber was taken and brought to the remaining gun for 15 min for complete desorption of analytes in the GC injector. This method is based on the procedure adopted by Lamas et al.4 and Becerril et al.17
Method validation
Twenty one allergenic fragrances in perfumes were analyzed by HS-SPME-GC-MS. Validation parameters such as linearity, selectivity, limits of detection (LOD) and quantification (LOQ), accuracy and precision were determined according to guidelines of ANVISA-2003 and ABNT NBR 14029.20,21 The external standard analytical
curves were plotted with proper amounts of standard solutions at the concentration range of 1-50 µg L-1. The
significance test of the curves calibration parameters was based on a hypothesis test applying the parameter t test (equations 1 and 2):
(1)
(2)
where A is the experimental angular coefficient; α = 1 is the theoretical angular coefficient; tcalc,A is the t value calculated
for the slope; SA is the standard deviation of the slope; B is
the experimental linear coefficient; β = 0 is the theoretical linear coefficient; SB is the standard deviation of the
intercept; tcalc,B is the t value calculated for the intercept.22,23
LOD and LOQ values were estimated in the SIM mode analysis as the lowest concentration injected. The values for LOD and LOQ were calculated taking into account the standard deviation (SD) of repetitions (n = 7) of the chromatographic analysis of the lowest point (1 µg L-1) of
the curve and the slope equation (AC) based on ANVISA20
(equations 3 and 4).
(3)
(4)
Precision of the method was evaluated by repeatability
(intraday) and intermediate precision (interday) of sample solutions. The intermediate precision assays were performed in three levels of 1, 10 and 30 µg L-1 for three
consecutive days (n = 3) and repeatability tests at a level of 30 µg L-1 (n = 6). The results were expressed as %RSD
of the measurements. Accuracy of the method was tested with recovery experiments, performed with five replicates of blank samples spiked with 21 allergic fragrances (5, 10 and 30 µg L-1) according to guidelines of ANVISA.20
Results and Discussion
Selectivity
In literature studies7,9,24,25 have been shown that for
allergic fragrances analysis, GC-MS in SIM mode operating system is good option to the resolution of co-elution of some compounds, however, the two-dimensional chromatographic system has shown promise.
Figure 1 shows the total ion chromatogram (TIC) for all the studied compounds of the allergenic fragrance and can be observed some co-elution peaks. The co-elution occurred between citronellol (3) and anisyl alcohol (8); hydroxycitronellal (7) and citral isomer (4a); citral isomer (4b), cinnamaldehyde (6) and eugenol (10); cinnamic alcohol (9), α-isomethylioneno (13) and lyral® (16); coumarin and lilial® (12).
As can be seen in the Figure 1, the scan mode was not efficient to solve the problems of co-elution. Due to this, was chosen in order to work in SIM, because the it solved the co-elution problems and increase the sensibility, as shown in Figures 2-5.
The SIM method solves the problem of co-eluting compounds, for example, as can be seen in Figures 2 and 3, between the citral (m/z 84 and 94) and hydroxycitronellol (m/z 59). In Figures 4 and 5 can be seen between anisyl alcohol (m/z 138) and citronellol (m/z 41, 67 and 69). Table 4 shows the retention time and identification and quatitation fragments of the analytes (see Suplementary Information, Figures S1-S17).
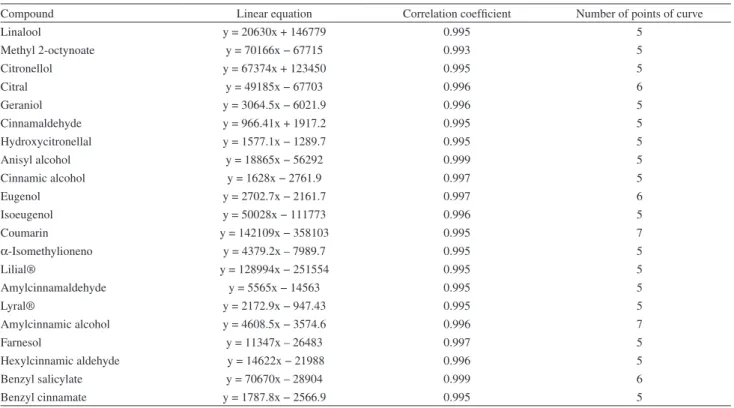
Linearity
The calibration curves of the compounds related to allergic 21 fragrances and their correlation coefficients (R) are given in Table 5. It can be noted that all curves have an appropriate correlation coefficient value according to ANVISA.20 The curves obtained by external standard showed
good linearity as well as the results obtained by Lamas et al.4
and Becerril et al.17 On the other hand, Debonneville and
use of two internal standards (1,4-dibromobenzene and 4,4-dibromobiphenyl) with direct injection.
Moreover, results of Table 5 showed that the technique of applying HS-SPME for those compounds did not require the use of an internal standard. However, the application of HS-SPME technique provides low limit of detection (at µg L-1) for determination of these compounds within a
very satisfactory linear range. The contrast was observed by studying only the headspace process as demonstrated by Sanchez et al.14 which did not achieve a good linearity
to the level of µg L-1. These results are important from an
analytical point of view, because, when working with level
of concentration in µg L-1, small amounts of solutes can
be quantified in analytical sample, minimizing the matrix effect, in addition to preserve the integrity of the instrument.
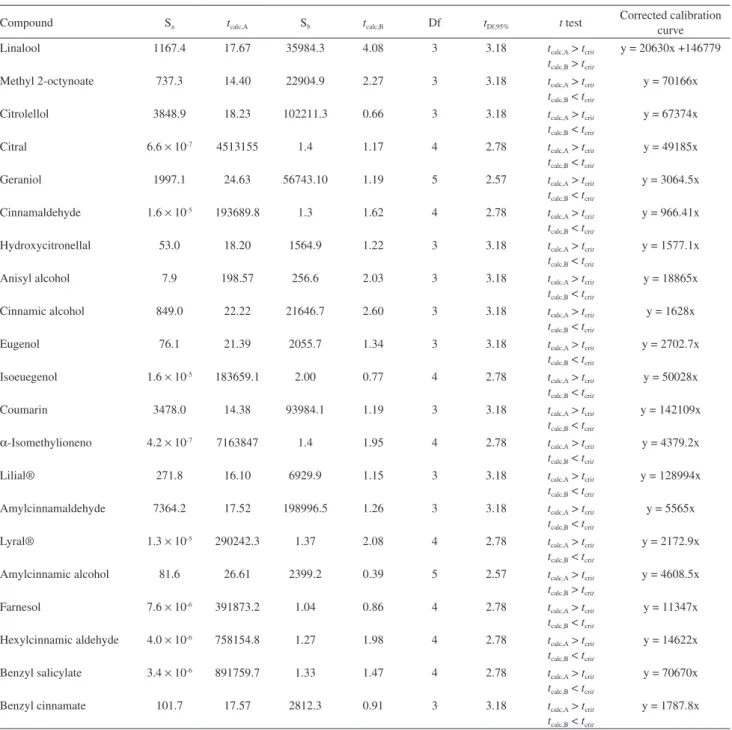
Parameter significance testing of calibration curves
Ideally, the regression lines obtained for the calibration curve should pass through the origin, that is, the intercept of the curve passing through the point (0, 0) of the Cartesian axes. In order to evaluate the statistical significance of the regression parameters A and B, the models obtained experimentally for the calibration curves, it is useful to
Figure 1. Total ion chromatogram (TIC) from the 21 allergic fragrances in scan mode: 1: linalool; 2: methyl 2-octynoate; 3: citronellol; 4a and 4b: citral; 5: geraniol; 6: cinnamaldehyde; 7: hydroxycitronellal; 8: anisyl alcohol; 9: cinnamic alcohol; 10: eugenol; 11: isoeugenol; 12: coumarin; 13: α-isomethylioneno; 14: lilial®; 15: amylcinnamaldehyde; 16: lyral®; 17: amylcinnamic alcohol; 18a and 18b: farnesol; 19: hexylcinnamic aldehyde; 20: benzyl salicylate; and 21: benzyl cinnamate.
Figure 2. Chromatogram with citral fragments (m/z 84 and 94).
Figure 3. Chromatogram with hydroxycitronellal fragments (m/z 59).
Figure 4. Chromatogram with anisyl alcohol fragments (m/z 138).
Table 4. Retention time and identification and quatitation fragments of the analytes
Compound Retention time / min Identification (m/z) Quantification (m/z)
Linalool 10.75 41; 43; 71 41; 43; 71
Methyl 2-octynoate 12.25 67; 95 95
Citrolellol 12.59 41; 67; 69 41; 67; 69
Citral 12.8 84; 94 84; 94
13.1 84; 94 84; 94
Geraniol 12.9 41; 69 41; 69
Cinnamaldehyde 13.15 77; 131 131
Hydroxycitronellal 12.75 59; 95 59
Anisyl alcohol 12.6 138; 109 138
Cinnamic alcohol 15.25 91; 92 91
Eugenol 13.2 103 103
Isoeuegenol 14.09 164 164
Coumarin 15.6 89; 118; 146 89; 118; 146
α-Isomethylioneno 15.25 107; 135; 150 107; 135; 150
Lilial® 15.64 131; 189 131; 189
Amylcinnamaldehyde 16.67 91; 115; 117 91; 115; 117
Lyral® 15.25 59; 79 79
Amylcinnamic alcohol 16.98 91; 115; 133 133
Farnesol 17.1 69; 93 69; 93
17.25
Hexylcinnamic aldehyde 17.55 129 129
Benzyl salicylate 18.75 65; 91 91
Benzyl cinnamate 21.00 77; 91; 131 77; 91; 131
Table 5. Calibration curves, correlation coefficient (R) of the compounds studied in a concentration range 1-50 µg L-1
Compound Linear equation Correlation coefficient Number of points of curve
Linalool y = 20630x + 146779 0.995 5
Methyl 2-octynoate y = 70166x − 67715 0.993 5
Citronellol y = 67374x + 123450 0.995 5
Citral y = 49185x − 67703 0.996 6
Geraniol y = 3064.5x − 6021.9 0.996 5
Cinnamaldehyde y = 966.41x + 1917.2 0.995 5
Hydroxycitronellal y = 1577.1x − 1289.7 0.995 5
Anisyl alcohol y = 18865x − 56292 0.999 5
Cinnamic alcohol y = 1628x − 2761.9 0.997 5
Eugenol y = 2702.7x − 2161.7 0.997 6
Isoeugenol y = 50028x − 111773 0.996 5
Coumarin y = 142109x − 358103 0.995 7
α-Isomethylioneno y = 4379.2x – 7989.7 0.995 5
Lilial® y = 128994x − 251554 0.995 5
Amylcinnamaldehyde y = 5565x − 14563 0.995 5
Lyral® y = 2172.9x − 947.43 0.995 5
Amylcinnamic alcohol y = 4608.5x − 3574.6 0.996 7
Farnesol y = 11347x – 26483 0.997 5
Hexylcinnamic aldehyde y = 14622x − 21988 0.996 5
Benzyl salicylate y = 70670x – 28904 0.999 6
Benzyl cinnamate y = 1787.8x − 2566.9 0.995 5
compare them with theoretically expected values α and β, with α = 1 and β = 0.2,22
To evaluate the statistical significance of each regression parameter, standard deviations were obtained for the slopes and intercepts of the regression equations and values of the statistical parameter t were calculated for each slope and intercept, according to equations 1 and 2.22,23 The calculated
value of t (tcalc) for the parameters was compared with the
tabulated critical value of t (tcrit), to a confidence level of
95% and the degree of freedom (Df = N − 2) for each calibration. When tcalc is smaller than tcrit the hypothesis
that the difference between the calibration parameters obtained experimentally and theoretically expected value is accepted statistically insignificant, and then the experimental calibration parameters are considered equal to the theoretical value (α = 1 or β = 0). The results are shown in Table 6.
As can be seen in Table 6, the results of the statistical analysis of significance of the regression parameters showed that all inclinations are significant if tcalc,A > tcrit. The
Table 6. Results of the statistical test of significance of the parameters of the calibration curves
Compound Sa tcalc,A Sb tcalc,B Df tDf;95% t test
Corrected calibration curve
Linalool 1167.4 17.67 35984.3 4.08 3 3.18 tcalc,A > tcrit
tcalc,B > tcrit
y = 20630x +146779
Methyl 2-octynoate 737.3 14.40 22904.9 2.27 3 3.18 tcalc,A > tcrit tcalc,B < tcrit
y = 70166x
Citrolellol 3848.9 18.23 102211.3 0.66 3 3.18 tcalc,A > tcrit
tcalc,B < tcrit
y = 67374x
Citral 6.6 × 10⁻⁷ 4513155 1.4 1.17 4 2.78 t
calc,A > tcrit tcalc,B < tcrit
y = 49185x
Geraniol 1997.1 24.63 56743.10 1.19 5 2.57 tcalc,A > tcrit
tcalc,B < tcrit
y = 3064.5x
Cinnamaldehyde 1.6 × 10⁻⁵ 193689.8 1.3 1.62 4 2.78 t
calc,A > tcrit tcalc,B < tcrit
y = 966.41x
Hydroxycitronellal 53.0 18.20 1564.9 1.22 3 3.18 tcalc,A > tcrit
tcalc,B < tcrit
y = 1577.1x
Anisyl alcohol 7.9 198.57 256.6 2.03 3 3.18 tcalc,A > tcrit
tcalc,B < tcrit
y = 18865x
Cinnamic alcohol 849.0 22.22 21646.7 2.60 3 3.18 tcalc,A > tcrit
tcalc,B < tcrit
y = 1628x
Eugenol 76.1 21.39 2055.7 1.34 3 3.18 tcalc,A > tcrit
tcalc,B < tcrit
y = 2702.7x
Isoeuegenol 1.6 × 10⁻⁵ 183659.1 2.00 0.77 4 2.78 t
calc,A > tcrit tcalc,B < tcrit
y = 50028x
Coumarin 3478.0 14.38 93984.1 1.19 3 3.18 tcalc,A > tcrit
tcalc,B < tcrit
y = 142109x
α-Isomethylioneno 4.2 × 10⁻⁷ 7163847 1.4 1.95 4 2.78 t
calc,A > tcrit tcalc,B < tcrit
y = 4379.2x
Lilial® 271.8 16.10 6929.9 1.15 3 3.18 tcalc,A > tcrit
tcalc,B < tcrit
y = 128994x
Amylcinnamaldehyde 7364.2 17.52 198996.5 1.26 3 3.18 tcalc,A > tcrit tcalc,B < tcrit
y = 5565x
Lyral® 1.3 × 10⁻⁵ 290242.3 1.37 2.08 4 2.78 t
calc,A > tcrit tcalc,B < tcrit
y = 2172.9x
Amylcinnamic alcohol 81.6 26.61 2399.2 0.39 5 2.57 tcalc,A > tcrit tcalc,B > tcrit
y = 4608.5x
Farnesol 7.6 × 10⁻⁶ 391873.2 1.04 0.86 4 2.78 t
calc,A > tcrit tcalc,B < tcrit
y = 11347x
Hexylcinnamic aldehyde 4.0 × 10⁻⁶ 758154.8 1.27 1.98 4 2.78 t
calc,A > tcrit tcalc,B < tcrit
y = 14622x
Benzyl salicylate 3.4 × 10⁻⁶ 891759.7 1.33 1.47 4 2.78 t
calc,A > tcrit tcalc,B < tcrit
y = 70670x
Benzyl cinnamate 101.7 17.57 2812.3 0.91 3 3.18 tcalc,A > tcrit
tcalc,B < tcrit
y = 1787.8x
intercept, with the exception of the compound of linalool curve, is not significant, considering that tcalc,B < tcrit and was
considered as statistically equal to β, which has a value of zero reference. Therefore, the equations of the curves applied to the calculations of the analytes concentrations are the ones shown in Table 6, with a 95% confidence level. Among the tested compounds, the only compound which shows the statistically significant linear coefficient is linalool.
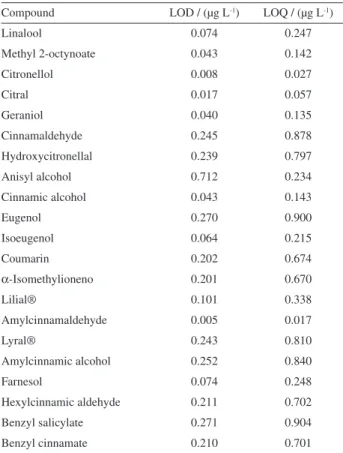
Limits of detection (LOD) and quantification (LOQ)
The results for the limits of detection (LOD) and quantification (LOQ) are shown in Table 7. The LOD and LOQ values calculated in this work took into account the standard deviation (SD) of repetitions (n = 7) of the chromatographic analysis of the lowest point (1 µg L-1) of
the curve and the slope equation (AC) based on ANVISA.20
Precision
The analysis of the coefficient of variation values (CV%), repeatability and intermediate precision showed values ranging from 2.6 to 19.2%, as seen in Table 8. According to ANVISA, an acceptable value is around 5%;
however, because of the magnitude of these compounds in the sample to the level 1 µg L-1, other references20,21,26 also
accept a variation coefficient value of up to 20%. Therefore, our results can be considered acceptable, because, according to the norm of ABNT NBR 14029,21 which stipulates that
for a chemical analysis of the magnitude 10-100 µg L-1,
the value of coefficient of variation between 23 to 32% is accepted, although this rule is for pesticide analysis at this level of concentration.
Our results of intermediate precision presented values lower than 20%, however the literature reports results lower than 10%. However, values obtained in this study (1, 10 and 30 µg L-1) do not follow a quantitative standard for
intermediate precision as expected, but it was also observed in other studies.17 Analyzing the CV% for the repeatability
study in Table 8, it can be seen that the values were above 15%. These values are acceptable according to the standard 14029 of ABNT-NBR.21 However, when compared to
literature data,17 it is noted that the CV values obtained are
less than 10%, but these results are for concentration of 20 µg L-1. Therefore, as in this work the concentration of
the compounds studied was 30 µg L-1, then the difference
in the CV values may be due to this fact.
Recovery
Recovery results were satisfactory for most of the 21 compounds analyzed according to ANVISA standard.20
Looking at Table 9, the compounds which showed poor recovery were cinnamic alcohol (10 and 30 µg L-1) and
lilial (30 µg L-1), but considering the RSD these results
are consistent with current regulations of 70-120%. The comparison of the recovery values obtained with literature data4,17 indicates that our values are lower. This
can be explained by the complex nature of the perfume composition, which can interfere with the recovery rate of the studied compounds.
Analysis of perfumes
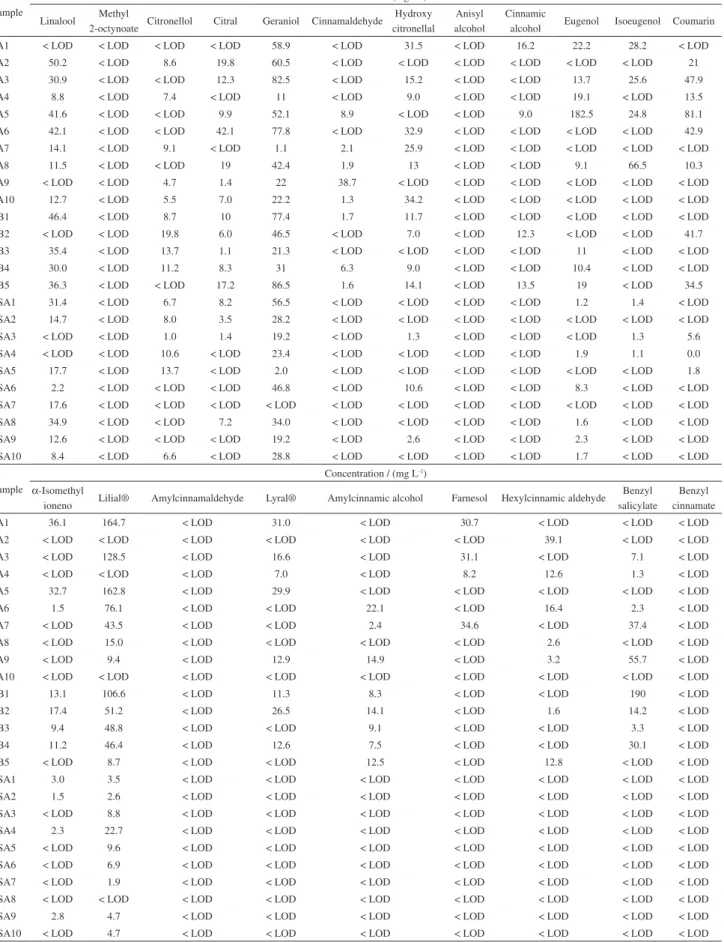
From the results of the analyzes of perfumes (Table 10), it can be observed the presence of some of these fragrances in high concentrations that can cause allergy and thus they need to be informed in the products’ labels for consumers’ knowledge and meet the current legislation. Among the fragrances studied it was observed that the original perfumes (brands A and B) present allergenic fragrances in high concentrations for all the range of molar weight of the compounds. However, for the similar perfumes was not observed for fragrances with high molar weight, such as benzyl cinnamate and hexylcinnamic aldehyde. This can
Table 7. Limit of detection (LOD) and limit of quantification (LOQ) of allergic fragrances
Compound LOD / (µg L-1) LOQ / (µg L-1)
Linalool 0.074 0.247
Methyl 2-octynoate 0.043 0.142
Citronellol 0.008 0.027
Citral 0.017 0.057
Geraniol 0.040 0.135
Cinnamaldehyde 0.245 0.878
Hydroxycitronellal 0.239 0.797
Anisyl alcohol 0.712 0.234
Cinnamic alcohol 0.043 0.143
Eugenol 0.270 0.900
Isoeugenol 0.064 0.215
Coumarin 0.202 0.674
α-Isomethylioneno 0.201 0.670
Lilial® 0.101 0.338
Amylcinnamaldehyde 0.005 0.017
Lyral® 0.243 0.810
Amylcinnamic alcohol 0.252 0.840
Farnesol 0.074 0.248
Hexylcinnamic aldehyde 0.211 0.702
Benzyl salicylate 0.271 0.904
Table 8. Intermediate precision and repeatability of allergic fragrances
Compound Intermediate precision Repeatability
1 µg L-1 (n = 3) 10 µg L-1 (n = 3) 30 µg L-1 (n = 3) 30 µg L-1 (n = 6)
Linalool 4.4 (6.4)a 2.6 (12)b 19.3 (4.6)c 16.3 (1)d
Methyl 2-octynoate 9.7 (8.6)a 6.9 (12)b 13.6 (8.6)c 8.6 (1)d
Citronellol 1.6 (8.7)a 3.1 (7.9)b 10.2 (6.5)c 14.0 (9.6)d
Citral 8.2 (1.2)a 6.2 (3.4)b 10.9 (2.9)c 15.6 (0.8)d
Geraniol 14.9 (6.6)a 8.3 (5.3)b 13.3 (2.5)c 13.9 (0.6)d
Cinnamaldehyde 13.3 (7.7)a 5.6 (12)b 7.5 (4.3)c 13.0 (1)d
Hydroxycitronellal 15.3 (4.3)a 4.1 (11)b 16.4 (3.7)c 15.2 (3.6)d
Anisyl alcohol 15.8 (3.6)a 11.9 (11)b 18.4 (6.0)c 15.4 (7.1)d
Cinnamic alcohol 4.4 (5.3)a 5.7 (5.4)b 10.9 (7.5)c 16.2 (5.9)d
Eugenol 15.4 (6.5)a 10.7 (6.6)b 4.8 (3.9)c 15.7 (2.8)d
Isoeugenol 6.6 (6.3)a 13.9 (0.6)b 3.7 (2.4)c 6.7 (3)d
Coumarin 6.5 (7.1)a 13.5 (7.7)b 9.8 (3.7)c 17.5 (4.3)d
α-Isomethylioneno 3.1 (7.0)a 5.4 (2.5)b 11.2 (0.8)c 13.8 (0.9)d
Lilial® 3.0 (4.8)a 11.3 (4.8)b 8.7 (3.0)c 16.3 (1.6)d
Amylcinnamaldehyde 9.5 (4.6)a 16.9 (8.9)b 6.3 (3.7)c 19.7 (2.5)d
Lyral® 18.0 (11)a 7.4 (17)b 12.5 (3.2)c 8.9 (1.4)d
Amylcinnamic alcohol 14.3 (5.9)a 11.4 (5.5)b 15.5 (4.3)c 14.4 (0.8)d
Farnesol 10.2 (7.1)a 11.2 (6.3)b 13.9 (1.9)c 16.8 (1.4)d
Hexylcinnamic aldehyde 3.6 (4.0)a 5.9 (8.8)b 13.2 (3.3)c 16.1 (2.5)d
Benzyl salicylate 16.8 (11)a 17.9 (3.2)b 7.3 (9.2)c 15.6 (7.6)d
Benzyl cinnamate 13.6 (12)a 12.0 (15)b 12.8 (5.3)c 19.2 (6.8)d
aIntermediate precision 5 µg L-1 (N = 5);17 bintermediate precision 10 µg L-1 (N = 5);17cintermediate precision 20 µg L-1 (N = 5);17drepeatability 20 µg L-1 (N = 3).17
Table 9. Recovery of allergic fragrances
Compound Recovery (RSD) / %
5 µg L-1 (n = 3) 10 µg L-1 (n = 3) 30 µg L-1 (n = 3)
Linallol 70 ± 13.1 111 ± 8.3 75 ± 8.4
Methyl 2-octynoate 72 ± 11.3 88 ± 4.9 92 ± 5.7
Citronellol 90 ± 5.8 80 ± 11.5 107 ± 6.3
Citral 70 ± 6.7 88 ± 7.4 98 ± 9.7
Geraniol 86 ± 8.4 73 ± 13.6 76 ± 6.2
Cinnamaldehyde 83 ± 7.9 77 ± 10.5 94 ± 8.2
Hydroxycitronellal 69 ± 7.5 87 ± 9.1 105 ± 6.6
Anisyl alcohol 78 ± 12.1 86 ± 7.2 82 ± 12.4
Ainnamic alcohol 86 ± 8.7 59 ± 4.5 66 ± 10.3
Eugenol 78 ± 9.5 76 ±5.7 103 ± 8.1
Isoeugenol 89 ± 13.2 82 ± 4.8 110 ± 4.8
Coumarin 103 ± 7.1 94 ± 6.9 88 ± 12.9
α-Isomethylioneno 73 ± 4.9 113 ± 4.2 109 ± 8.4
Lilial® 87 ± 7.7 66 ± 11.2 89 ± 3.9
Amylcinnamaldehyde 86 ± 9.4 114 ± 8.2 101 ± 11.9
Lyral® 72 ± 6.9 115 ± 9.0 112 ± 7.9
Amylcinnamic alcohol 81 ± 4.7 90 ± 6.6 87 ± 7.4
Farnesol 80 ± 7.3 111 ± 8.9 78 ± 4.9
Hexylcinnamic aldehyde 92 ± 5.9 85 ± 5.4 98 ± 9.6
Benzyl salicylate 71 ± 8.7 93 ± 8.5 102 ± 5.3
Table 10. Result analysis fragrances in original perfumes and similar
Sample
Concentration / (mg L-1)
Linalool Methyl
2-octynoate Citronellol Citral Geraniol Cinnamaldehyde
Hydroxy citronellal
Anisyl alcohol
Cinnamic
alcohol Eugenol Isoeugenol Coumarin
PA1 < LOD < LOD < LOD < LOD 58.9 < LOD 31.5 < LOD 16.2 22.2 28.2 < LOD
PA2 50.2 < LOD 8.6 19.8 60.5 < LOD < LOD < LOD < LOD < LOD < LOD 21
PA3 30.9 < LOD < LOD 12.3 82.5 < LOD 15.2 < LOD < LOD 13.7 25.6 47.9
PA4 8.8 < LOD 7.4 < LOD 11 < LOD 9.0 < LOD < LOD 19.1 < LOD 13.5
PA5 41.6 < LOD < LOD 9.9 52.1 8.9 < LOD < LOD 9.0 182.5 24.8 81.1
PA6 42.1 < LOD < LOD 42.1 77.8 < LOD 32.9 < LOD < LOD < LOD < LOD 42.9
PA7 14.1 < LOD 9.1 < LOD 1.1 2.1 25.9 < LOD < LOD < LOD < LOD < LOD
PA8 11.5 < LOD < LOD 19 42.4 1.9 13 < LOD < LOD 9.1 66.5 10.3
PA9 < LOD < LOD 4.7 1.4 22 38.7 < LOD < LOD < LOD < LOD < LOD < LOD
PA10 12.7 < LOD 5.5 7.0 22.2 1.3 34.2 < LOD < LOD < LOD < LOD < LOD
PB1 46.4 < LOD 8.7 10 77.4 1.7 11.7 < LOD < LOD < LOD < LOD < LOD
PB2 < LOD < LOD 19.8 6.0 46.5 < LOD 7.0 < LOD 12.3 < LOD < LOD 41.7
PB3 35.4 < LOD 13.7 1.1 21.3 < LOD < LOD < LOD < LOD 11 < LOD < LOD
PB4 30.0 < LOD 11.2 8.3 31 6.3 9.0 < LOD < LOD 10.4 < LOD < LOD
PB5 36.3 < LOD < LOD 17.2 86.5 1.6 14.1 < LOD 13.5 19 < LOD 34.5
PSA1 31.4 < LOD 6.7 8.2 56.5 < LOD < LOD < LOD < LOD 1.2 1.4 < LOD
PSA2 14.7 < LOD 8.0 3.5 28.2 < LOD < LOD < LOD < LOD < LOD < LOD < LOD
PSA3 < LOD < LOD 1.0 1.4 19.2 < LOD 1.3 < LOD < LOD < LOD 1.3 5.6
PSA4 < LOD < LOD 10.6 < LOD 23.4 < LOD < LOD < LOD < LOD 1.9 1.1 0.0
PSA5 17.7 < LOD 13.7 < LOD 2.0 < LOD < LOD < LOD < LOD < LOD < LOD 1.8
PSA6 2.2 < LOD < LOD < LOD 46.8 < LOD 10.6 < LOD < LOD 8.3 < LOD < LOD
PSA7 17.6 < LOD < LOD < LOD < LOD < LOD < LOD < LOD < LOD < LOD < LOD < LOD
PSA8 34.9 < LOD < LOD 7.2 34.0 < LOD < LOD < LOD < LOD 1.6 < LOD < LOD
PSA9 12.6 < LOD < LOD < LOD 19.2 < LOD 2.6 < LOD < LOD 2.3 < LOD < LOD
PSA10 8.4 < LOD 6.6 < LOD 28.8 < LOD < LOD < LOD < LOD 1.7 < LOD < LOD
Sample
Concentration / (mg L-1)
α-Isomethyl
ioneno Lilial® Amylcinnamaldehyde Lyral® Amylcinnamic alcohol Farnesol Hexylcinnamic aldehyde Benzyl salicylate
Benzyl cinnamate
PA1 36.1 164.7 < LOD 31.0 < LOD 30.7 < LOD < LOD < LOD
PA2 < LOD < LOD < LOD < LOD < LOD < LOD 39.1 < LOD < LOD
PA3 < LOD 128.5 < LOD 16.6 < LOD 31.1 < LOD 7.1 < LOD
PA4 < LOD < LOD < LOD 7.0 < LOD 8.2 12.6 1.3 < LOD
PA5 32.7 162.8 < LOD 29.9 < LOD < LOD < LOD < LOD < LOD
PA6 1.5 76.1 < LOD < LOD 22.1 < LOD 16.4 2.3 < LOD
PA7 < LOD 43.5 < LOD < LOD 2.4 34.6 < LOD 37.4 < LOD
PA8 < LOD 15.0 < LOD < LOD < LOD < LOD 2.6 < LOD < LOD
PA9 < LOD 9.4 < LOD 12.9 14.9 < LOD 3.2 55.7 < LOD
PA10 < LOD < LOD < LOD < LOD < LOD < LOD < LOD < LOD < LOD
PB1 13.1 106.6 < LOD 11.3 8.3 < LOD < LOD 190 < LOD
PB2 17.4 51.2 < LOD 26.5 14.1 < LOD 1.6 14.2 < LOD
PB3 9.4 48.8 < LOD < LOD 9.1 < LOD < LOD 3.3 < LOD
PB4 11.2 46.4 < LOD 12.6 7.5 < LOD < LOD 30.1 < LOD
PB5 < LOD 8.7 < LOD < LOD 12.5 < LOD 12.8 < LOD < LOD
PSA1 3.0 3.5 < LOD < LOD < LOD < LOD < LOD < LOD < LOD
PSA2 1.5 2.6 < LOD < LOD < LOD < LOD < LOD < LOD < LOD
PSA3 < LOD 8.8 < LOD < LOD < LOD < LOD < LOD < LOD < LOD
PSA4 2.3 22.7 < LOD < LOD < LOD < LOD < LOD < LOD < LOD
PSA5 < LOD 9.6 < LOD < LOD < LOD < LOD < LOD < LOD < LOD
PSA6 < LOD 6.9 < LOD < LOD < LOD < LOD < LOD < LOD < LOD
PSA7 < LOD 1.9 < LOD < LOD < LOD < LOD < LOD < LOD < LOD
PSA8 < LOD < LOD < LOD < LOD < LOD < LOD < LOD < LOD < LOD
PSA9 2.8 4.7 < LOD < LOD < LOD < LOD < LOD < LOD < LOD
be explained due to the low capacity of scent fixation of similars perfumes when compared to originals.
Conclusion
This technique can be used for analysis of allergic fragrance perfume using small amount of sample for analysis. This study may be a help to ANVISA in the control of allergic fragrances in perfumes. The results indicate that the similar perfumes do not present allergenic fragrances with high molecular weight, which influences an inferior scent fixation when compared to the original perfumes.
Supplementary Information
Supplementary data are available free of charge at http://jbcs.sbq.org.br as PDF file.
Acknowledgments
Thanks to the funders of the research project CNPq (Proc. No. 304888/2014-1), FUNCAP, CAPES and Department of Analytical Chemistry and Physical-Chemistry, Federal University of Ceará.
References
1. Gomes, C. L.; Lima, A. C. A.; Cândido, M. C. L.; Silva, A B. R.; Loyola, A. R. L.; Nascimento, R. F.; J. Braz. Chem. Soc. 2015, 26, 1730.
2. Haddad, R.; Catharino, R. R.; Marques, L. A.; Eberlin, M. N.; Rapid Commun. Mass Spectrom. 2008, 22, 3662.
3. Davies, R. F.; Jhonston, G. A.; Dermatol. Clin. 2011, 29, 311. 4. Lamas, J. P.; Sanchez- Prado, L.; Garcia-Jares, C.; Llompart,
M.; Anal. Bioanal. Chem.2010, 397, 2579.
5. ANVISA; Resolução-RDC No 3; Listas de Substâncias que os Produtos de Higiene Pessoal, Cosméticos e Perfumes Não
Devem Conter Exceto nas Condições e com as Restrições
Estabelecidas, Agência Nacional de Vigilância Sanitária, Brasilia, Brazil, 2012.
6. Asten, A. V.; Trends Anal. Chem. 2002, 21, 69.
7. Chaintreau, A.; Joulain, D.; Marin, C.; Schimith, C. O.; Vey, M.; J. Agric. Food Chem. 2003, 51, 6398.
8. Sheillie, R.; Marriott, P.; Chaintreau, A.; Flavour Fragrance J.
2004, 19, 91.
9. Debonneville, C.; Chaintreau, A.; J. Chromatogr. A2004, 1027, 109.
10. Cano, M.; Borrego, V.; Roales, J.; Idígoras, J.; Lopez-Costa, T.; Mendoza, P.; Pedrosa, J. M.; Sens. Actuators B 2011, 156, 319.
11. Marques, L. A.; Catharino, R. R.; Bruns, R. E.; Eberlin, M. N.; Rapid Commun. Mass Spectrom. 2006, 20, 3654.
12. Sgorbini, B.; Ruosi, M. R.; Cordero, C.; Liberto, E.; Rubiolo, P.; Bicchi, C.; J. Chromatogr. A2010, 1217, 2599.
13. Niederer, M.; Bollhalder, R.; Hohl, Ch.; J. Chromatogr. A 2006, 1132, 109.
14. Sanchez, N. M.; Pérez-Pavón, J. L.; Cordero, B. M.; Anal. Bioanal. Chem. 2010, 397, 2579.
15. Chen, Y.; Begnaud, F.; Chaintreau, A.; Pawliszyn, J.; Flavour Fragrance J. 2006, 21, 822.
16. Masuck, I.; Hutzler, C.; Luch, A.; J. Chromatogr. A2010, 1217, 3136.
17. Becerril, E.; Lamas, J. P.; Sanchez-Prado, L.; Llompart, M.; Lores, M.; Garcia-Jares, C.; Talanta 2010, 83, 464.
18. Lamas, J. P.; Sanchez- Prado, L.; Garcia-Jares. C.; Llompart, M.; J. Chromatogr. A2010, 1217, 1882.
19. Leijs, H.; Broekhans, J.; Pelt, L. V.; Mussinan, C.; J. Agric. Food Chem. 2005, 53, 5487.
20. Ellendt, K.; Hempel, G.; Köbler, H.; SOFW J. 2001, 127, 29. 21. Shellie, R.; Marriott, P.; Chaintreau, A.; Flavour Fragrance J.
2004, 19, 91.
22. ANVISA; Resolução RE No. 899.; Guia para Validação de Métodos Analíticos e Bioanalíticos, Agência Nacional de Vigilância Sanitária, Brasilia, Brazil, 2012.
23. ABNT NBR 14029; Agrotóxicos e Afins - Validação de Métodos Analíticos, Associação Brasileira de Normas Técnicas (ABNT), Rio de Janeiro, Brazil, 2005.
24. Ribani, M.; Bottoli, C. B. G.; Collins, C. H.; Jardim, I. C. S. F.; Melo, L. F. C.; Quim. Nova2004, 27, 771.
25. Ligiero, C. B. P.; Reis, L. A.; Parrilha, G. L.; Baptista Filho, M.; Canela, M. C.; Quim. Nova2009, 32, 1338.
26. Guedes, J. A. C.; Silva, I. R. O.; Lima, C. G.; Milhome, M. A. L; Nascimento, R. F.; Food Chem. 2016, 199, 380.
Submitted: October 24, 2016